Long-term evolution of FU Orionis objects at infrared wavelengths††thanks: Based on observations with ISO, an ESA project with instruments funded by ESA member states (especially the PI countries France, Germany, the Netherlands and the United Kingdom) with participation of ISAS and NASA.
We investigate the brightness evolution of 7 FU Orionis systems in the m wavelength range using data from the Infrared Space Observatory (ISO). The ISO measurements were supplemented with 2MASS and MSX observations performed in the same years as the ISO mission (199598). The spectral energy distributions (SEDs) based on these data points were compared with earlier ones derived from the IRAS photometry as well as from ground-based observations carried out around the epoch 1983. In 3 cases (Z CMa, Parsamian 21, V1331 Cyg) no difference between the two epochs was seen within the measurement uncertainties. V1057 Cyg, V1515 Cyg and V1735 Cyg have become fainter at near-infrared wavelengths while V346 Nor has become slightly brighter. V1057 Cyg exhibits a similar flux change also in the mid-infrared. At m most of the sources remained constant; only V346 Nor seems to fade. Our data on the long-term evolution of V1057 Cyg agree with the model predictions of Kenyon & Hartmann (1991) and Turner et al. (1997) at near- and mid-infrared wavelengths, but disagree at m. We discuss if this observational result at far-infrared wavelengths could be understood in the framework of the existing models.
Key Words.:
stars: pre-main sequence – stars: circumstellar matter – stars: individual: V1057 Cyg – infrared: stars1 Introduction
FU Orionis objects are low mass pre-main sequence stars defined as a class by Herbig (1977). Most members of this class have undergone outburst in optical light of 4 mag or more, followed by a fading phase on the timescale of several decades. In some cases (e.g. Z CMa, L1551 IRS 5, BBW 76) eruption in the optical was not observed but they were identified as class members on the basis of their spectral characteristics. For a comprehensive review of FU Orionis objects see Hartmann & Kenyon (1996).
According to the most widely accepted picture the FU Orionis outburst is a consequence of a rapid temporal increase of the disk accretion rate (Hartmann & Kenyon 1996). Predictions of these types of models (e.g. Kenyon & Hartmann 1991, Bell et al. 1995, Turner et al. 1997) have to be confronted with multiwavelength monitoring observations of the outburst period and the fading phase. The fading phase is well documented in the optical/near-infrared (Kopatskaya 1984, Ibragimov & Shevchenko 1988, Kenyon & Hartmann 1991). Very few data have been available so far at mid- and far-infrared wavelengths where thermal emission of the disk and the circumstellar envelope can be observed. Recently the Infrared Space Observatory (ISO, 199598, Kessler et al. 1996) provided new photometric data in the m range on FU Orionis-type stars.
In our study we search for systematic brightness variations during the post-outburst phases of 7 FU Orionis objects at mid- and far-IR wavelengths. We compiled two SEDs for each object: the first one is based on IRAS photometry as well as ground-based observations and is representative of the evolutionary status around 1983. The second SED was compiled from observations taken around 19962000 including data from ISOPHOT the infrared photometer on-board ISO (Lemke et al. 1996), MSX (Egan & Price 1996), and 2MASS (Cutri et al. 2003). The comparison of the two SEDs provides information on the wavelength dependence of the far-infrared flux evolution during a period of 15 years. As an example in the case of V1057 Cyg we present a detailed comparison of our results with the predictions of the models of Kenyon & Hartmann (1991) and Turner et al. (1997).
2 Target list, observations and data reduction
| Object | Outburst | D [pc] | IRAS | MSX | ISO | 2MASS |
|---|---|---|---|---|---|---|
| BBW 761 | 193015 | 170018 | 07486-3258 | G248.7075-03.3686 | 07503560-3306238 | |
| CB34 V2 | 19942 | 150018 | G186.9520-03.8325 | 05470377+2100347 | ||
| FU Ori3 | 193715 | 45018 | 05426+0903 | SWS,LWS | 05452235+0904123 | |
| V1057 Cyg3 | 197015 | 60018, 70019 | G085.4595-01.0468 | PHT,LWS | 20585371+4415283 | |
| V1515 Cyg3 | 1950s15 | 100018, 10503 | 20220+4202 | G079.9187+02.7391 | PHT | 20234802+4212257 |
| L1551 IRS 54 | ? | 14018 | 04287+1801 | 04313407+1808049 | ||
| PP 13S5 | 190016 | 30018 | 04073+3800 | 04104088+3807517 | ||
| Parsamian 216 | ? | 180018, 40020 | 19266+0932 | G045.8149-03.8309 | PHT | 19290085+0938429 |
| Re 50 N IRS17 | 1960-7017 | 46018 | PHT,SWS | ? | ||
| V1331 Cyg8 | ? | 55018, 70019 | 20595+5009 | G090.3121+02.6774 | LWS | 21010920+5021445 |
| V1735 Cyg9 | 1957-6515 | 90018 | 21454+4718 | G093.7587-04.6371 | PHT,LWS,SWS | 21472065+4732035 |
| V346 Nor10 | 198415 | 70018 | 16289-4449 | G338.5458+02.1178 | CAM,PHT,LWS,SWS | 16323219-4455306 |
| V883 Ori7 | ? | 46018 | 05358-0704 | 05381810-0702259 | ||
| Z CMa11 | ? | 93018, 115021 | 07013-1128 | G224.6077-02.5574 | PHT,LWS,SWS | 07034316-1133062 |
| RNO 1B12 | ? | 85018 | 00338+6312 | G121.2940+00.6572 | CAM,LWS,SWS | 00364599+6328529 |
| RNO 1C13 | ? | 85018 | 00338+6312 | G121.2940+00.6572 | CAM,LWS,SWS | 00364659+6328574 |
| AR 6A22 | ? | 80022 | G203.2028+02.0653 | 06405930+0935523 | ||
| AR 6B22 | ? | 80022 | G203.2028+02.0653 | 06405930+0935523 | ||
| OO Ser14 | 199514 | 31123 | CAM,PHT,LWS,SWS | 18294913+0116206 | ||
| V1647 Ori24 | 2004 | 40025 | 05436-0007 | CAM | 05461313-0006048 |
2.1 Up-to-date catalogue of FU Orionis objects
When Herbig (1977) defined the class of FU Orionis objects, there were only three known members. Since then a number of new objects have been identified. As a first step of our study we compiled an up-to-date list of FU Ori stars. We included FU Ori candidates without attempting to homogenise the identification criteria of different authors. The resulting catalogue, which is to a large extent similar to the list of Sandell & Weintraub (2001), is presented in Tab. 1. In this table Col. 1 refers to the original paper where the object was identified as FU Ori type. The next two columns give the date of outburst (if known) and the distance to the object, respectively. Associated sources in the IRAS and MSX catalogues are given only in the case of good positional coincidence with the optical coordinates. The RNO 1B/1C system (separation ) was detected but unresolved by both IRAS and MSX. Column 6 shows which of the four ISO instruments (ISOCAM, ISOPHOT, ISO-LWS, ISO-SWS) observed the source. These observations are available for the public in the ISO Data Archive111www.iso.vilspa.esa.es/ida/. The last column identifies the corresponding sources in the near-infrared 2MASS survey. These source names were derived from the sexagesimal coordinates thus give the equatorial positions for the epoch 2000. (For the position of Re 50 N IRS1 see figure caption.)
2.2 Observations
Table 2 lists the sources of infrared photometric data used in our study. The time distribution of the active periods of the instruments/projects provides a possibility to check for long-term variations of the infrared fluxes between 1983 (IRAS, ground-based data) and 19962001 (ISO, MSX, 2MASS).
From the sources in Tab. 1 we selected those 7 objects for further study where enough data were available at both epochs (1983 and 19962000). Five of them have ISO multifilter observations to create a complete mid/far-infrared SED. One object, Parsamian 21, was measured with ISOPHOT only at 65 and 100m, but MSX data are available at shorter wavelengths. V1331 Cyg was not observed by ISOPHOT, but the availability of MSX fluxes makes possible the study of temporal variation at m. The detailed log of ISOPHOT observations is presented in Tab. 3.
| Instrument | Wavelengths [m] | Aperture | Active period |
|---|---|---|---|
| ground-based | JHKLMNQ | ||
| IRAS | |||
| MSX | |||
| 2MASS | J, H, Ks | ||
| ISOPHOT |
| Object | Wavelengths [m] | Aperture [′′] | Date | Obs. mode | ISO_id |
| V1057 Cyg | 17-Apr-1996 | ON/OFF | 15200607/15200608 | ||
| 8-Nov-1996 | PHT32 | 35800611 | |||
| V1515 Cyg | 24-Apr-1996 | ON/OFF | 15900605/15900606 | ||
| 24-Apr-1996 | ON/OFF | 15900613/15900614 | |||
| Parsamian 21 | 28-Sep-1996 | PHT32 | 31601103 | ||
| V1735 Cyg | 21-Apr-1996 | ON/OFF | 15600909/15600910 | ||
| 20-May-1996 | ON/OFF | 18501409/18501410 | |||
| 3-Dec-1996 | PHT32 | 38301012 | |||
| V346 Nor | 9-Feb-1996 | ON/OFF | 08402303/08402304 | ||
| Z CMa | 5-Nov-1997 | ON/OFF | 72003006/72003005 | ||
| 5-Nov-1997 | 5x1 scan | 72003007 |
2.3 ISOPHOT data processing
Most observations were carried out as pairs of ON and OFF measurements separated by . The aperture was selected because it was comparable to the IRAS far-infrared beam size. The far-infrared flux of Z CMa was extracted from a scan obtained with the C100 camera. Three objects were measured at 65 and 100m in the high-resolution PHT32 mapping mode (see The ISO Handbook vol. V, Laureijs et al. 2001).
The data reduction was performed using the ISOPHOT Interactive Analysis Software Package V10.0 (PIA, Gabriel et al. 1997). After corrections for non-linearities of the integration ramps, the signals were transformed to a standard reset interval. Then an orbital dependent dark current was subtracted and cosmic ray hits were removed. In case the signal did not fully stabilise during the measurement time due to detector transients, only the last part of the data stream was used. This was found mainly in observations with the 4.8m and 12m filters, while at other wavelengths the measurements showed sufficient stability. The calibration of measurements at 4.8, 12, and 25m was performed by adopting the default responsivity. At longer wavelengths first we tried comparison with the on-board fine calibration source (FCS); however in most ON/OFF observations the quality of the FCS measurement was unacceptable and we returned to the default responsivity. As error estimate we adopted an absolute calibration uncertainty of 25%, which represents well the sum of the random and systematic uncertainties. Colour corrections were applied for each measurement by convolving the observed SED with the ISOPHOT filter profile in an iterative way.
Three objects (V1057 Cyg, V1735 Cyg, Parsamian 21) were measured at 65 and 100m in the PHT32 observing mode (oversampled map). Since this method is not scientifically validated we used our own procedure for evaluation. Instead of the highly interactive tool implemented in PIA (Tuffs & Gabriel 2003) we evaluated 23 observations of ISOPHOT standards (stars, asteroids, and planets) with default processing and derived an empirical correction curve from the comparison of the measured fluxes with their model predictions. The fluxes were extracted from the maps using an algorithm like the one developed for ISOPHOT mini-map observing mode (Moór et al. 2004). The typical uncertainty of the empirical correction does not exceed the adopted 25% error bars.
2.4 IRAS data
In order to have solid IRAS photometry for comparison with the ISOPHOT data we have re-analysed the IRAS raw data of two FU Orionis objects where the IRAS fluxes published by different authors (PSC, Weaver & Jones 1992, Kenyon & Hartmann 1991) were discrepant. We utilised the SCANPI processing tool at IPAC222http://irsa.ipac.caltech.edu/applications/Scanpi/. The results are listed in Tab. 4, remarks on individual objects are given below.
V1057 Cyg.
This source was at the very edge of the IRAS coverage and only few scans are available. At 1260m we adopted the fluxes published by Weaver & Jones (1992), though their formal uncertainties seem to be too optimistic. At 100m, where only two detectors crossed the star, the source is surrounded by structures which are equally strong or stronger than V1057 Cyg itself. The flux uncertainty is fully dominated by the accuracy of background determination. Experiencing with different background subtractions we estimate Jy for V1057 Cyg’s flux density at 100m.
V1515 Cyg.
In this case the background is even more structured than around V1057 Cyg, and the coarse spatial resolution of IRAS is a problem already at 12m. At 12 and 25m we estimate Jy and Jy, respectively, as integrated flux densities which also include an extended structure around the source, probably the infrared equivalent of the ring one can see in the optical wavelengths. The formal error bars reflect the uncertainty related to the background subtraction. At 60m the lack of spatial resolution is the limiting factor. The emission peak is offset by about 20′′ from the nominal position of V1515 Cyg, indicating that part of the emission from the region is unrelated to the star. For flux density towards the position of V1515 Cyg our estimate is Jy. At 100m the emission is dominated by a local peak at about 1′ from the position of V1515 Cyg, and only an upper limit of Jy can be derived for the FU Orionis object.
3 Results

The results of the ISOPHOT photometry as well as our newly derived IRAS flux densities are presented in Tab. 4. Figure 1 displays the SEDs of the sources from the two different epochs (1983 and 19962000). The results for V1057 Cyg, supplemented with optical data, are shown in Fig. 2.
By comparing the two SEDs of each source one can see the following evolutionary trends:
-
•
at near-IR wavelengths (m) the sources show various behaviour. Parsamian 21, V1331 Cyg and Z CMa are unchanged, V1057 Cyg, V1515 Cyg and V1735 Cyg have faded, V346 Nor has become slightly brighter.
-
•
in the mid-IR (m) only V1057 Cyg shows systematic flux change: it became fainter by a factor of 2 during the period (lower panel in Fig. 2).
-
•
at far-IR wavelengths (m) five stars (V1057 Cyg, V1735 Cyg, Z CMa, Par 21, and V1515 Cyg) remained constant while V346 Nor seems to have become fainter. For V1331 Cyg there are no FIR data other than IRAS.
Below we make remarks on the individual sources. The case of V1057 Cyg will be discussed in details in Sect. 4.

V1515 Cyg.
According to the 850m submillimetre map of Sandell & Weintraub (2001) this source is situated in the middle of a cold arcminute-size core, and this extended emission is also visible on the MSX 8.28m map. In addition the 2MASS and MSX data reveal a compact object 2MASS 20235198+4211260 at about from V1515 Cyg. Since this source is not included in the MSX Point Source Catalog, we extracted fluxes from the MSX maps using aperture photometry. The resulting SED peaks at m and its position on the JH vs. HK diagram suggests a reddened background star with mag. The contribution of this source in the ISOPHOT beam can explain why the ISOPHOT 4.8m point is higher than the M-band observation of 1983. In the 1225m range ISO fluxes are higher while the MSX fluxes are lower than IRAS. This result, however, can be explained by the presence of the arcminute core associated to V1515 Cyg, taking into account the different beam sizes of the three instruments (MSX: , IRAS: , ISOPHOT: ). At near-infrared wavelengths the data indicate a slight ( 15%) flux decrease, which is also visible in the K-band lightcurve (Fig. 3). In the mid-infrared the comparison of the 1983 and 199698 SEDs are complicated by the beam confusion. The fact, however, that at m Q-band measurements from 1974 (4.10.7 Jy, Cohen 1974) and 1989 (2.90.6 Jy, Kenyon et al. 1991) agree with the MSX flux value of 3.00.7 Jy, suggests that the mid-infrared fluxes of V1515 Cyg remained constant. At far-infrared wavelengths the emission of V1515 Cyg was constant within the measurement uncertainties.
V1735 Cyg.
The 850m submillimetre map of Sandell & Weintraub (2001) reveals a cold compact source, V1735 Cyg SM 1 at from the star dominating the emission at both 450 and 850m. From a careful analysis of the MSX images we concluded that in the whole near- and mid-infrared regime the submillimetre source is invisible and the observed emission can be assigned to V1735 Cyg. Thus, the star is responsible for the observed flux decrease of % below 5m, in accordance with the change in the K-band lightcurve (Fig. 3). No flux variation is visible at mid-infrared wavelengths. The relative contribution of the submm source, however, is probably increasing at longer wavelengths, as indicated by the fact that the IRAS position is located between the positions of the FU Orionis object and that of SM 1. Both the IRAS and ISOPHOT beams include both sources. Our result of no flux variation at far-infrared wavelengths indicates that the emission of V1735 Cyg was constant.
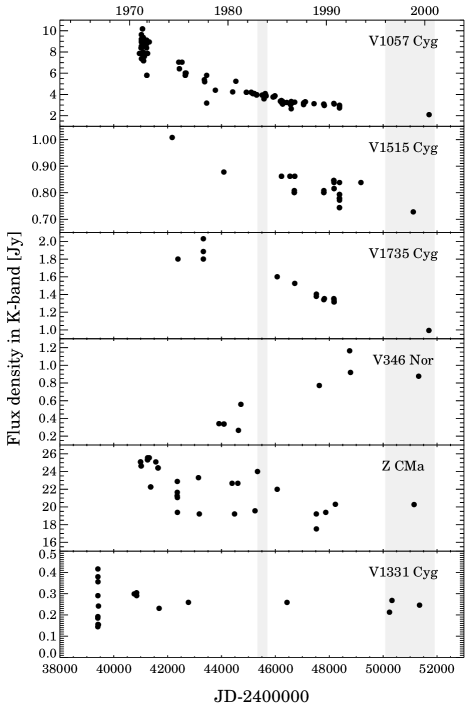
V346 Nor.
This star is situated in a complex region including the PMS star Reipurth 13, HH 56/57 and some cold extended emission within a radius of (Sandell & Weintraub, 2001). Applying a maximum entropy based deconvolution technique Prusti et al. (1993) were able to determine the relative contribution of Re 13 (separated by from the FU Orionis star) in the IRAS bands, and found that its flux is a factor of 3-5 times lower than the emission of V346 Nor. At near-infrared wavelengths the FU Orionis star – in a unique way in our sample – became brighter. This behaviour, reported already by Prusti et al. (1993), is also shown by the K-band lightcurve (Fig. 3). The brightening seems to be wavelength dependent: its amplitude increases monotonically from J to K. The same trend can still be observed at mid-infrared wavelengths up to 25m where the IRAS and ISOPHOT fluxes are the same. On the other hand at m the observed fluxes became lower between 1983 and 1996. Assuming that Re 13 (which is also included in the beam) is not variable we may conclude that V346 Nor faded at 60 and 100m. It is remarkable that the flux change is associated with a change in the far-infrared colour, too, which became warmer during the 15 years. The observed change could be an indication for a temperature rise in the outer parts of the circumstellar environment, but it might also be an artifact caused by the different sensitivities of the IRAS and ISOPHOT instruments for the extended emission.
Z CMa
is a binary system with a separation of 0.1′′. The component which dominates at infrared wavelengths is probably a Herbig Ae/Be star, while its optically brighter companion is an FU Orionis object. The system is embedded in an elongated disk-like submm core (Sandell & Weintraub 2001), and was unresolved for both IRAS and ISOPHOT. According to the K-band lightcurve (Fig. 3) Z CMa did not change after 1974. The same conclusion can be drawn for the whole 2100m SED. This result, however, does not exclude small flux variation of the FU Orionis component since the infrared SED of the system is dominated by the intermediate mass component.
Parsamian 21.
This source is relatively isolated, no extended emission is associated with it at submillimetre wavelengths (Henning et al. 1998), thus beam differences of the different instruments are unimportant. The comparison of the two SEDs does not reveal any long term flux variation between 1983 and 199698 within the measurement uncertainties.
V1331 Cyg
is believed to be in a state prior to an FU Orionis-type outburst (Welin 1976, McMuldroch et al. 1993). The source is compact at submillimetre wavelengths (Henning et al. 1998), thus the comparison of the various observations is not influenced by beam effects. Our data show no evidence of temporal variation of the source’s flux in the whole infrared regime. The K-band lightcurve (Fig. 3) is consistent with this conclusion.
| [m] | V1057 Cyg | V1515 Cyg | V1735 Cyg | V346 Nor | Z CMa | Parsamian 21 | V1331 Cyg |
|---|---|---|---|---|---|---|---|
| IRAS-12 | |||||||
| IRAS-25 | |||||||
| IRAS-60 | |||||||
| IRAS-100 |
4 Discussion: the case of V1057 Cyg
In this section we compare our new observational results on the temporal evolution of FU Orionis objects with predictions of models developed to describe their circumstellar structure. From our sample V1057 Cyg has the best documented multiwavelength flux evolution following its outburst in 1970. The ISO data points, supplemented with other infrared observations (Fig. 2), reveal a fast temporal evolution between 1983 and 19962000 (the fastest rate in the sample). The wavelength dependence of the evolution is also well determined. Since detailed models of V1057 Cyg are available in the literature, we chose this object to compare the new observational results on the temporal evolution with model predictions.
As far as we know there are two models of the circumstellar environment of V1057 Cyg to fit the complete 1100 m infrared SED (Kenyon & Hartmann 1991, Turner et al. 1997). Kenyon & Hartmann (1991) collected and analysed all data available until 1991 and modelled the post-outburst evolution in the framework of an accretion disk model. They concluded that a simple accretion disk model cannot explain the large far-IR fluxes, and investigated two possible geometries, a flared disk and an extended infalling envelope. Since the flared disk would require very high coverage factor, the authors favour a model where a flat disk is embedded in a spherically symmetric envelope with a wind-driven polar hole. The envelope, which is the remnant of the molecular cloud core, reprocesses the radiation from regions close to the central star. Turner et al. (1997) fitted the SED of V1057 Cyg by computing outbursting flared disk models in which the mass flux varies with radius. The model includes reprocessing of disk emission by other parts of the disk. An envelope with a central hole exposing the inner disk is included as a layer of uniform thickness on the top of the disk.
At optical and near-IR wavelengths (m) both models claim that emission of the central source (the star plus the innermost part of the accretion disk) dominates the observed flux. After the outburst the accretion rate close to the star decreases leading to a flux decrease in this wavelength range. Our data confirm that the flux decay was observable between 1983 and 2000, too. The data reveal that in the R, J, H, and K bands the flux dropped by the same constant factor of 2, while at B and V a larger decay was observed (lower panel of Fig. 2). This wavelength dependence may reflect the drop of effective temperature leading to a shift in the peak of the emission of the central source towards longer wavelengths.
Between 3 and 10m the origin of the emission is the release of accretion energy in the disk (Kenyon & Hartmann 1991), and also starlight reprocessed in the same part of the disk and in an envelope (Turner et al. 1997). Decreasing accretion rate at the center (which leads to a decrease in the bolometric luminosity) would cause the drop of emission of all three components. The timescale at which viscous accretion could change is related to the dynamical timescale at this distance (several years at 1 AU, Pringle 1981). The timescale on which the reprocessed emission follows the fading of the central source depends on the optical depth of the reprocessing medium. For optically thin medium (disk surface layer, envelope) an almost instantaneous reaction is expected (several hours, Chiang & Goldreich 1997, Eq. 25). For optically thick emission (disk interior) the thermal timescale related to the gas component dominates (several years at 1 AU for a typical T Tauri star, Chiang & Goldreich 1997, Eq. 28). In the case of V1057 Cyg the 310 m emission is probably not completely optically thick, as indicated by the presence of weak spectral features (silicate emission at 9.7m, Wooden et al. 1995, Hanner et al. 1998). Since our temporal baseline (19831998) significantly exceeds the mentioned timescales and since the post-outburst evolution started already in the seventies, the model prediction is that the 310 m emission is decreasing synchronised with the rate of the optical/near-IR decay in a wavelength independent way. Our measurements are fully consistent with these predictions. (Fig. 2 lower panel)
The emission at m is reprocessed starlight in both the model of Kenyon & Hartmann (1991) and of Turner et al. (1997). The infrared radiation emerges from an envelope where dust particles are in radiative equilibrium with the illumination from the central region (in the model of Turner et al. the envelope is optically thick for its own radiation at m). The temporal evolution implied by the models is similar to the predicted trend at shorter wavelengths: a wavelength independent fading at the same rate as the fading of the central illuminating source (although the time-lags are gradually longer at longer wavelengths, Chiang & Goldreich 1997). Our results are not fully consistent with this picture. Though at 10 m the flux dropped between 1983 and 1996 by a factor of 2 similarly to the optical/near-IR rate, at far-IR wavelengths (m) the flux of V1057 Cyg remained constant. The comparison of the IRAS 60 and 100m photometric points with our new ISOPHOT data at the same wavelengths clearly demonstrates that the far-infrared fluxes of V1057 Cyg showed no variation between 1983 and 1997. The transition between the two types of behaviour is around 25 m.
Our results indicate that – unlike in the above mentioned models – at m two important emission components have to be taken into consideration. Between 10 and 25 m we probably observe the envelope, while at longer wavelengths the emission cannot be explained this way. The material responsible for the m emission is apparently not an optically thin medium reprocessing the light of the central source, because its radiation does not react immediately on the source’s fading. Moreover, the emitting material has the following properties: (1) it is relatively cold; (2) it has a flat spectrum below 100 m, suggesting a radial temperature profile.
The first possibility for the nature of the far-infrared emitting component could be a reprocessing medium which is optically thick (e.g. a flared disk), and its time-lag behind the fading of the central source significantly exceeds our temporal baseline. Kenyon & Hartmann (1991), however, demonstrated that the outer part of a flared disk around V1057 Cyg would produce an unacceptably large covering factor and rejected this possibility. In addition, based on more detailed calculations, Bell et al. (1997) pointed out that such a flared structure would not be realised in nature. At a radius of 10 AU the flared disk would develop into a ’decreasing curvature’ disk, corresponding to the condensation of water ice, thus the outer disk is shadowed from the illumination of the central source. Such a disk cannot produce either the temperature profile or the high level of far-infrared emission. Based on these arguments we exclude reprocessing of the radiation of the central source in the outer part of the disk as the origin of the far-infrared emission.
Nevertheless, it may be interesting to mention that the critical radius where the disk turns to concave (i.e. the border line between the illuminated and shadowed parts of the disk) corresponds to a temperature of 300 K (Bell et al. 1997). Since the blackbody emission of this temperature contributes mainly to the 25 m range of the SED, one might speculate that the change in the temporal behaviour of the SED of V1057 Cyg, also at 25 m, could be related to the turnover of the disk profile. However, in the previous paragraphs we concluded that neither the short wavelength emission (m, attributed an envelope) nor the long wavelength part of the SED are dominated by the radiation of an optically thick passive disk. We think that the agreement of the transition wavelength in V1057 Cyg at 25 m with the peak of the blackbody curve at the sublimation temperature of water ice in the disk is a random coincidence. This conclusion is further supported by the case of V1735 Cyg, where the shortest wavelength of constant flux is at 10 m, clearly different from the temperature of the turnover radius (Fig. 1).
As a second possibility for the origin of the far-infrared emission Bell et al. (1997) proposed that the heating of the outer part of an optically thick disk could be dominated by the ambient radiation field of the cloud core around the young star, rather than by the radiation of the central source. As a result, the radial temperature profile becomes constant at the ambient temperature value, producing a shallower – or even approximately flat – far-infrared SED. Since its origin is unrelated to the central source, the far-infrared emission is not expected to vary in time.
A third possibility would be if the far-IR emission is powered by accretion in the outer disk (active disk), where the accretion rate is constant and unrelated to the outburst of the central region (Bell et al. 1995). However, the spectral shape of such a standard accretion disk would follow the canonical law, in contradiction with the observed flat spectrum (Fig. 2). A possible solution for this problem could be if the temperature profile of the accretion disk differs from the standard one. Lodato & Bertin (2001) suggested that in a self-gravitating protostellar disk the non-Keplerian rotation curve may result in a nonstandard temperature distribution, and thus in a flat spectrum in the far-IR. The high disk mass required by this model () is not inconsistent with measurements of some FU Orionis objects (Henning et al. 1998, Sandell & Weintraub 2001), but the measured disk mass of V1057 Cyg (, Sandell & Weintraub 2001) seems to be too low causing any observable effect.
The last possibility would be to assume that the origin of the far-IR emission is unrelated to V1057 Cyg. Such a source could be a – so far undetected – embedded IR companion. It is interesting to note that Bell et al. (1995) already speculated about such a companion which could have triggered the outburst of V1057 Cyg by a close passage. A deeply embedded infrared companion, like e.g. the very red object discovered in the vicinity of LkH 198 at 10m (Lagage et al. 1993), might be too faint to be detected at near-infrared wavelengths so far. At mid- and far-infrared wavelengths V1057 Cyg has never been imaged with high-resolution instruments, thus the existence of a companion unresolved in the beam of the MSX (18′′) cannot be excluded.
In the previous paragraphs we argued that an optically thick disk, reprocessing the radiation of the central source, or accretion with a non-Keplerian rotation curve are less likely explanations, but a shallower temperature profile dictated by the ambient radiation field or the possibility of an unrelated infrared companion cannot be excluded. The observations (Fig. 1) suggest that the constancy of far-infrared emission might be a general property of FU Orionis objects. Though a growing number of FU Orionis objects are found to be binaries (Reipurth & Aspin 2004), it is not proved yet that all FU Orionis objects have companions. Thus we think that the most likely origin of the far-infrared radiation in V1057 Cyg (and perhaps in other FU Orionis objects) is emission from the outer part of an optically thick disk whose temperature profile is controlled by the ambient radiation field.
Our investigation demonstrates that temporal variability of the infrared emission can provide important information on the physical properties of circumstellar material around FU Orionis objects. This kind of diagnostics of the disk structure – proposed first by Chiang & Goldreich (1997) – can also be applied on any other types of young stellar objects where the energy source of the disk, either accretion or reprocessing, is time-variable (e.g. exors). New infrared data on some FU Orionis objects are expected from the Spitzer Space Telescope which could show whether the evolutionary trends outlined by the ISO data also continue in our days, and whether the variation of the SEDs at longer wavelengths are responding to the flux drop at shorter wavelengths.
Acknowledgements.
The observations were reduced using the ISOPHOT Interactive Analysis package PIA, which is a joint development by the ESA Astrophysics Division and the ISOPHOT Consortium, lead by the Max-Planck-Institut für Astronomie (MPIA). This research has made use of the NASA/ IPAC Infrared Science Archive, which is operated by the Jet Propulsion Laboratory, California Institute of Technology, under contract with the National Aeronautics and Space Administration. This research has made use of the SIMBAD database, operated at CDS, Strasbourg, France. We received comments and suggestions from L. Szabados and D. Apai who carefully read the manuscript. We are grateful to an anonymous referee who called our attention to models of the temperature and opacity structure in the outer parts of protostellar disks. The work was partly supported by the grant OTKA T 037508 of the Hungarian Scientific Research Fund. P.Á. acknowledges the support of the Bolyai Fellowship.References
- (1) Aspin, C., Sandell, G. 2001, MNRAS 328, 751
- (2) Aspin, C., Reipurth, B. 2003, AJ 126, 2936
- (3) Bell, K.R., Lin, D.N.C., Hartmann, L.W., Kenyon, S.J. 1995, ApJ 444, 376
- (4) Bell, K.R., Cassen, P.M., Klahr, H.H., Henning, Th. 1997, ApJ 486, 372
- (5) del Burgo, C., Héraudeau, Ph., Ábrahám, P. 2003, ESA SP-511, p.339
- (6) Carr, J.S., Harvey, P.M., Lester, D.F. 1987, ApJ 321, L71
- (7) Chavarria-K. C. 1981, A&A 101, 105
- (8) Cohen, M. 1974, PASP 86, 813
- (9) Cutri, R. M., et al. 2003, Explanatory Supplement to the 2MASS All Sky Data Release (Pasadena: Caltech)
- (10) de Lara, E., Chavarria-K. C., Lopez-Molina, G. 1991, A&A 243, 139
- (11) Egan, M.P., Price, S.D. 1996, AJ 112, 2862
- (12) Eiroa, C., Hodapp, K.-W. 1990, A&A 236, 217
- (13) Eislöffel, J., Hessman, F. V., Mundt, R. 1990, A&A 232, 70
- (14) Elias, J.H. 1978, ApJ 223, 859
- (15) Gabriel, C., et al. 1997, in Proc. of the ADASS VI conference (Eds.: G. Hunt, H.E. Payne, ASP Conf.Ser. 125), 108
- (16) Graham, J.A., Frogel, J.A. 1985, ApJ 289, 331
- (17) Hanner, M.S., Brooke, T.Y., Tokunaga, A.T. 1998, ApJ 502, 871
- (18) Hartmann, L., Kenyon, S.J. 1996, ARA&A 34, 207
- (19) Hartmann, L., Kenyon, S.J., Hewett, R., Edwards, S., Strom, K.M., Strom, S.E., Stauffer, J.R. 1989, ApJ 338, 1001
- (20) Henning, Th., Burkert, A., Launhardt, R., Leinert, Ch., Stecklum, B. 1998, A&A 336, 565
- (21) Herbig, G.H. 1977, ApJ 217, 693
- (22) Herbst, W., Racine, R., Warner, J.W. 1978, ApJ 223, 471
- (23) Hodapp, K.W. 1995, IAU Circ. 6186, 2
- (24) Ibragimov, M.A., Shevchenko, V.S. 1988, Astrophysics (Tr. Astrofizika) 27, 337
- (25) Kenyon, S.J., Hartmann, L. 1991, ApJ 383, 664
- (26) Kenyon, S.J., Hartmann, L., Kolotilov, E.A. 1991, PASP 103, 1069
- (27) Kenyon, S.J., Hartmann, L., Gomez, M., Carr, J.S., Tokunaga, A. 1993, AJ 105, 1505
- (28) Kessler, M.F., Steinz, J.A., Anderegg, M.E. et al. 1996, A&A 315, L27
- (29) Kopatskaya, E.N. 1984, Astrofizika 20, 163 (English translation: 1984, Astrophysics 20, 138)
- (30) Lagage, P.O., Olofsson, G., Cabrit, S., Cesarsky, C.J., Nordh, L., Rodriguez Espinosa, J.M., 1993, ApJ 417, L79
- (31) Laureijs, R.J., Klaas, U., Richards, P.J., Schulz, B., Ábrahám, P. 2001, The ISO Handbook, vol. V, ESA SAI-99-069/Dc, Version 1.2
- (32) Lemke D., Klaas U., Abolins J. et al. 1996, A&A 315, L64
- (33) Lis, D.C., Menten, K.M., Zylka, R. 1999, ApJ 527, 856
- (34) Lodato, G., Bertin, G. 2001, A&A 375, 455
- (35) McMuldroch, S., Sargent, A.I., Blake, G.A. 1992, BAAS 24, 1215
- (36) McMuldroch, S., Sargent, A.I., Blake, G.A. 1993, AJ 106, 2477
- (37) Mitchell, G.F., Johnstone, D., Moriarty-Schieven, G., Fich, M., Tothill, N.F.H. 2001, ApJ 556, 215
- (38) Moór, A., Ábrahám, P., Csizmadia, Sz., Kiss, Cs., Klaas, U. 2004, in preparation
- (39) Prusti, T., Bontekoe, Tj.R., Chiar, J.E., Kester, D.J.M., Whittet, D.C.B. 1993, A&A 279, 163
- (40) Reipurth, B., Aspin, C. 1997, AJ 114, 2700
- (41) Reipurth, B., Aspin, C. 2004, ApJ 608, L65
- (42) Sandell, G., Aspin, C. 1998, A&A 333, 1016
- (43) Sandell, G., Weintraub, D.A. 2001, ApJS 134, 115
- (44) Staude H.J., Neckel, Th. 1991, A&A 244, L13
- (45) Staude H.J., Neckel, Th. 1992, ApJ 400, 556
- (46) Strom, K.M., Strom, S.E. 1993, ApJ 412, L63
- (47) Tuffs, R., Gabriel, C. 2003, A&A 410,1075
- (48) Turner, N.J.J., Bodenheimer, P., Bell, K.R. 1997, ApJ 480, 754
- (49) Weaver, W.B., Jones, G. 1992, ApJS 78, 239
- (50) Welin, G. 1976, A&A 49, 145
- (51) Wesselius, P.R., de Jonge, A.R.W., Kester, D.J.M., Roelfsema, P.R. 1992, in ’Infrared Astronomy with ISO’ (Eds. Th. Encrenaz, M.F. Kessler), Nova Science Publishers, p. 509
- (52) Wooden, D.H., Bell, K.R., Butner, H.M., Goguen, J.D. 1995, BAAS 27, 1320
- (53) Yun, J. L., Moreira, M. C., Alves, J. F., Storm, J. 1997, A&A 320, 167