Giant pulses in Pulsar PSR B0031–07
We report on observations of the recently detected (Kuzmin et al. kuzmin04 (2004)) giant pulses (GPs) from the pulsar PSR B0031–07 at 40 and 111 MHz. At 40 MHz the peak flux density of the strongest pulse is 1 100 Jy, which is 400 times as high as the peak flux density of the average pulse (AP). A pulse whose observed peak flux exceeded the peak of the AP by more than a factor of 200 is encountered approximately once in 800 observed periods. Peak flux density of the GPs compared to the AP peak flux density has roughly a power-law distribution with a slope of . GPs at 40 MHz are essentially stronger than those ones at 111 MHz. This excess is approximately in inverse proportion to the frequency ratio. The giant pulses are much narrower than the AP, and cluster in two narrow regions of the AP near the peaks of the two components of the AP. Some of the GPs emit at both phases and are double. The separation of the double GP emission regions depends on frequency. Similarly to the frequency dependence of the width of the AP, it is less at 111 MHz than at 40 MHz. This suggests that GPs are emitted from the same region of the magnetosphere as the AP, that is in a hollow cone over the polar cap instead of the light cylinder region. PSR B0031–07 as well as the previously detected PSR B1112+50 are the first pulsars with GPs that do not have a high magnetic field at the light cylinder. One may suggest that there are two classes of GPs, one associated with high-energy emission from outer gaps, the other associated with polar radio emission. The GPs of PSR B0031–07 and PSR B1112+50 are of the second class. The dispersion measure is found to be .
Key Words.:
stars: neutron – pulsars: general – pulsars: individual PSR B0031–071 Introduction
Giant pulses (GPs) are short-duration burst-like sudden increases of intensity of individual radio pulses from pulsars. This rare phenomenon has been detected previously only in five pulsars out of more than 1 500 known ones:: the Crab pulsar PSR B0531+21 (Staelin & Sutton staelin (1970)), PSR B1112+50 (Ershov & Kuzmin ershov (2003)), the millisecond pulsars PSR B1937+21 (Wolszczan et al. wolszczan (1984)) and PSR B1821–24 (Romani & Johnston romani (2001)), and the extragalactic pulsar PSR B0540–69 (Johnston & Romani johnston (2003)).
The intensities of the GPs are extremely high. The brightness temperature of GPs of the millisecond pulsar PSR B1937+21 is as high as K (Kuzmin & Losovsky kuzmin02 (2002)), and K for GPs of the Crab pulsar (Kostyuk et al. kostyuk (2003), Hankins et al. hankins (2003)).
Four of these pulsars belong to the group of pulsars with the strongest magnetic field at the light cylinder. Pulsar PSR B1112+50 is the first exception from this group, being a pulsar that exhibits the characteristic features of GPs but has an ordinary value of the magnetic field on the light cylinder. Kuzmin et al.(kuzmin04 (2004)) recently reported the detection of giant pulses from another ordinary magnetic field pulsar, PSR B0031–07. They find that at 111 MHz the peak flux density of the strongest GP is 530 Jy, which is 120 times as high as than the peak flux density of the average profile (AP). A pulse whose observed peak fluxes exceed the peak of the AP by more than a factor of 50 is encountered approximately once in 250 observed periods. Giant pulses cluster in a narrow region near the peak of the first component of the AP.
In this paper we report observations of GPs of pulsar PSR B0031–07 at the second frequency of 40 MHz, additional observations at 111 MHz and a comparative analysis of the two-frequency data.
2 Observations and data reduction
Observations were carried out at two frequencies, 40 and 111 MHz.
At 40 MHz observations were performed from August 28 through October 13, 2003 with the DKR Radio Telescope at Pushchino Radio Astronomy Observatory of the Lebedev Physical Institute. The DKR telescope has an effective area of about 8 000 square meters. One linear polarization was received. We used a 128-channel receiver with channel bandwidth 1.25 kHz. The frequency of the first (highest frequency) channel was 40.982 MHz, the sampling interval was 0.819 ms, and the time constant was ms. The duration of each observation was about 16 min (994 pulsar periods). A total of 16 observations containing 15 904 pulsar periods was carried out.
From June 21 through September 22, 2003 we performed an additional 16 observations at 111 MHz and 12 simultaneous observations at 111 and 40 MHz. At 111 MHz we used the Large Phased Array (BSA) Radio Telescope at Pushchino Radio Astronomy Observatory with an effective area of about 20 000 square meters. One linear polarization was received. At both frequencies we used two 64-channel receivers with channel bandwidth 20 kHz. The sampling interval was 2.560 ms and the time constant was ms. The durations of the observations were about 3 min (205 pulsar periods) and 9 min (600 pulsar periods) at 111 and 40 MHz respectively.
All observations were time-referenced to the Observatory rubidium master clock, which in turn was monitored against the National Time standard via TV timing signals. Pulsar ephemerides were obtained from the catalogue by Taylor et al. (taylor (1995)).
During the off-line data reduction the signal records were cleaned of radio interferences. Subsequently the inter-channel dispersion delays imposed by an interstellar medium were removed. Each observing period was analyzed for pulses with amplitude exceeding a preset level and its amplitude, pulse width and phase were derived.
3 Results
At 40 MHz the 212 pulses whose observed peak fluxes density exceeded the peak flux density of the average profile (AP) (which is equivalent to the average pulse) by more than a factor of 100 were selected and analyzed. 19 of them exceeded the peak of the AP by more than a factor of 200. A pulse whose observed peak fluxes exceeded the peak of the AP by more than a factor of 100 is encountered approximately once in 75 observed periods.
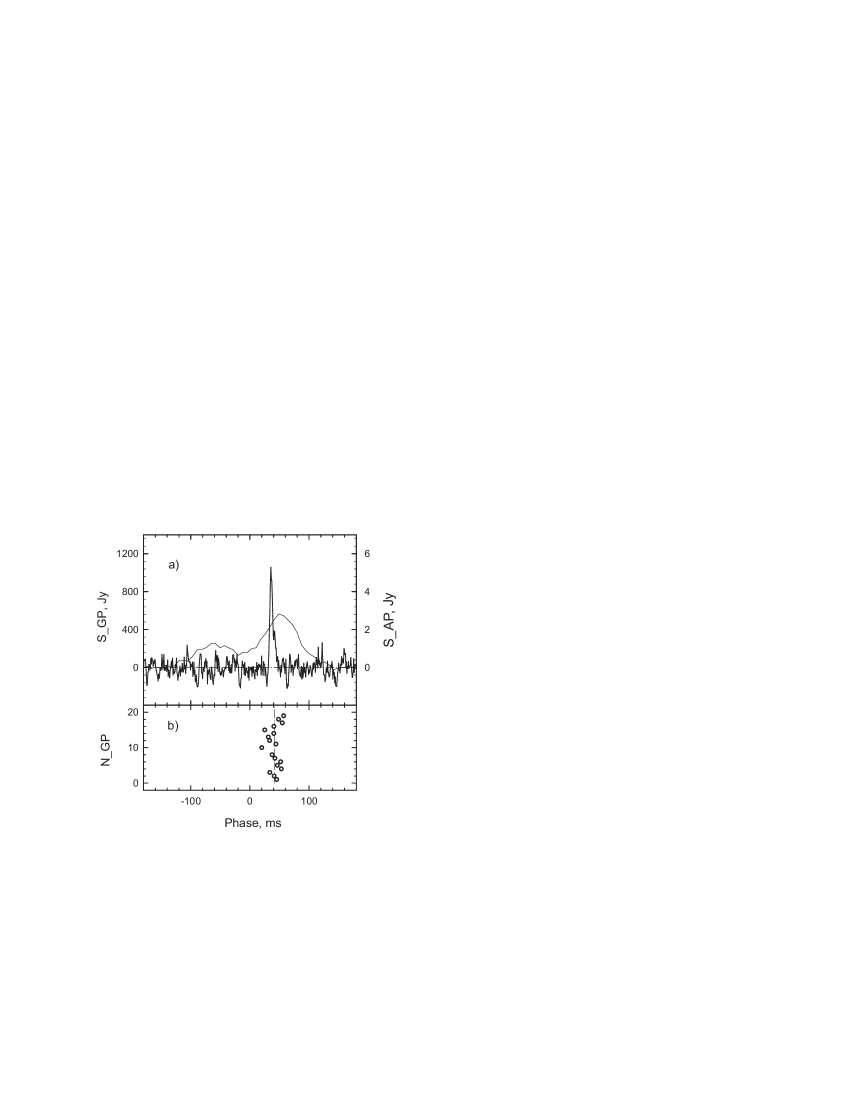
Figure 1a shows the strongest observed GP (bold line) together with the AP for all 16 days of observations. The observed peak flux density of this GP exceeds the peak flux density of the AP by factor of 400. The plot of the AP is presented on a 200 times larger scale and flux densities of the observed GP and AP are shown separately on the left and right sides of the ”y” scales.
The value of the GP flux density was determined relative to the known AP flux density as
where is the ratio of the GP to AP peak intensity and is the peak flux density of AP
where is the flux density averaged over a pulsar period, is the duty cycle of the pulsar.
The value of the AP flux density mJy was obtained from Izvekova et al. (izvekova81 (1981)). The reduction factor is so the AP peak flux density is 2.7 Jy. The strongest observed GP has . Then, the observed GP peak flux density is Jy. The intrinsic fine structure of the pulses is masked by interstellar scattering. In our measurements of the 19 strongest GPs at 40.9 MHz we derived ms. Scattering increases the pulse width and decreases the pulse amplitude. Thus the intrinsic GP peak flux density is Jy.
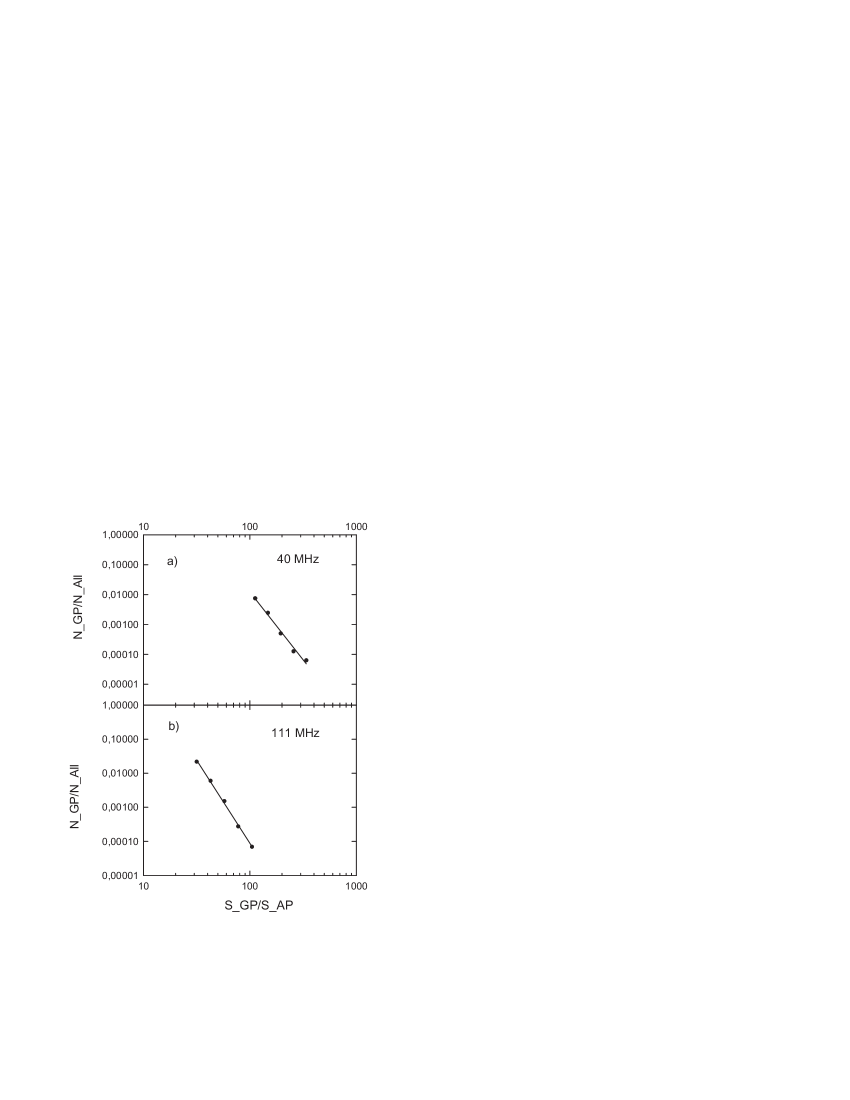
In Fig. 2a we show the cumulative distribution of the ratio of the observed GP peak flux density to the AP peak flux density of all pulses that we have selected and analyzed. In a detectable interval of from 100 to 400, the histogram has roughly a power-law distribution with a slope of . Since for the pulse signal-to-noise ratio is less than 5, at lower intensities the observed distribution is masked by noise.
The distribution for 111 MHz, which we have obtained from the Kuzmin et al. (kuzmin04 (2004)) data and additional observations, is shown in Fig. 2b. In a detectable interval of from 30 to 100, the histogram has roughly a power-law distribution with a slope of . Since for the pulse signal-to-noise ratio is less than 5, at lower intensities the observed distribution is masked by noise.
The distributions in Fig. 2 demonstrate, that GPs at 40 MHz are essentially stronger than those at 111 MHz. At 40 MHz one in every thousand pulses exceeds the AP by more than a factor of 170, but at 111 MHz only by 60. The strongest observed GP at 40 MHz exceeds the peak flux density of the AP by a factor of 400, but at 111 MHz only by a factor of 120. In a quantitative sense this gain is approximately in inverse proportion to the ratio of frequencies.
From Fig. 2 one can see that the rate of GPs depends on the frequency. At 40 MHz a pulse whose observed peak flux exceeds the peak of AP by more than a factor 100 is encountered once in 85 observed periods, but at 111 MHz only once in 11 000. This may be a reason why there are no claims of GPs from this pulsar at higher frequencies.
Our distributions cover a smaller number of observed pulsar periods (by two orders of magnitude) compared to such histograms for previously known short period pulsars. Therefore, we consider the slope index as a tentative one which needs to be refined.
The mean observed width111The width is not corrected for scatter and dispersion broadening of 19 GPs with is ms. The width of the AP222The width of the AP was measured at half the maximum height of the leading and trailing components. for all 12 days of observations is ms. Thus, at 40 MHz GPs are narrower than the AP by about a factor of 30.
The positions of the GPs are stable within the AP and they cluster in a narrow window near the maximum of the second component of the AP. Figure 1b shows the phases of the GPs which exceeded the AP by factor of 100. The average phase difference between the GPs and the center of the AP is ms. GPs cluster in a narrow phase window ms. The clustering is tighter for stronger GPs.
The GPs are not identified with subpulses, since contrary to the stable phase position of GPs, the phase position of subpulses drift across the AP. GPs are also narrower than the subpulses of this pulsar ms at 60 and 102 MHz (Izvekova et al. izvekova93 (1993)).
The GP brightness temperature is
Here is the radio wavelength, is the Boltzmann constant, and is the solid angle of the radio emission region. Adopting , where is the size of the radio emission region and the distance to the pulsar, and further adopting , where is the speed of light and the distance to the pulsar kpc (Taylor et al. taylor (1995)), we obtain K.
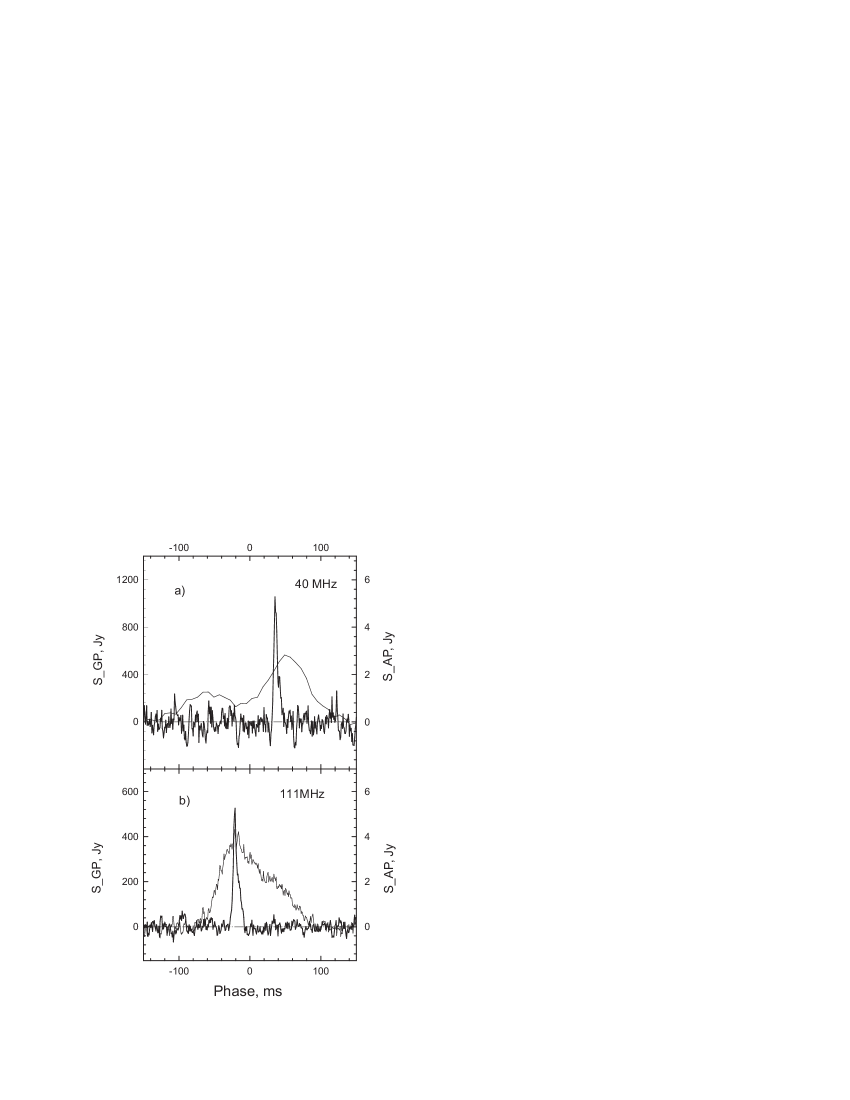
The most unexpected and interesting feature of our observations at 40 MHz is the non-coincidence of the phase positions of the GPs at 40 and 111 MHz. In Fig. 3 we present the time-alignment of GPs and APs at 40 and 111 MHz (Kuzmin et al. kuzmin04 (2004)). One can see that the GP at 40 MHz is separated from the GP at 111 MHz by about 60 ms and that they are located in two different parts of the AP. At 111 MHz the GP is located near the maximum of the first component of the AP, whereas at 40 MHz the GP is located near the maximum of the second component.
To verify this peculiarity, we have performed a control determination of the dispersion measure . For this we varied the value of by a process of removal of the inter-channel dispersion delays and searched their optimal value, which provides the maximum amplitude of individual pulses. We processed 440 individual pulses at 111 MHz and 337 at 40 MHz. The mean value of dispersion measure was obtained to be . This value is consistent with the catalog value (Taylor et al. taylor (1995)) and confirms the validity of the non-coincidence of the phase positions of the GPs at 40 and 111 MHz.
One may suggest two explanations of such behavior. The first is that the emission region of GPs moves with frequency. The second proposes that there are two separate phase emission regions for the GPs. In this case, one may expect that some of the GPs will emit at both phases and are double.
To clarify this point, we undertook a more detailed inspection of the GPs. Our first-line reduction program searched only for a single GP per pulsar period, whose amplitude exceeded a preset level. However, one may expect that, in the case of two emission regions, some GPs have two components, where the first component is observed mainly at 111 MHz and the second at 40 MHz. Therefore we performed an addition search of the observed GPs for two-component structure. For this search we used a 20 kHz channel bandwidth at both frequencies. The answer is yes: — some GPs, both at 40 and 111 MHz, have a two-component structure. We detected 12 double GPs whose amplitude exceeded the AP by a factor of 50 at 111 MHz and 5 double GPs with amplitude exceeding AP by a factor of 20 at 40 MHz.
An example of two-component GPs is shown in Fig. 4. Since at 40 MHz double pulses were searched in a 20 kHz channel bandwidth, the dispersion pulse broadening of 30 ms reduces the strength of the GP and distorts the observed pulse shape compared to other GPs, which were observed in 1.25 kHz channel bandwidth.
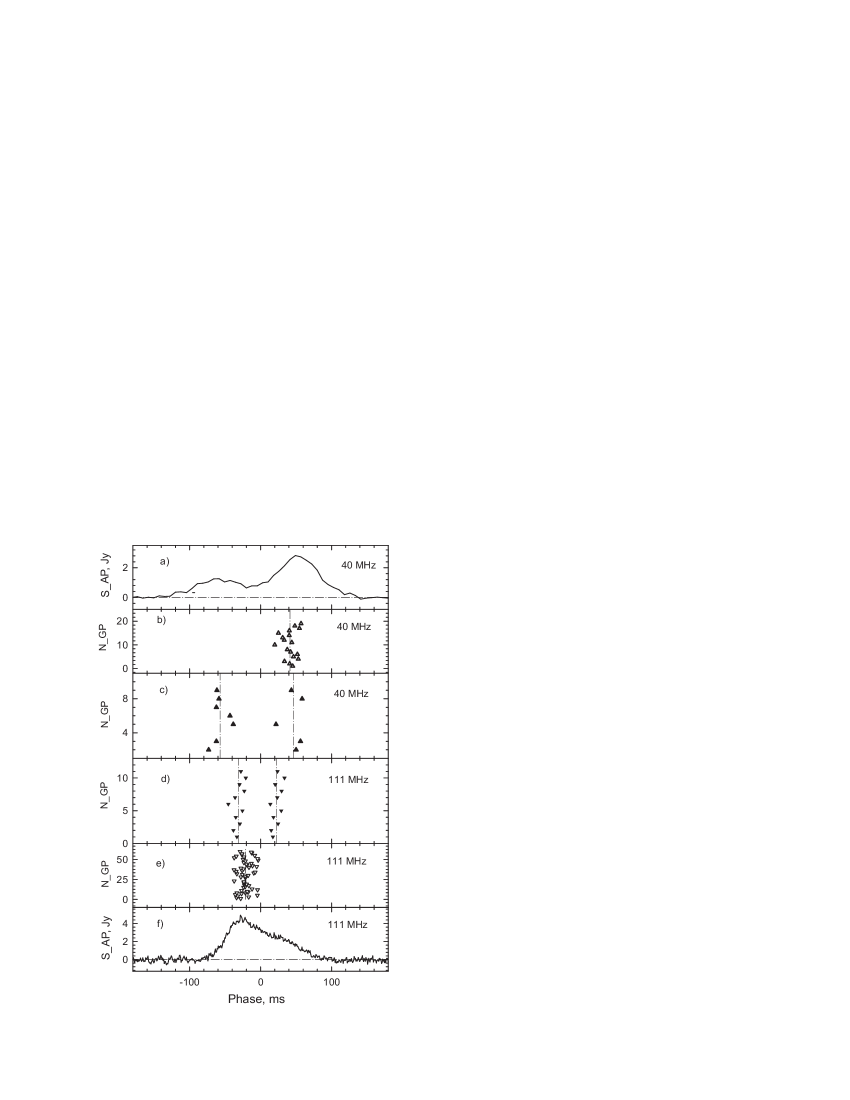
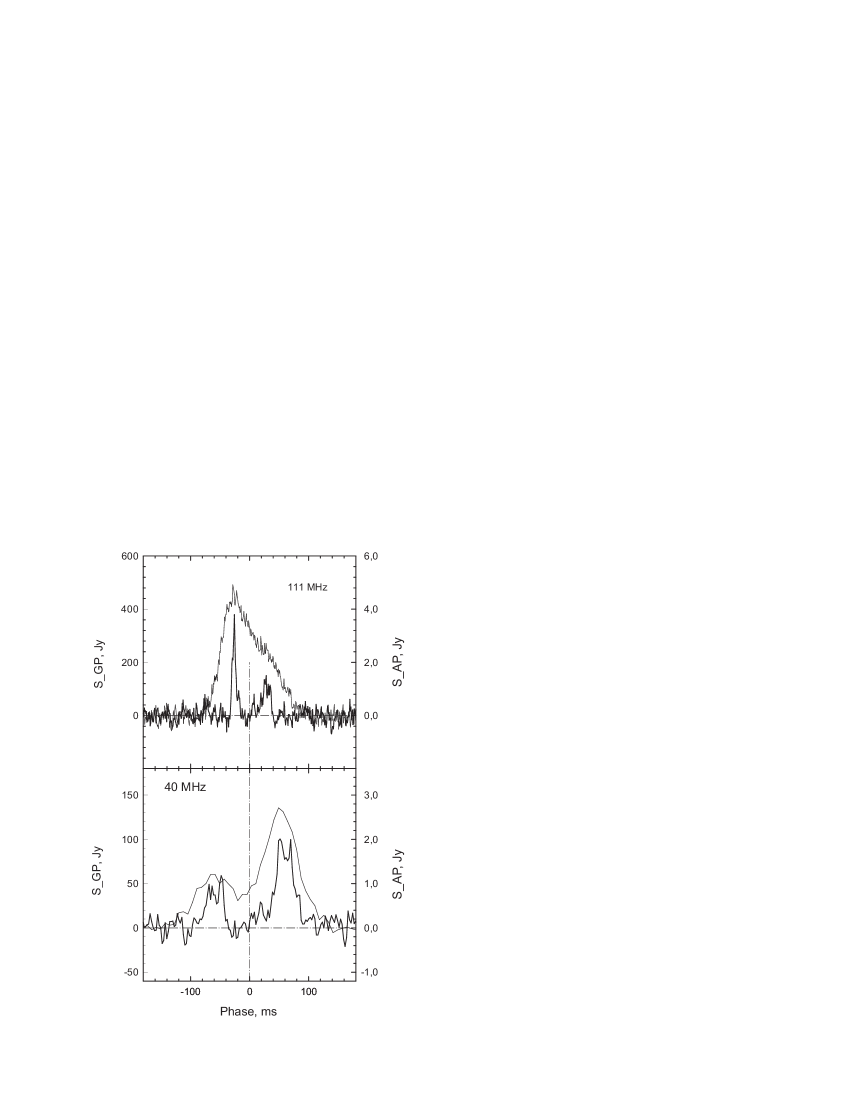
The phases of these double GPs, as well as single GPs from our observations and the Kuzmin et al. (kuzmin04 (2004)) data are plotted in Fig. 5 together with APs.
One can see that the phases of the trailing component of double GPs at 40 MHz (Fig. 5c) fit the phases of the single GPs at this frequency (Fig. 5b). In a similar manner, the phases of the leading component of double GPs at 111 MHz (Fig. 5d) fit the phases of the single GPs at 111 MHz (Fig. 5e). This supports the concept of two emission regions of GPs. The first dominates at 111 MHz, the second dominates at 40 MHz and both form double GPs.
Twelve observation sessions, containing 2 460 pulsar periods, were performed simultaneously at 40 and 111 MHz. We also used the 20 kHz channel bandwidth at both frequencies. Forty pulses at 40 MHz and 45 pulses at 111 MHz with peak intensities exceeding the peak intensity of the AP by more than a factor of 20 were selected and analyzed. Only two among these pulses were found in the same pulse phase inside the same pulsar period and identified as simultaneous. The probability that there are accidental coincidences of GPs simultaneously at two frequencies is equal to ; this is significantly lower than the observed detection rate of simultaneous GPs of .
The measured spectral indices between frequencies of 40 and 111 MHz for these 2 simultaneous GPs are and , corresponding to the low-frequency turn-over region of this pulsar (the spectral index of the AP is ). However, only a small number of simultaneous GPs was observed. This possibility therefore needs further study.
4 Discussion
The GPs that we detected from PSR B0031–07 exhibit all characteristic features of the classical GPs from PSR B0531+21 and PSR B1937+21.
The peak intensities of the GPs exceed the peak intensity of the AP by more than a factor of 400. The histograms of the flux density have a power-law distribution. The GPs are much narrower than the AP and their phases are stable inside the integrated profile.
Alongside these similarities, the GPs of the pulsar PSR B0031–07 have noticeable differences. Previously known pulsars with GPs belong to the group of pulsars with very high magnetic field on the light cylinder. Pulsar PSR B0031–07, as well as the previously detected PSR B1112+50 (Ershov & Kuzmin ershov (2003)), are the first ones with ordinary magnetic fields on the light cylinder.
The most unexpected and interesting result is the clustering of the GPs in two different regions. This indicates that there are two emission regions of GPs. The separation of these regions at 40 MHz is larger than at 111 MHz; this is corresponds to the increase in the width of the AP, which is interpreted as a divergence of the magnetic field lines in the hollow cone model of pulsar radio emission. This suggests that the GPs from this pulsar, and possibly from PSR B1112+50, originate in the same region as the AP, that is in a hollow cone over the polar cap instead of in the light cylinder region.
One may suggest that there are two classes of GPs, one associated with high-energy emission from the outer gaps, the other associated with polar radio emission. The GPs of PSR B0031–07 and PSR B1112+50 are of the second class.
5 Conclusions
The detection of giant pulses from pulsar PSR B0031–07 has been confirmed. The peak flux density of the strongest pulse is 1 100 Jy, which is 400 times as high as than the peak flux density of the average profile.
The GPs are much narrower than the average profile and cluster in two narrow regions of the average profile. The separation of the two GP emission regions decreases with frequency. This suggests that the GPs from this pulsar are emitted from the same region as the AP, that is in the hollow polar cone instead of in the light cylinder region.
Pulsar PSR B0031–07, as well as the previously detected PSR B1112+50, are the first pulsars with GPs that do not have a high magnetic field at the light cylinder, such as previously known pulsars with GPs have. They may be a separate class of GPs.
The dispersion measure is found to be 10.900 0.003 .
Acknowledgements.
We wish to thank V. V. Ivanova, K. A. Lapaev & A. S. Aleksandrov for assistance during observations. We are grateful to Francis Graham Smith for improving the English and valuable comments. We are grateful to the anonymous referee for comments which enhanced the paper. This work was supported in part by the Russian Foundation for Basic Research (project No 01-02-16326) and the Program of the Presidium of the Russian Academy of Sciences ”Non-steady-state Processes in Astronomy.”References
- (1) Ershov, A. A. & Kuzmin, A. D. 2003, Pis’ma v AZh, 29, 111 (Astr. Lett., 29, 91)
- (2) Hankins, T. H., Kern, J. S., Weatherall, J. C., & Eilek, J. A. 2003, Nature, 422, 141
- (3) Izvekova, V. A., Kuzmin, A. D., Malofeev, V. M., & Shitov, Yu. P. 1981, Ap&SS, 78, 45
- (4) Izvekova, V. A., Kuzmin, A. D., Lyne, A. G., et al. 1993, MNRAS, 261, 865
- (5) Johnston, S., & Romani, R. W. 2003, ApJ, 590, L95
- (6) Kostyuk, S. V., Kondratiev, V. I., Kuzmin, A. D., Popov, M. V., & Soglasnov, V. A. 2003, Pis’ma v AZh, 29, 440 (Astr. Lett., 29, 387)
- (7) Kuzmin, A. D., & Losovsky, B. Ya. 2002, Pis’ma v AZh, 28, 25 (Astr. Lett., 28, 21)
- (8) Kuzmin, A. D., Ershov, A. A., & Losovsky, B. Ya. 2004, Pis’ma v AZh, 30, 285 (Astr. Lett., 30, 247)
- (9) Romani, R. W., & Johnston, S. 2001, ApJ, 557, L97
- (10) Staelin, D. H., & Sutton, J. M. 1970, Nature, 226, 69
- (11) Taylor, J. H., Manchester, R. N., Lyne, A. G., et al. 1995, Catalog of 706 Pulsars, unpublished work
- (12) Wolszczan, A., Cordes, J. M., & Stinebring, D. R. 1984, in Millisecond Pulsars, ed. S. P. Reynolds & D. R. Stinebring (NRAO, Green Bank), p.63