Multiwavelength Observations of Radio Galaxy 3C 120 with XMM-Newton
Abstract
We present XMM-Newton observations of the radio galaxy 3C 120, which we use to study the nature and geometry of the X-ray and UV-emitting regions. Contemporaneous radio, mm-wave, and optical data provide additional constraints on the spectral energy distribution and physical state of the active galactic nucleus. The hard X-ray spectrum contains a marginally resolved Fe i K emission line with FWHM km s-1 and an equivalent width of eV. The line arises via fluorescence in a broad-line region with covering fraction of 0.4. There is no evidence of relativistically broad Fe K, contrary to some previous reports. The normal equivalent widths of the X-ray and optical emission lines exclude a strongly beamed synchrotron component to the hard X-ray and optical continua. There is an excess of 0.3-2 keV soft X-ray continuum over an extrapolation of the hard X-ray power-law, which may arise in a disk corona. Analysis of an archival Chandra image shows that extended emission from the jet and other sources contributes of the total X-ray flux. A break in the X-ray spectrum below 0.6 keV indicates an excess neutral hydrogen column density of cm-2. However, the neutral absorber must have an oxygen abundance of of the solar value to explain the absence of an intrinsic or intervening O i edge. There is no ionized absorption in the soft X-ray spectrum, but there is a weak, narrow O viii Ly emission line. We do not detect previously claimed O viii absorption from the intervening intergalactic medium. Radio observations at 37 GHz show a fast, high frequency flare starting 7 days after the XMM-Newton observation. However, this has no obvious effect on the X-ray spectrum. The X-ray spectrum, including the soft excess, became harder as the X-ray flux decreased, with an estimated pivot energy of keV. The UV and soft X-ray fluxes are strongly correlated over the 120 ks duration of the XMM-Newton observation. This is qualitatively consistent with Comptonization of UV photons by a hot corona.
1 Introduction
3C 120 (z=0.033) is one of the brightest nearby radio galaxies, classified as a broad-line radio galaxy (BLRG). It belongs to the Fanaroff-Riley (FR) I class of radio galaxies, which generally have lower-power radio jets than FR II sources. The strong broad emission lines are unusual for an FR I radio galaxy. 3C 120 has a one-sided superluminal jet (Seielstad et al., 1979) with complex, possibly helical structure (Gomez et al., 2000; Homan et al., 2001; Walker et al., 2001). Components are ejected with apparent motions of 4-6c, indicating a Doppler factor of and and a line-of-sight from the jet axis. 3C 120 is one of the first sources discovered to have X-ray synchrotron emission coincident with the extended radio jet (Harris et al., 1999). The host galaxy is a spiral (Sargent, 1967), which is unusual for a BLRG. The reverberation mass of the central black hole is (Wandel et al., 1999; Peterson et al., 1998).
BLRGs appear to have weaker Compton reflection and weaker Fe K emission in their hard X-ray spectra than radio-quiet Seyfert galaxies (Wozniak et al., 1998; Grandi et al., 1999; Eracleous, Sambruna, & Mushotzky, 2000). The reflection fraction in 3C 120 is , measured with Rossi X-ray Timing Explorer (RXTE) and Beppo-SAX (Eracleous, Sambruna, & Mushotzky, 2000; Zdziarski & Grandi, 2001). Possible reasons for a small reflection fraction include 1) dilution by X-ray emission from a beamed jet, 2) intrinsic differences between accretion disk or torus structure in radio-loud and radio-quiet active galactic nuclei (Eracleous, Sambruna, & Mushotzky, 2000), and 3) ionization of the disk surface (Ballantyne, Ross, & Fabian, 2002).
The profile of the Fe K line can be used to probe the structure of the inner accretion disk in some active galactic nuclei (AGN). The spectra of the radio-quiet narrow-line Seyfert 1 Galaxies MCG-6-30-15, Mrk 766, and NGC 4051 contain relativistically broadened Fe K (Tanaka et al., 1995; Wilms et al., 2001; Page et al., 2001; Salvi, 2003). Similarly broadened K-shell lines of C, N, and O have been reported in the soft X-ray spectra of these Seyferts (Branduardi-Raymont et al., 2001; Mason et al., 2003; Ogle et al., 2004). A number of other broad-line Seyfert 1s observed with ASCA may also have relativistically broadened Fe K lines in their spectra (Nandra et al., 1997). An important question to resolve is whether any radio-loud AGN have relativistically broadened lines. If so, this could be used to compare their accretion disk structure to radio quiet AGN.
3C 120 was observed with ASCA in 1994 (Grandi et al., 1997). A broad Fe K line was found and fit by a Gaussian with keV and equivalent width (EW) of eV. The same data were fit by Reynolds (1997) and Sambruna et al. (1999), also yielding a broad line with very large equivalent width. The large velocity width is suggestive of Doppler broadening in the inner regions of an accretion disk. However, the line parameters are sensitive to the underlying continuum shape and amount of Compton reflection. The line width and strength decrease dramatically if the model continuum reflection fraction is increased (Grandi et al., 1997) or if the continuum is fit with a broken power law (Wozniak et al., 1998).
Observations of the X-ray continuum show that the spectral hardness is anti-correlated with the X-ray flux. (Halpern, 1985). Sometimes the X-ray continuum pivots at an energy of keV, while at other times the pivot energy must be at keV (Maraschi et al., 1991). Coordinated multi-wavelength observations hint that the hard X-ray slope steepens with increased UV continuum flux, consistent with Comptonization of disk emission by thermal electrons (Maraschi et al., 1991). Compton Gamma Ray Observatory OSSE observations indicate a spectral cutoff or break at 100-200 keV, consistent with a very hot corona (Wozniak et al., 1998).
A soft X-ray excess is found in ROSAT and Beppo-SAX spectra (Grandi et al., 1997; Zdziarski & Grandi, 2001), and can be fit by either a broken power law or optically thin thermal emission. Soft excess emission has been observed in other BLRGs (Wozniak et al., 1998) and Seyfert 1 galaxies, and its nature is currently under debate. In most cases, where not resolved into emission lines, it is attributed to the Comptonized tail of thermal emission from an accretion disk. For 3C 120, Zdziarski & Grandi (2001) suggest that the soft excess consists of emission lines from a collisionally ionized plasma in an extended halo surrounding the host galaxy. This might explain a break in the spectrum below 1 keV. Alternatively, there may be excess neutral absorption over the nominal Galactic amount (Grandi et al., 1997).
3C 120 was the target of an extended Very Long Baseline Interferometry (VLBI) and RXTE monitoring campaign from 1997-2000 (Marscher et al., 2002). Ejection of VLBI jet components was preceded by dips in the 2.4-20 keV X-ray flux and hardening of the spectral index. The mean separation between each dip and jet ejection event was 0.1 yr, with a low probability of a random association. These dips may result from changes in the inner accretion flow and corona geometry associated with ejection of radio jet components. A similar phenomenon is seen in micro-quasar GRS 1915+105 (Mirabel & Rodriguez, 1994), where IR-radio flares are preceded by hard X-ray dips (Eikenberry et al., 1998; Mirabel & Rodriguez, 1998). The exact cause of X-ray dips is unknown, but they must be closely connected to both jet component ejection and the state of the X-ray emitting region.
We use the XMM-Newton European Photon Imaging Camera (EPIC) and the Reflection Grating Spectrometers (RGS) to measure the X-ray continuum and Fe K emission line properties of 3C 120. These observations are supported by simultaneous UV photometry with the Optical Monitor (OM) and contemporaneous observations of radio variability and the optical emission line spectrum. Archival Hubble optical and Chandra X-ray images are used to constrain possible extended emission components in the spectrum. After presenting the observations, we discuss their implications for the structure of the X-ray and UV emission regions.
2 Observations
We observed 3C 120 for nearly a full orbit (130 ks) with XMM-Newton on 26-27 August 2003 (2003.65), starting at MJD 52877.233333. The X-ray background was low except for a 10 ks background flare at the end of the observation. We exclude this period of high background from our analysis. The Medium optical blocking filter was used to avoid optical contamination of the EPIC spectra. The EPIC pn and MOS2 (Metal-Oxide-Silicon) detector observations were taken in Small Window mode to minimize pileup effects. MOS1 observations were taken in timing mode, and we disregard them because of calibration difficulties.
All XMM-Newton data were reduced using the Science Analysis System (SAS) 5.4.1 and event files were reprocessed with the tools epchain, emchain, and rgsproc. The first- and second-order RGS1 and RGS2 spectra were added together. The RGS response matrices were combined and corrected for small errors in the effective area calibration, using Mrk 421 as a standard featureless source.
We include single and double pixel events in our EPIC analysis. Spectra were extracted from a circular aperture centered on the X-ray peak in both the pn and MOS2 images. Backgrounds were estimated using regions on the detector away from the source. The net count rates were 20.4 and 6.1 ph s-1, respectively, indicating insignificant pileup in pn, and moderate pileup in MOS2. We used the SAS tool epatplot to compare the ratios of single, double, and multiple pixel events to model predictions. Pileup was manifest in the MOS2 spectrum as a 10% deficit at 0.2-0.3 keV and a 5% excess at 0.5-10 keV. We re-extracted the MOS2 spectrum, excluding the inner of the point-spread function. This reduced the net count rate to 3.7 ph s-1, and the pileup fraction to . We use this un-piled MOS2 spectrum in our analysis below.
The EPIC pn X-ray light curves (Fig. 1a,b) demonstrate significant variability. The 0.3-2 keV (soft) and 2-10 keV (hard) X-ray count rates decrease gradually from beginning to end of the observation. There is a slight increase in the hard count rate ks after the start of the observation, then it resumes its decline. This is accompanied by an increase in the hardness ratio. We concentrate our initial analysis on the total flux spectra for the entire observation. Then we split the EPIC pn spectrum into two 60 ks halves to study the form of the spectral variability.

The XMM-Newton Optical Monitor (Mason et al., 2001) was used to measure the UV light curve through the UVW1 filter (2900 Å, Fig. 1d), simultaneously with the X-ray observations. OM data were reduced using the standard omichain pipeline, with dead time and exposure time corrections applied. Fluxes were measured in a square aperture on a side which was centered on the galactic nucleus. The zero-points for the UVW1 and V magnitudes are from an XMM calibration document111 http://xmm.vilspa.esa.es/docs/documents/CAL-TN-0019. The flux in the UVW1 band decreased by over the course of the observation. The mean UVW1 count rate is 15.26 count s-1, yielding a monochromatic magnitude of 14.34. There is a small contribution from the Mg II broad emission line in this band, with the EW historically ranging from 37-53 Å (Maraschi et al., 1991). Assuming a similar EW, we estimate that this line contributes at most 7% of the observed UVW1 count rate. One V-band exposure was also taken to help pin down the SED, giving a count rate of count s-1 and mag. The (uncorrected) V-UVW1 spectral index is ().
We made Keck Low-Resolution Imaging Spectrometer (LRIS) observations on 28 August 2003 (MJD 52879.625414), 2 days after the XMM-Newton observation, to measure the optical continuum and broad emission lines. The exposure times are 500 s for the blue camera and 400 s for the red camera. Data reductions are made with IRAF. Primary calibrations include bias subtraction and flat-fielding. Blue flat-fields are from twilight sky observations, red flat-fields from the inside of the illuminated observatory dome. Blue and red spectra are split at 6800 Å by the 680 dichroic, but the flux is well-matched across the split. Spectra are extracted using a aperture. The red wavelength scale is calibrated using night sky emission lines, the blue wavelength scale using a combination of sky lines and Hg/Cd arc-lamp exposures. Flux calibrations for the red and blue spectra are from the standard star G191B2B, including a correction for differential airmass between the source and standard. The monochromatic magnitude at 5500 Å from the Keck spectrum matches the OM V-band measurement to within 0.1 mag. Similarly, the extrapolation of continuum in the Keck spectrum down to 2900 Å is in rough agreement with the UVW1 flux.

3C 120 was monitored over the period 17 Feb 2003 - 6 May 2004 (Fig. 2) at Metsähovi Radio Observatory in Kylmälä, Finland. Observations were made with the 14 m telescope at 37 GHz (8.1 mm). The 37 GHz receiver is a dual horn, Dicke-switched receiver with a HEMT preamplifier and is operated at room temperature. We use DR 21 as a primary calibrator, against which the flux density is calibrated to the Baars et al. (1977) scale. For more details about the Metsähovi observing system see Teräsranta et al. (1998). The flux at 37 GHz ranged from 1.7-4.3 Jy. The estimated flux on the date of the XMM observation was Jy, interpolated between the flux points measured for 25 and 29 August 2003. The source flared from 3-10 September (2003.67-69), doubling its radio flux from 2.0-4.2 Jy in 7 days. Fortuitously, this flare occurred only 8 days after the XMM observation. In the following months, the flare slowly decayed, with the 37 GHz flux remaining at a relatively high level of 3.1 Jy as late as 2004 May.
The source was also observed in the mm band with the 15-meter Swedish-ESO Submillimeter Telescope (SEST) on Cerro La Silla, Chile. Observations were made on 18 August 2003 by Dr. Y. Chin, 8 days before the XMM-Newton observation. Three sequential observations (spaced 10 min apart) were taken in fast mapping mode with SIMBA, a 37-channel bolometer array centered at 250 GHz (1.2 mm). For flux calibration Uranus was observed, also in fast mapping mode, and opacity corrections were made using frequent sky-dip observations. The maps are reduced using the standard reduction package MOPSI222Created by Robert Zylka at IRAM (Grenoble, France)..
The mean 250 GHz flux was Jy (Table 1), including the uncertainty in the absolute calibration. The 37 GHz flux was Jy on the date of the SEST observation, yielding an inverted 37-250 GHz spectral index of It is likely that a flare was already underway at 250 GHz at least 17 days before the start of the 37 GHz flare, and prior to the XMM-Newton observation (Fig. 2). The 250 GHz flux was at an unprecedented, very high level compared to a historical mean of Jy (Steppe et al., 1993). The outburst is confirmed by a December 2003 observation with the IRAM 30-m radio telescope, when the 150 GHz (2 mm) flux was still high but had dropped to 3.4 Jy333Data from the IRAM pointing source catalog at http://www.iram.es/IRAMES/index.htm.
Throughout this paper, we use neutral atomic photoelectric absorption cross sections from Henke et al. (1993) and solar abundances from Däppen (2000). We use the IMP444http://xmmom.physics.ucsb.edu/~pmo/imp.html and XSPEC555http://heasarc.gsfc.nasa.gov/docs/xanadu/xspec/. software packages for our spectral fits, and quote 90% confidence intervals for parameter uncertainties.
3 Archival Images
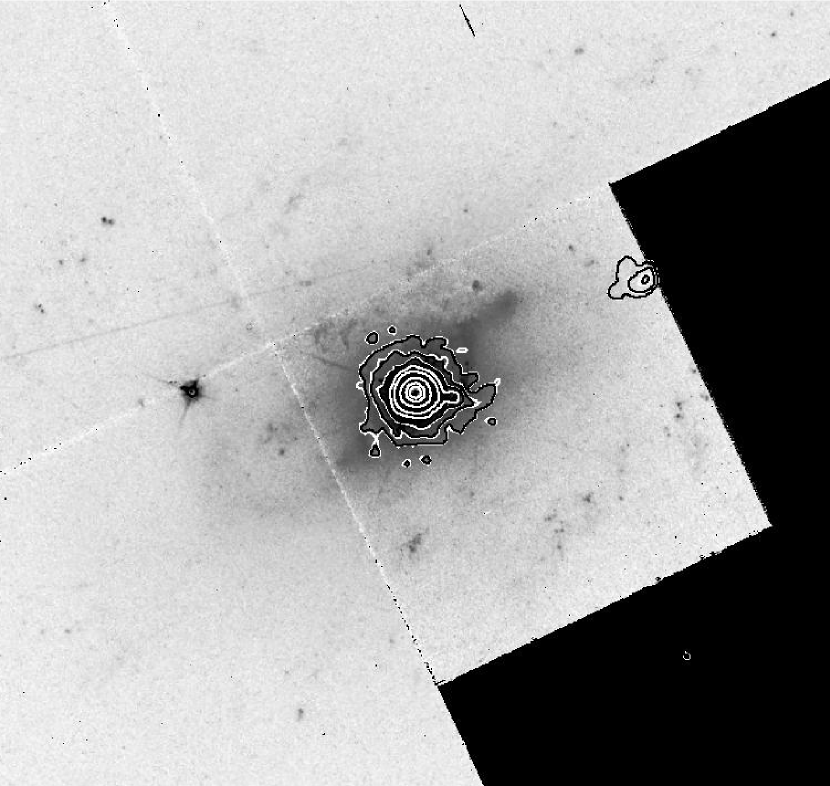
We analyze an archival Chandra image to evaluate extended emission which might contaminate the XMM spectra of the nucleus, and to test the hypothesis that the soft excess is from extended hot gas. A 60 ks HETGS exposure was taken in 2001 (McKernan et al., 2003). We extracted the 0-order image with CIAO 3.0.2, including events in the full 0.2-12 keV range of the detector. The X-ray contours are plotted over an archival HST WF/PC2 image (Fig. 3). In addition to the bright nuclear source, two strong X-ray knots are apparent in the image. A detailed analysis of this image and the extended X-ray jet is given by Harris, Mossman, & Walker (2004). The k25 knot at from the nucleus has a flux density of Jy at 1 keV, which is only 0.3% of the 1 keV flux density in our XMM spectra. The k4 knot from the nucleus has a similarly low flux of Jy at 1 keV.
To search for additional extended emission, we plot the 0.3-2 keV radial point-spread function (PSF) of the Chandra image (Fig. 4). For comparison, we plot a model of the Chandra High Resolution Mirror Assembly (HRMA) PSF, from a calibration file computed using the SAOSAC ray-trace program 666http://cxc.harvard.edu/cal/Hrma/psf/. Pileup losses are evident at small radii as a deficit in the observed PSF. The peak count rate is 0.28 counts pixel-1 frame-1, corresponding to moderately heavy pileup in the central pixels. The pileup fraction is reduced to at radii . The model PSF matches the observation well at . The k4 and k25 knots are evident as excess emission above the model. There also appears to be excess emission from , which amounts to 558 counts, or 1.9% of the total 0.3-2 keV source counts in the aperture, after correcting for pileup. We conclude that extended emission from the jet and other sources contributes of the total flux, and does not contribute significantly to the soft X-ray excess. Harris, Mossman, & Walker (2004) also find extended flux at in this image, after subtracting a 2D PSF model. Since this emission does not correspond to the radio jet, it may be an indicator of starburst activity in the inner disk.
The HST WF/PC2 image was taken 1995 July 25 (Fig. 3). The image is the sum of two s exposures in the F675W continuum filter (which includes the H line). We used IRAF/STSDAS to produce a mosaic from the 4 cameras and filter out cosmic ray events. The seams between the cameras show up white in the negative image. The host galaxy has a disturbed spiral morphology in the outer regions, with many discrete clumps suggestive of star-formation. There is a faint figure-8 structure with lobes stretching ESE-WNW, which is also apparent in the ground-based image taken by Hjorth et al. (1995), who identify the western branch of this feature with optical emission from the jet. However, this connection is questionable, since the other branches of the figure-8 do not correspond to emission from the jet. Instead, we suggest that this structure is the signature of a late-stage galaxy merger. The bright NW branch of the figure-8 is dominated by continuum emission (Hjorth et al., 1995), consistent with starlight. The overexposed inner region of the galaxy has a strong spiral pattern including dust lanes, which winds in the opposite sense to the outer spiral arms (Harris, Mossman, & Walker, 2004), another indication of a past merger.

4 XMM-Newton X-ray Spectra
4.1 RGS Spectrum
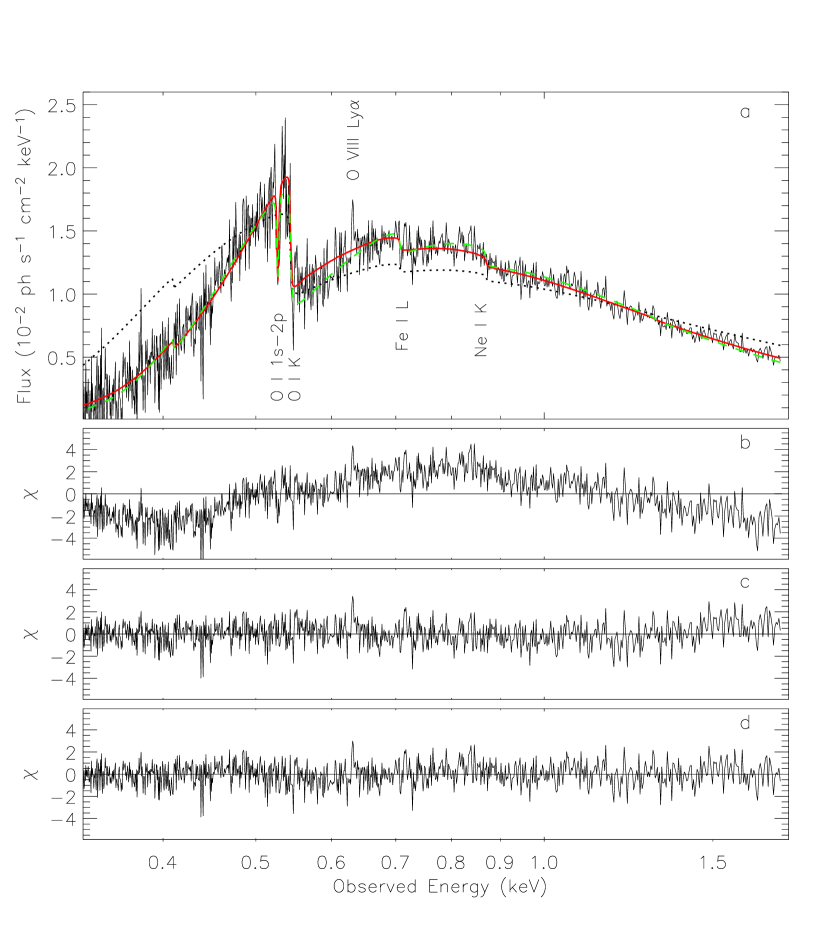
The RGS X-ray spectrum is heavily absorbed below 1.0 keV by the large Galactic neutral absorption column (Fig. 5). There are strong Galactic O i, Fe i L, and Ne i K edges at 0.54, 0.71, and 0.87 keV. We also find Galactic O i 1s-2p absorption at keV. This line is fit by a narrow Gaussian with an equivalent width of eV.
We initially fit the 0.3-1.8 keV RGS spectrum with a single power law absorbed by the Galactic column density, assuming solar elemental abundances. A column density of cm-2 is measured from the integrated Galactic H i 21 cm line, with an uncertainty dominated by opacity correction (Elvis et al., 1989). The 21-cm measurement should be accurate to within 30% , and includes all H i emission within km s-1 of the local standard of rest (Elvis et al., 1989; Lockman, Jahoda, & McCammon, 1986). A survey for H i at high velocity ( km s-1) yields a single cloud with cm-2 in the direction of 3C 120 (Lockman et al., 2002), which is negligible. The power law model absorbed by the Galactic H i column gives a very poor fit to the data, with (Fig. 5b).
Next we allow the Galactic O i abundance to vary, since the O i K edge depth otherwise limits to lower values. This model gives a much better fit, with , except for some significant positive residuals at 1.2-1.8 keV. The best fit column densities are cm-2 and cm-2, yielding a Galactic O i abundance of times the solar value. The value is consistent with ROSAT measurements (Grandi et al., 1997). The O i column is consistent with the O i 1s-2p line EW for a Doppler parameter of km s-1, on the saturated part of the curve of growth. Curves of growth were generated with IMP, using an oscillator strength computed with HULLAC (Bar-Shalom et al., 2001; Behar & Netzer, 2002). The Galactic O i line width is reasonable, considering turbulence and rotation. Because of the large uncertainty in its width, we do not rely on the 1s-2p line to measure the O i column, which is better measured from the K edge.
The inferred is 2.3 times as great as that measured from Galactic H i 21-cm emission. One possibility is that the excess column of cm-2 arises in the host galaxy or AGN itself. Any intrinsic O i edge should be redshifted to an energy of 0.526 keV. This edge falls near the Galactic O i 1s-2p absorption line, but should be distinguished by its much broader shape (as seen for the Galactic edge). There appear to be no significant intrinsic absorption edges. Adding an intrinsic O i edge to the broken power-law model, we find a upper limit to the column of cm-2, corresponding to cm-2 for solar abundance. An O i abundance of solar would be required if the extra hydrogen column is intrinsic to 3C 120 rather than the Galaxy. A similar limit applies for intervening neutral hydrogen clouds, since no O i edges are seen at redshifts .
Independently increasing the Galactic He i or C i column over the nominal values by cm -2 or would cause a similar amount of excess absorption, but yields worse fit statistics ( and , respectively). These correspond to a Galactic He abundance of 2.6 times solar or a C abundance of 8.2 times the solar value, both of which seem unlikely.
Alternatively, we can fit the low-energy turnover in the RGS spectrum with a broken power-law model. We fit for the Galactic column assuming solar O i abundance. The best-fit model has a break at keV, and provides an excellent fit to the spectrum, with . Below the break energy, the spectrum is inverted with . Above the break, the power law index is moderately soft (). The normalization is ph s-1 cm-2 keV-1 at the break. The best fit Galactic column density is cm-2, which is 40% greater than that measured via H i 21-cm emission. This corresponds to an O i column of cm-2, which is close to the value we obtained above. The origin of an inverted intrinsic soft X-ray spectrum below 0.6 keV is difficult to understand, and it is suspicious that the spectrum breaks near the energy of the O i edge.
The soft X-ray continuum is not resolved into narrow emission lines at RGS resolution. This excludes a large contribution to the soft excess from collisionally ionized or photoionized gas in the narrow- or broad-line regions. The extended emission at from the core in the Chandra image (Fig. 4) is spatially unresolved by RGS, so any emission lines from this component would not be spatially broadened. In addition, it contributes only 2% of the total soft X-ray flux. The k4 and k25 knots in the X-ray jet also give a negligible contribution to the spectrum.
Adding a narrow O viii emission line significantly improves our RGS model fit by for 2 additional parameters. The flux in the line is ph s-1 cm-2 and the equivalent width is eV. The peak energy is keV, corresponding to O viii Ly at a redshift of 0.036. In comparison, the optical [S ii] emission line redshift is 0.033 (§5), yielding a relative velocity of km s-1. The O viii emission may come from hot gas which is falling toward the nucleus as the result of a galaxy merger. Alternatively, the apparent redshift could come from absorption on the blue side of the O viii line, arising in an ionized outflow. Detection of additional emission lines will be required to distinguish between these two possibilities.
There is no other evidence of absorption from an ionized absorber. There are only 3 other narrow features in the residuals to the model fit which are significant at the level (Fig. 5). These are negative spikes at 0.438, 0.440, and 0.729 keV. With 945 bins, we expect an average of 2.5 single bin spikes per observation to exceed . We put upper limits on the column density of N vi-vii, O vii-viii, and Ne ix of cm-2 for km s-1. For column densities greater than these, absorption lines would be clearly present at . The column density upper limits for inner-shell transitions of N i-v and O i-iii,v-vi are cm-2 for km s-1 (intrinsic O iv would be blended with O i at ).
We find no evidence for the absorption features reported from Chandra at 0.645 keV and 0.71 keV (McKernan et al., 2003). The first feature was identified with O viii Ly at and attributed to the warm-hot intergalactic medium (IGM). The second feature is unidentified. XMM would have easily detected these features with their reported 2.0 eV equivalent widths if they were present during our observation. Fitting Gaussian absorption lines with energies and FWHMs fixed to the Chandra values, we find upper limits of 0.2 and 0.9 eV for the 0.645 keV and 0.71 keV features, respectively. The lack of an XMM-Newton detection disproves an origin in the IGM, which should not be variable in the short interval between the 2 observations. It also implies that either a) the features are from variable, intrinsic absorbers in 3C 120 or b) they are instrumental artifacts or statistical fluctuations in the Chandra spectrum.
4.2 EPIC pn and MOS
4.2.1 Hard X-ray spectrum

We fit the joint EPIC pn and MOS2 hard X-ray spectra (Fig. 6) with a power law from 3-10 keV. All hard X-ray models are absorbed by a neutral gas column fixed at cm-2. (There is little change in the model for a range of at energies keV.) The hard power law has a photon index of . The pn and MOS2 normalizations are ph s-1 cm-2 keV-1 and ph s-1 cm-2 keV-1, respectively, at 1 keV. The fit is poor () because of residual Fe K emission.
Adding a Gaussian Fe K line to the model gives a greatly improved fit statistic of . The line energy is keV, indicating neutral or low-ionization Fe at a redshift of , consistent with the optical [S ii] emission lines (§5). The flux in the Fe K line is ph s-1 cm-2, and EW eV. The line is marginally resolved with an intrinsic width of eV, convolved with the instrumental width of eV. Assuming a single ionization state, this corresponds to a FWHM of km s-1, indicating a possible origin in the broad-line region (BLR).
There appears to be a weaker emission line with EW eV at keV ( keV at ). Adding this line to the model improves the fit significantly, with ( for 3 additional degrees of freedom). This may be a blend of Fe xxvi Ly (6.97 keV) and Fe i K (7.06 keV). The ratio of the 6.75 keV to 6.21 keV line fluxes is . This is greater than the expected ratio of neutral Fe K and Fe K fluorescence yields (Kaastra & Mewe, 1993).
Adding Compton reflection to the model (Magdziarz & Zdziarski, 1995) gives an equally good fit (). The photon index is not significantly altered () . The reflection fraction is weakly constrained, with . Here we fix the high energy PL cutoff to 150 keV, the cosine of the disk inclination to (face-on), and assume solar abundance of Fe. Adding the reflection component reduces the Fe K line equivalent width to eV, and the 6.75 keV line equivalent width to eV. The ratio of the 6.75 keV to 6.21 keV line fluxes is , still marginally greater than the predicted Fe K to Fe K ratio.
We do not find any evidence of a relativistically broadened Fe K line in the EPIC pn spectrum. We try fitting the continuum plus a Fe K line with a Laor (1991) profile. A narrower line profile, such as might be found around a Schwarzschild black hole, would be easier to detect, so this is a conservative model. We assume a disk viewed at an inclination of with radial emissivity profile , which extends from 1.24-400 around a near-maximally rotating Kerr black hole. A narrow Fe K line and cold Compton reflection are also included in the model. All fits with yield zero flux for the relativistic Fe K line, with an upper limit of eV on the equivalent width. Broader lines with are allowed, but would be indistinguishable from the underlying continuum.
We would have definitely seen a broad line as strong as the EW eV ( ph s-1 cm-2) line reported for the 1994 ASCA observation (Grandi et al., 1997). We can not exclude the possibility that the line has varied between 1994 and the present epoch. However, it is more likely that the Fe line width was previously overestimated because of the break in the underlying continuum (Wozniak et al., 1998). Fitting the ASCA data with a power law that breaks at 4.0 keV yields a much smaller, narrow line with EW eV.
4.2.2 Soft X-ray Spectrum


There is a large soft X-ray excess in the EPIC spectra over the extrapolated hard (3-10 keV) spectral models (Fig. 7). The excess is localized to the 0.4-2.5 keV band and peaks at keV in the pn spectrum. The MOS2 soft excess has a smaller peak which is shifted to 0.7 keV, perhaps because of calibration differences. To further characterize the soft X-ray spectrum, we now concentrate on fitting the pn data, which have higher S/N and more accurate calibration than MOS2.

Guided by our fits to the RGS spectrum, we parameterize the full EPIC pn continuum as a hard power law plus a power law for the soft excess bump (Fig 8a,b). We allow the Galactic and O i abundance to vary. The narrow Fe K emission lines are included, but no Compton reflection. This gives a formally poor fit, with (). The spectral slopes are and . The Galactic column is cm-2, nearly twice as great as the nominal Galactic value.
The main residuals to the fit are caused by the C i, O i, and Si i K, and Au i M instrumental absorption edges. We also identify weak absorption edges from instrumental Cu i L and Al i K. There is curvature in the 3-10 keV residuals, also arising from calibration inaccuracies. All of these instrumental features are seen at a similar strength in an EPIC pn calibration spectra of 3C 273777http://xmm.vilspa.esa.es/ccf/, document XMM-SOC-CAL-TN-0018.. Except for the C i edge, the pn effective area is calibrated to better than 5% at most energies. However, the 3C 120 observation has better photon statistics than this, and errors in the continuum parameters are dominated by the systematics of the instrument calibration. We include a 5% uncertainty in all EPIC continuum parameters and column densities to allow for this.
Next we try a hard power law plus a broken power law for the soft excess bump (Fig. 8c). The Galactic column is fixed to cm-2, the value obtained from the similar RGS fit. The O i and other metal abundances are fixed to their solar values. This model gives a somewhat better fit, which is still formally poor (). The most improvement occurs in the 3-10 keV region, because this model has more freedom to follow the curvature in this part of the spectrum. The residuals are again dominated by instrumental edges. The hard power law has and dominates at keV. Below this energy, the soft excess follows a power law with , which breaks at keV. Below the break energy, the soft excess has a slope of , which is sensitive to variations in the break energy.
While the broken power-law soft excess provides a better fit than the power law with excess absorption, uncertainties in the instrument response imply that neither model is obviously preferred. Now we evaluate a number of physical models of the soft X-ray excess continuum which might yield a broken power-law or continuum peaked at 0.6 keV. All model fits (except the ionized disk model) also include a hard power law, neutral reflection, and the narrow Fe K emission line. We allow for intrinsic neutral absorption in each, with solar abundances.
First we fit the soft excess with a multi-color disk blackbody (diskbb) model (Shakura & Sunyaev, 1973; Mitsuda et al., 1984), which would be appropriate for a geometrically thin, optically thick accretion disk with purely absorptive opacity (Fig. 9c). This gives a poor fit (), with a residual bump peaking at 0.6 keV. The temperature at the inner radius is keV, too high to be attributed to a thin disk around a black hole with reverberation mass of . The intrinsic neutral column density is cm-2.
A Comptonized spectrum (XSPEC compTT model, Titarchuk 1994) also provides a poor fit to the soft excess, with (Fig. 9d). The best fit value for the Comptonizing temperature is the lowest allowed by the model (kT=2 keV), the temperature of the input Wien spectrum is 0.1 keV, and the Compton optical depth is . It is unlikely a lower Comptonizing temperature would provide a reasonable fit. A problem with this model is the rather large temperature for the soft photon source. If this value is fixed to something more appropriate for a big blue bump in the range 0.01-0.05 keV, the fit becomes even worse. The intrinsic neutral column density is cm-2, similar to the previous model.
At high accretion rates, the inner accretion flow may puff up into a thick disk or ion torus. This solution for a viscous accretion disk was predicted by Shakura & Sunyaev (1973), in the regime where photon pressure dominates over gas pressure. For very high scattering optical depths and saturated Comptonization, emission from the thick disk takes on the form of a Wien bump. We fit the soft excess with a Wien spectrum to test this model (Fig. 9e). The best fit gives a Wien temperature of keV ( K), and . The problem with this and the previous two models is that the observed bump is cuspy (fit best by a broken power-law), while the models produce more gently curved bumps. Allowing a range of temperatures in the models would worsen the problem by broadening the predicted soft excess.
Finally, we try fitting the soft excess with a constant density ionized disk model (Ross & Fabian, 1993; Ballantyne et al., 2001). The model also includes a narrow, neutral Fe K line. Adding neutral intrinsic absorption does not improve the fit, so we do not include it. The best fit model has , a reflection fraction of and an ionization parameter of . As well as providing a poor fit, with (Fig. 9f), the best ionized disk model produces a narrow 6.7 keV Fe xxv line not seen in the data. We also tried convolving the ionized disk model with a relativistically broadened line profile (Laor, 1991), which gives a worse fit to the EPIC pn spectrum. In comparison, Ballantyne, Ross, & Fabian (2002) find a good fit to the 0.8-10 keV ASCA (1994) spectrum with their ionized disk model, which includes a relativistically broadened Fe K line. As we explained above, the appearance of a broad Fe K line in the ASCA data set is most likely an artifact of the spectral break at 4 keV. The lack of any conspicuous broad lines in the XMM-Newton spectrum, at hard or soft energies, puts strong constraints on ionized disk models. The reflection fraction must be small (), the ionization parameter must be large (), or the metal abundances must be sub-solar to create a featureless reflection spectrum. In any case, ionized reflection does not give the proper shape for the soft excess.
Lacking a viable physical model for a sharply peaked soft excess, we conclude that absorption is the most likely explanation for the steep drop in the continuum below 0.6 keV. However, the absence of an intrinsic O i edge is inconsistent with absorption from the neutral interstellar medium (ISM) of the host galaxy. A similar break is seen in XMM-Newton spectra of the BL Lac object MS 0205.7+3509, and is attributed to a low-metallicity intervening absorber (Watson et al., 2004). For a high excess H i column density, we would expect to see damped Ly absorption in the UV spectrum of 3C 120. There is no evidence of absorption on the blue wing of the Ly line in the IUE spectrum (Maraschi et al., 1991), though geocoronal Ly contaminates the spectrum for absorber redshifts . Another way to test the absorption hypothesis would be to search for redshifted H i 21-cm absorption.
Next we consider the possibility that the excess absorption comes from within the jet. The spectral index below 0.6 keV is similar to that predicted for synchrotron self-absorption by electrons with a power-law energy distribution (, , with shallower slope possible for multiple synchrotron components). However, the turn-over frequency seems implausibly high for synchrotron self-absorption, yielding a source size of only 5,000 km () and a magnetic field strength of 4 MG, assuming equipartition of electron and magnetic energies. We therefore discard this explanation.
Excess absorption may also come from from matter entrained in the jet or interacting with the jet. Large turbulent velocities might smear out the O i edge. In both cases, the H i would have to be located at in order to absorb X-ray emission from the unresolved core of the Chandra image. However, entrainment of such a large column of H i seems unlikely in the inner jet, which maintains an apparent speed of 5-6c as far as 200 mas from the core (Walker et al., 2001). It is also likely that entrained matter would be rapidly ionized before reaching relativistic speeds. Another idea is that spallation by relativistic particles in the jet destroys the heavy metals in an interacting cloud. However, hydrogen would also be ionized in the process. Interestingly, Gomez et al. (2000) attribute rapid PA rotations at mas from the radio core to Faraday rotation from an ionized cloud with a column density of cm-2 which is interacting with the jet. Only of the hydrogen in the cloud need be neutral to explain the excess X-ray absorption. However, the PA rotations could also be explained by a helical magnetic field (Gomez et al., 2001).
5 Optical Spectrum
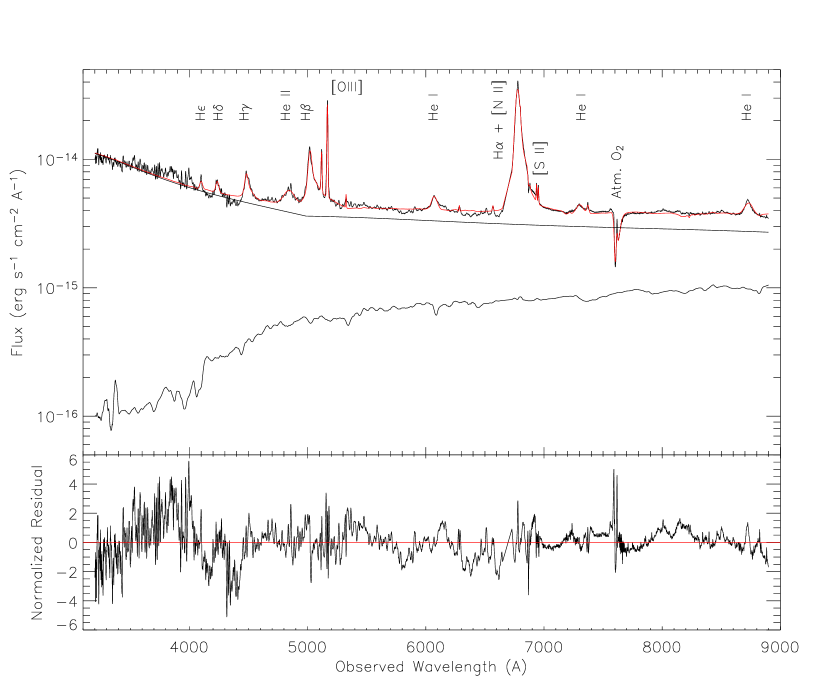
We fit the Keck LRIS spectrum (Fig. 10) with a continuum model consisting of a broken power-law plus stellar emission, modified by Galactic extinction (Cardelli, Clayton, & Mathis, 1989). The LRIS spectrum also includes absorption from atmospheric oxygen and water bands, which is modeled using a template obtained from standard star observations.
The extinction and reddening from dust associated with the Galactic H i column are and E(B-V) = 0.2. Larger values of and E(B-V) = 0.29 follow from the RGS broken power-law model with cm-2. A reddened power law fit to the UV spectrum (Maraschi et al., 1991) gives a similar value of , and this is the value we adopt in our models of the Keck spectrum. An intrinsic absorber with cm-2 would imply an additional , if it had a Galactic dust/gas ratio. There is no evidence of this extra extinction in the optical-UV spectrum, which agrees with the low O i abundance from the X-ray spectrum.
We use the elliptical galaxy NGC 1316 to create a template for starlight emission from the host galaxy. The galaxy fraction increases from 7% at 5000 Å to 28% at 8900 Å. We can not make an accurate measurement of the host galaxy redshift because the galaxy fraction is small and the absorption lines are confused with emission lines from the AGN.
The underlying (extinction-corrected) optical continuum is approximated by a broken power-law with indices of and , respectively, below and above a break at Å. It is likely that a pseudo-continuum of broad Fe emission lines and Balmer continuum contribute significantly below 4000 Å. The power-law normalization is erg s-1 cm-2 Å-1 at the break.
The optical spectrum contains a number of broad permitted lines and narrow forbidden lines. The best-fit emission line velocities, widths, and extinction-corrected fluxes are given in Table 2. Emission lines from the same ion are constrained to have the same redshift and Doppler width. The [S ii] lines are the narrowest in the spectrum (FWHM km s-1), so we use their redshift of to compute relative velocities for the other lines. The narrow O iii emission lines have a greater width of FWHM km s-1 and are blue-shifted by km s-1 with respect to [S ii]. Weak narrow [Fe vii], [Ar iii], and [Oi] are also visible. We fail to detect [O ii] 3727 which is in a noisy part of the spectrum, or [N ii] 6548,6583 which are blended with broad H.
The broad He i emission lines are redshifted by km s-1, and have widths of FWHM km s-1 (Table 2). The He ii line has a similar redshift, but is considerably broader, with FWHM km s-1. The broad H-Balmer emission lines have asymmetric profiles, with a broad red tail. A similar red asymmetry is seen in the UV broad line profiles of H i Ly, and C iv 1549 (Maraschi et al., 1991). We have decomposed the broad H-Balmer lines into three Gaussian components, one narrow, and two broad. The narrow (FWHM km s-1) component has a small blueshift of km s-1. The broad components have large redshifts of , and km s-1, respectively. The red asymmetry may be attributed to optical depth effects if the Balmer lines are emitted in a disk wind. The very broad component (FWHM km s-1) is most prominent in the H line, but this may be contaminated by emission from broad Fe II.
The total (extinction-corrected) H flux is erg s-1 cm-2. The reddening-corrected Balmer series lines are in the ratios H : H : H. The Balmer decrement is significantly less than the value of 3.1 predicted for for Case B recombination, which has H : H : H (Osterbrock & Miller, 1975). It is also smaller than the average Balmer decrement of 3.5 for the Piccinotti et al. (1982) sample of Seyferts and quasars (Ward et al., 1988). This may indicate that we have over-corrected for reddening. However, if we remove the broadest Balmer line component, which is potentially contaminated by broad Fe II, we find H : H : H. The Balmer decrement therefore depends sensitively on how the line is decomposed.
The Balmer H equivalent width of Å is greater than the mean AGN value of Å (Dietrich et al., 2002). (Note that H EW is fairly independent of continuum luminosity.) This indicates a negligible amount of beamed continuum at 5000 Å. This is corroborated by the relatively low optical continuum polarization () which is unlikely to have a synchrotron origin since it shares the same position angle (PA) as the emission lines (Rudy et al., 1983; Antonucci, 1984). The polarization drops to 0.3% in the H band (Brindle et al., 1990), arguing against a near-IR synchrotron component. The contribution to the optical spectrum from the extended jet is negligible, since its extinction-corrected B-band flux density of Jy (Hjorth et al., 1995) is less than 0.1% of the flux density from the core. We conclude that highly beamed continuum from a relativistic jet does not greatly compromise our estimate of the isotropic AGN luminosity and accretion rate.
6 Discussion
6.1 Spectral Energy Distribution
The spectral energy distribution (SED) of 3C 120 can be used to constrain the properties of the accretion flow and the jet. The optical through soft X-ray portion of the SED is affected by extinction and reddening from a large Galactic column. We correct the Keck spectrum and OM photometry for this using the extinction law of Cardelli, Clayton, & Mathis (1989), with mag and . The X-ray spectrum is corrected for a Galactic absorption column of cm-2. Our data points for the SED are compiled in Table 1 and plotted in Figure 11a. Except for the high 250 GHz flux, our data are in good agreement with the archival SED (Fig. 11b) from the NASA Extragalactic Database (NED) and the IR to X-ray SED measured by Maraschi et al. (1991).
The extinction and absorption-corrected luminosity from optical through X-rays (- Hz) is erg s-1 (assuming isotropic emission and a Hubble constant of km s-1 Mpc-1). We have interpolated a power-law with between the UVW1 and 0.3 keV flux points to estimate the UV luminosity. In comparison, the Eddington luminosity for a black hole is erg s-1, yielding an Eddington ratio of . The accretion flow is therefore radiatively efficient, contrary to the idea that 3C 120 contains an advection-dominated accretion flow (Eracleous, Sambruna, & Mushotzky, 2000).

The optical-FUV region is crucial for studying any thermal accretion disk contribution to the SED, typically manifest as the so-called big blue bump (BBB). For comparison to the observed SED, we plot a multi-color disk blackbody spectrum for a black hole radiating at 30% of the Eddington luminosity. The disk extends from , and we neglect relativistic effects and Comptonization. This model has an optical spectral index of , which does not match the observed (de-reddened) optical index of . In addition, the observed flux is a factor of greater at 5000 Å than the model prediction. The excess can not be accounted for by emission from the broad-line region. A simple multi-color disk model gives a poor description of the observed SED.
The ratio of 0.3-10 keV X-ray to optical luminosity is , so a significant fraction of the accretion energy may be dissipated in a hot corona. The hard X-ray power law is consistent with unsaturated thermal Comptonization in a hot plasma with a Compton y-parameter of 1.3. The soft X-ray excess contributes 37% of the total 0.3-10 keV X-ray luminosity, so it is also energetically important. A soft excess is not predicted in simple corona models, and requires an additional emission or scattering region. A second, cooler Compton-scattering region may produce the soft excess (Magdziarz et al., 1998). Perhaps a disk corona produces the soft excess while the hard power law comes from the base of the jet. Another possibility is that the soft excess arises from turbulent Comptonization in the disk (Socrates et al., 2004). However, none of these models predict a break in the spectrum below 0.6 keV.
The reddening-corrected optical to X-ray spectral index (measured between 2900 Å and 2 keV) is , which is typical for an AGN or quasar (Mushotzky & Wandel, 1989). There is no indication that the radio-loudness of the source has any effect on the relative strengths of the UV and X-ray emission. It would be valuable to determine if changes during radio component ejection events (Marscher et al., 2002). This would test if there is a connection between these events and the state of the inner accretion disk.
In principle, the X-ray continuum could be enhanced by beamed emission from the relativistic jet. The radio-X-ray index is (37 GHz-2 keV), similar to the index expected for optically thin X-ray synchrotron emission. This also matches the observed hard X-ray spectral index, consistent with a synchrotron spectrum extending directly from radio through hard X-rays. However, this appears to be a coincidence since the strong Fe K emission line rules out a highly beamed X-ray continuum (§6.2). The 250 GHz to X-ray index of is not steep enough for synchrotron emission from the 250 GHz radio component to account for much of the soft X-ray excess. We note that while there does not appear to be a large amount of beamed X-ray emission from the jet, it is entirely possible that unbeamed X-rays are produced in a sub-relativistic jet base. Or equivalently, the hard X-ray emitting corona may be the jet base. This is supported by the strong correlation observed between X-ray and (beaming-corrected) radio core luminosity in AGN (Merloni, Heinz, & Di Matteo, 2003; Falcke, Körding, & Markoff, 2004).
6.2 Fe K Emission Line
The Fe K emission line can be used to give an indication of the beamed continuum fraction. For an isotropic continuum source, it gives an estimate of the covering fraction of the emission line region. The velocity width of the line can be used to estimate the radial distance of the emission line region from the nucleus given the black hole mass.
The strength of the Fe K line (EW eV) is evidence that the hard X-ray continuum originates primarily from an unbeamed (or weakly beamed) source such as an accretion disk or base of the jet rather than the superluminal jet. If all of this continuum were highly beamed within a cone, then the geometry would be unfavorable for reflection. For neutral fluorescence, the line equivalent width scales with the reflection fraction roughly as EW eV (Zdziarski & Grandi, 2001; George & Fabian, 1991) (for ). The observed Fe K equivalent width yields , consistent with the value derived for Compton reflection in the hard X-ray spectrum (Zdziarski & Grandi, 2001). This implies a beam opening half-angle for the hard X-ray continuum of .
If the hard X-rays are unbeamed and reprocessed by a molecular torus, then the Fe K line in 3C 120 implies a torus opening half-angle of , in the limit of large torus column density. In comparison, the mean narrow Fe K equivalent width for Seyfert 1s observed with ASCA (Nandra et al., 1997) is 100 eV. This implies a larger mean covering fraction of 0.63 and a smaller mean torus opening half-angle of for Seyferts. If the intrinsic Fe K line EW of 3C 120 is truly smaller than that of the average Seyfert 1, then the maximum fraction of beamed hard X-ray continuum is 40%.
The Fe K line is marginally resolved by EPIC pn, with FWHM km s-1. This indicates that at least part of the line may come from the outer accretion disk or BLR. Assuming that the emission region is virialized gives a distance of from the central black hole. In that case, the light crossing time is 15 days, so we do not expect significant Fe K variability during the XMM-Newton observation. However, this is subject to considerable uncertainties in the geometry and dynamics of the Fe K emission region. The broadest lines in the optical spectrum have comparable FWHM km s-1. It is an intriguing possibility that Fe K and the optical broad lines come from the same region. In that case, the torus covering fraction arguments above apply to the BLR instead.
Line blending and other broadening mechanisms are unlikely to account for the Fe K line width. The separation between the lines in the Fe i K doublet is 13 eV (Decaux et al., 1995), much narrower than the observed width. The expected energies of the Fe xviii and Fe i K lines are separated by 50 eV, again less than the observed line width. The Fe K line center is within 10 eV (at 90% confidence) of the expected energy of Fe i at , arguing against a large contribution from ionization states greater than Fe xv. The natural and thermal line widths are also negligible in a low-ionization plasma (Yaqoob et al., 2001). The gravitational redshift at is eV, which is small.
The non-detection of relativistic Fe K in the EPIC spectra does not constrain neutral accretion disk models particularly well. The 100-200 eV upper limit for the line EW corresponds to a cold reflection fraction of . This still allows a simple model where the hard X-rays are produced entirely in a plane-parallel, isotropically emitting corona over a cold disk with solar iron abundance. In comparison, the relativistic Fe K line in MCG-6-30-15 has an equivalent width of 300-400 eV, and appears to come from an ionized disk (Wilms et al., 2001). We would have detected a similar line in 3C 120 with great confidence. However, such lines appear in only a small number of Seyfert 1s observed with XMM-Newton, and may require special conditions to form. It is not clear that the absence of relativistic Fe K in 3C 120 is related to its status as a radio-loud AGN.
6.3 X-ray Variability


The X-ray flux of 3C 120 decreases in a fairly steady manner during the XMM-Newton observation (Fig. 1a,b), accompanied by a gradual increase in the hardness ratio (Fig. 1c). The hard (2-10 keV) count rate drops by 13%, while the soft (0.3-2 keV) count rate drops by 18% in 120 ks. The net result is a hardening of the spectrum and an anti-correlation between X-ray flux and spectral hardness. The hard X-ray flux doubling time is roughly sec, corresponding to a light-crossing time of days ().
The correlation between X-ray spectral index and soft X-ray flux was discovered in a 1979-1981 series of Einstein observations, and attributed to a variable, steep synchrotron component in the soft X-ray spectrum (Halpern, 1985). Further EXOSAT observations show that the X-ray spectrum sometimes pivots at an energy of 2 keV (Maraschi et al., 1991), arguing against the synchrotron interpretation. The correlation persists at shorter timescales, as seen in a 200 ks Beppo-SAX observation by Zdziarski & Grandi (2001), who find a pivot energy of keV. These authors suggest that the Comptonized X-ray continuum responds to variations in the UV seed photon flux. An increase in the seed photon flux cools the Comptonizing atmosphere, resulting in a steeper X-ray spectrum.
To better determine the form of spectral variability, we split the EPIC pn spectrum into two 60-ks halves (Fig. 12). The ratio of the 2 spectra (Fig. 12b) demonstrates that the second spectrum is harder than the first across the entire 0.3-10 keV band. There is no break in the ratio at either of the X-ray spectral breaks. This implies a close connection between the hard and soft X-ray variability. The ratio is fit well by a power law (), with a slope of and a pivot energy of keV (extrapolated beyond the EPIC spectral range). This is much greater than the pivot energies found by Maraschi et al. (1991) and Zdziarski & Grandi (2001), and consistent with the keV pivot found by Halpern (1985). Most Seyfert galaxies which display pivoting have pivot energies of keV (Zdziarski et al., 2003). The occasionally low pivot energy in 3C 120 is unusual, but can be explained if the corona luminosity and optical depth stay constant while the seed photon flux changes (Zdziarski & Grandi, 2001).
The Fe K line is constant within the uncertainties of our measurement, resulting in a (noisy) dip in the ratio spectrum at 6.2 keV (Fig. 12b). Adding a Gaussian to model the dip improves the fit at the 95% level ( for 1 additional degree of freedom), illustrating a small ( eV) rise in the Fe K equivalent width. The constant Fe K flux is consistent with an origin in the BLR at light-days, which is not expected to vary much during the XMM-Newton observation.
6.4 UV Variability
The UVW1 count rate is variable, falling by 2% along with the X-ray flux (Fig. 1d). This variability is shown to be highly significant by a test, which gives (with a vanishingly small probability). It is unlikely that Mg II emission from the BLR varies much over the 1.5 day duration of the OM observation. A constant, contribution of Mg ii to the total flux reduces the observed variability amplitude in the UVW1 band by only 0.1%.
We compute the cross-correlation function (CCF) between the 0.3-2 keV X-ray and UVW1 light curves (Fig. 13), binning the X-ray curve to match the UVW1 sampling. We use interpolation to compute the CCF, according to the method of White & Peterson (1994). There is a strong peak in the CCF with a peak amplitude of 0.65 at zero lag. To determine the significance of the correlation, we simulate 1000 independent X-ray light curves and cross-correlate them with the UVW1 light curve. The duration, sampling, and variance are matched to the observed X-ray curve. We assume a red noise prescription for the power spectral density (PSD) of the X-ray light curve, which follows a power law. Our Monte Carlo simulations show that peaks as strong as the observed one occur by chance only of the time. We therefore conclude that the soft X-ray and UV light curves are positively correlated.
However, the correlation doesn’t necessarily imply the UV and X-ray fluxes are causally connected. If we divide out the overall slopes of the two light curves and repeat the cross correlation, we find no significant correlation (peak amplitude of 0.31). Consequently, it is not possible to determine a reliable lag between the UV and X-ray light curves. A longer data stream with correlated ups and downs would be necessary to determine a lag.
The UV-X correlation could in principle be caused by X-ray heating of the UV emitting region. The 2% magnitude of the UVW1 variation is consistent with from the SED times the 15% X-ray variability, if the UV emitting region intercepts all of the X-ray flux. If we assume an accretion disk which radiates locally like a black body, then the 2900 Å emissivity peaks at for a black hole accreting at 30% of the Eddington rate. We would expect the UV to follow the X-rays with a perceptible delay ( ks light-travel time) if the X-ray source is located near the center of a disk. It will be important to measure the lag to test this hypothesis. Such X-ray reprocessing may have been detected in the UVW1 light curve of NGC 4051 (Mason et al., 2002), where the UV variations lag the X-rays by ks. Alternatively, the X-rays could be produced directly above the UV emission region, yielding no perceptible lag.
Another possibility is that we have observed the variability signature of Compton scattering of UV photons into the X-ray band. The drop in UVW1 (2900 Å) photon flux seems insufficient to drive the greater drop in X-ray photon flux. However, there may be greater variability at shorter UV wavelengths. We expect the X-rays to lag the UV if they are produced by Comptonization of UV photons. The size of the lag depends on the geometry of the X-ray and UV emission regions. If the X-ray emission comes from a coronal layer above the accretion disk, the delay will be small. There also may be positive feedback, with the Comptonized photons scattered back to the disk providing an extra source of heating.
6.5 Radio Variability
The X-ray variability should be considered in the context of a strong radio flare (Fig. 2). The XMM-Newton observation took place when the 250 GHz emission from the source was at an all-time high. The combined Metsähovi and SEST flux points for 18 August 2003 indicate an inverted radio spectrum (). We may have witnessed a high-frequency peaking radio flare, associated with a new radio component ejection. We believe that the flare in these cases starts at very high (i.e., IR) frequencies. Then the shock grows in strength, and its spectrum moves in (, ) space so that the turn-over frequency decreases and the shocked region becomes visible at 250 GHz, then at lower radio frequencies. All indications, from emission line equivalent widths and continuum variability, are that the flare and radio jet do not contribute a significant flux in the optical or X-ray bands.
The 37 GHz outburst in 2003 had a magnitude of 2 Jy and a 17 day exponential rise time. The corresponding variability brightness temperature (Lähteenmäki & Valtaoja, 1999) is K. Assuming that the flaring component has an equipartition temperature of K (Readhead, 1994), the variability Doppler factor is , similar to the Doppler factor derived from high-frequency VLBI measurements at earlier epochs (Gomez et al., 2000). Looking at the historical 37 GHz flux curves of 3C 120 (Teräsranta et al., 1998) we see that the timescales of the flares are much slower than for the 2003.7 event, with an average rise time of days. The corresponding average is small (), with variability brightness temperatures close to equipartition. The relatively low values for 3C 120 are consistent with its classification as a radio galaxy. In comparison, BL Lac objects and quasars have median values of (Lähteenmäki & Valtaoja, 1999).
The timescale for the fastest flare (at 22 and 37 GHz) in each of the 85 sources in the sample of Valtaoja et al. (1999) and Lähteenmäki & Valtaoja (1999) has a median of 60 days for high polarization quasars (HPQs), 90 days for BL Lac objects and days for low polarization quasars (LPQs) and radio galaxies. Only 3 out of 85 have a timescale less than 20 days and an additional 5 have a timescale less than 30 days. These are all HPQs and BL Lac objects. It’s even rarer for a source to change its behavior so suddenly and dramatically–there seem to be no other cases at 37 GHz where a source exhibiting average timescale flares for many years would suddenly flare up extremely fast (A. Lähteenmäki, private communication). The 2003.7 radio flare of 3C 120 is very unusual in this respect. The short timescale of the flare indicates an origin in a very compact region ( cm pc ).
The 2003.7 radio flare is comparable in flux to the biggest flare observed by Marscher et al. (2002). That 1998 flare was preceded by an X-ray dip. New RXTE observations show that there was an X-ray dip at 2003.5, 47 days prior to the XMM-Newton observation, and 54 days prior to the start of the 37 GHz flare (Marscher et al., 2004). The mean delay between the X-ray minima and the ejection of VLBI components is days, for the first 4 dips observed. If the 2003.7 flare follows a similar component ejection (which remains to be seen), then we expect that the ejection date preceded the 37 GHz flare by about 17 days.
RXTE monitoring data is available for the years 1997-2000, and 2002-2004 (Marscher et al., 2004). The Galactic absorption-corrected RXTE 2-10 keV flux for 2003.65 was erg s-1 cm-2, compared to a mean of erg s-1 cm-2 from EPIC PN on the following day. The RXTE flux was 20% greater, consistent with the decreasing flux during the XMM-Newton observation. The RXTE 2.4-20 keV spectral index was , 0.1 dex harder than the EPIC PN 2-10 keV spectral index. The X-ray spectral index during the XMM-Newton observation is relatively hard, but not as hard as the value for the 2003.5 X-ray minimum observed by Marscher et al. (2004). In any case, it appears that 3C 120 was in a fairly normal X-ray state, post dip and perhaps coincident with an ongoing 250 GHz flare.
7 Conclusions
The X-ray spectrum of 3C 120 shows a relatively strong Fe K emission line at 6.21 keV, and a weaker line at 6.74 keV which may be a blend of Fe K and Fe xxvi Ly. The Fe K line energy is consistent with low ionization Fe i-xv at a redshift of 0.033. This line is marginally broadened, with FWHM km s-1, similar to the width of the optical broad lines. The equivalent width of eV implies a cold gas covering fraction of , about 40% less than in the average Seyfert galaxy. This is consistent with the covering fraction of the neutral Compton reflector, which likely arises in the same location, far from the central black hole. The strength of the Fe K line excludes a strong beamed component from the jet in hard X-rays.
There is no indication of the relativistically broadened Fe K emission line found in ASCA data, nor do we find any relativistically broadened soft X-ray lines. As suggested by previous investigators, it is likely that the broad wing on the Fe K line was an artifact of fitting a single power-law to a continuum which is better described by a broken power-law. We estimate an upper limit of 100-200 eV for any relativistic emission from the inner accretion disk. This does not put strong constraints on accretion disk models.
The lack of relativistic emission lines is not unique to 3C 120 or radio galaxies in general. Therefore, we can not make any firm conclusions from this concerning the inner accretion disk structure of radio-loud vs. radio-quiet AGN. In fact, it appears that strong relativistic emission lines may be restricted to a subset of the class of radio-quiet narrow line Seyfert 1 galaxies (Branduardi-Raymont et al., 2001; Ogle et al., 2004). These are thought to contain low-mass, near-maximally spinning black holes, accreting at close to the Eddington rate. They also often have winds with high outflow rates. Interestingly, this indicates that the condition of high black hole spin plus high accretion rate is adverse to radio jet formation. 3C 120 appears to accrete at times the Eddington rate, so the accretion rate can not be considered particularly low or high. However, this is fairly efficient, casting doubt on models with a truncated disk and inner advectively dominated accretion flow.
During the XMM-Newton observation, the X-ray flux dropped by 15% and hardened. This is consistent with previous behavior, and indicates pivoting with a pivot energy of keV. At the same time, the UV flux dropped by 2%, in a strongly correlated fashion. This is the first time such a strong correlation has been found between UV and X-ray emission from 3C 120 at the 10-100 ks timescale. Further observations are necessary to determine if there is a lag between the UV and X-ray variations. The sign of the lag may help to distinguish between X-ray reprocessing in an accretion disk and Compton up-scattering of UV photons. The X-ray spectral hardening, correlated with the drop in UV flux, leads us to favor Compton scattering.
There is a strong soft X-ray excess which comprises nearly 40% of the X-ray flux and may indicate a second source of Comptonized emission. There is no indication that this emission comes from the relativistic jet. Extended thermal emission contributes of the total 2-12 keV X-ray flux in an archival Chandra HETGS image, and may arise from starburst regions in the disturbed spiral host galaxy. The soft excess varies together with the hard X-ray power law, indicating a close connection between the two components. We suggest that the soft excess comes from a corona above the disk while the hard power-law comes from the sub-relativistic base of the jet.
The X-ray spectrum appears to be absorbed below 0.6 keV by an intrinsic or intervening absorber with a column density of cm-2. The lack of an O i K edge from this absorber implies an oxygen abundance of the solar value. Such a high-column, low-metallicity absorber could be an intervening proto-galaxy. Alternatively, the absorber may come from material interacting with the jet. H ı 21 cm absorption studies may help to resolve this issue.
There are no absorption lines or edges from an ionized (warm) absorber. The lack of a warm X-ray absorber is consistent with a line of sight that passes close to the axis of the accretion disk and jet. The jet may clear a channel which is free of warm ionized gas. We detect a narrow O viii Ly emission line in the soft X-ray spectrum, which may be from an ionized absorber out of the line of sight. Our observations do not support a previous claim of absorption from the ionized intergalactic medium. We detect no such lines in the highest S/N X-ray spectrum to date.
We caught 3C 120 during a 37 GHz radio flare which started just 8 days after the XMM-Newton observation. The flux at 250 GHz was higher than it has ever been observed before. The flare was also unusual in having a very short rise timescale of 17 days, indicating emission from a very compact region. The radio flare was preceded 54 days by an X-ray dip observed with RXTE, and may indicate a new VLBI radio component. There is no obvious connection between the radio and X-ray emission over the 1.2 day timescale of the XMM-Newton observation. However, the X-ray dips observed with RXTE have a short duration of days, after which 3C 120 returns to a normal X-ray state. An observation of 3C 120 during one of these dips would more closely probe the connection between the X-ray spectrum and ejection of VLBI radio components. This will require vigilant monitoring and a rapid response time of day.
References
- Antonucci (1984) Antonucci, R. R. J. 1984, ApJ 278, 499
- Baars et al. (1977) Baars, J. W. M., Genzel, R., Pauliny-Toth, I. I. K., & Witzel, A. 1977, A&A, 61, 99
- Ballantyne, Ross, & Fabian (2002) Ballantyne, D. R., Ross, R. R., & Fabian, A. C. 2002, MNRAS, 332, L45
- Ballantyne et al. (2001) Ballantyne, D. R., Iwasawa, & Fabian, A. 2001, MNRAS, 323, 506
- Bar-Shalom et al. (2001) Bar-Shalom, A., Klapisch, M., & Oreg, J. 2001, J. Quant. Spectr. Radiat. Transfer, 71, 169
- Behar & Netzer (2002) Behar, E., & Netzer, H. 2002, ApJ, 570, 165
- Branduardi-Raymont et al. (2001) Branduardi-Raymont, G., Sako, M., Kahn, S., Brinkman, A. C., Kaastra, J. S., & Page, M. J. 2001, A&A, L140
- Brindle et al. (1990) Brindle, C., Hough, J. H., Bailey, J. A., Axon, D. J., Ward, M. J., Sparks, W. B., McLean, I. S. 1990, MNRAS, 244, 577
- Cardelli, Clayton, & Mathis (1989) Cardelli, J. A., Clayton, G. C., & Mathis, J. S., 1989, ApJ, 345, 245
- Däppen (2000) Däppen, W., 2000, in Allen’s Astrophysical Quantities, ed. A. N. Cox, (New York: Springer-Verlag).
- Decaux et al. (1995) Decaux, V., Beiersdorfer, P., Osterheld, A., & Chen, M. 1995, ApJ, 443.
- Dietrich et al. (2002) Dietrich, M., Hamann, F., Shields, J. C., Constantin, A., Vestergaard, M., Chaffee, F., Foltz, C. B., & Junkkarinen, V. T. 2002, ApJ, 581, 912
- Eikenberry et al. (1998) Eikenberry, S. S., Matthews, K., Morgan, E. H., Remillard, R. A., & Nelson, R. W. 1998, ApJ, 494, L61
- Elvis et al. (1989) Elvis, M., Lockman, F. J., & Wilkes, B. J. 1989 AJ, 97, 777
- Eracleous, Sambruna, & Mushotzky (2000) Eracleous, M., Sambruna, R., & Mushotzky, R. F. 2000, ApJ, 537, 654
- Falcke, Körding, & Markoff (2004) Falcke, H., Körding, E., & Markoff, S. 2004, A&A 414, 895
- Gomez et al. (2001) Gomez, J.-L., Marscher, A. P., Alberdi, A., Jorstad, S. G., & Agudo, I. 2001, ApJ, 561, L161 Science, 289, 2317
- Gomez et al. (2000) Gomez, J.-L., Marscher, A. P., Alberdi, A., Jorstad, S. G., & Garcia-Miro, C. 2000 Science, 289, 2317
- George & Fabian (1991) George, I. M., & Fabian, A. C. 1991, MNRAS 249, 352
- Grandi et al. (1997) Grandi, P. Sambruna, R. M., Maraschi, L., Matt, G., Urry, C. M., & Mushotzky, R. F. 1997, ApJ, 487, 636.
- Grandi et al. (1999) Grandi, P., Guainazii, M., Haardt, F., Maraschi, L., Massaro, E., Matt, G., Piro, L., & Urry, C. M. 1999, A&A, 343, 33
- Halpern (1985) Halpern, J. P. 1985, ApJ, 290, 130
- Harris, Mossman, & Walker (2004) Harris, D. E., Mossman, A. E., & Walker, R. C. 2004, ApJ, in press. astro-ph0407354
- Harris et al. (1999) Harris, D. E., Hjorth, J., Sadun, A. C., Silverman, J. D., & Vestergaard, M. 1999, ApJ, 518, 213
- Henke et al. (1993) Henke, B. L., Gullikson, E. M., & Davis, J. C. 1993, Atomic Data and Nuclear Data Tables, 54 no. 2, 181
- Hjorth et al. (1995) Hjorth, J., Vestergaard, M., Sørensen, A. N., & Grundahl, F. 1995, ApJ, 452, L17
- Homan et al. (2001) Homan, D. C., Ojha, R., Wardle, J. F. C, Roberts, D. H., Aller, M. F., Aller, H. D., & Hughes, P. A. 2001, ApJ, 549, 840
- Kaastra & Mewe (1993) Kaastra, J. & Mewe, R. 1993, A&AS, 97, 443
- Lähteenmäki & Valtaoja (1999) Lähteenmäki, A., & Valtaoja, E. 1999, ApJ, 521, 493
- Laor (1991) Laor, A. 1991, ApJ, 376, 90
- Lockman et al. (2002) Lockman, F. J., Murphy, E. M., Petty-Powell, S., & Urick, V. J. 2002, ApJS, 140, 331
- Lockman, Jahoda, & McCammon (1986) Lockman, F. J., Jahoda, K., & McCammmon, D. 1986, ApJ, 302, 432
- Magdziarz & Zdziarski (1995) Magdziarz, P., & Zdziarski, A. A. 1995, MNRAS, 273, 837
- Magdziarz et al. (1998) Magdziarz, P., Blaes, O. M., Zdziarski, A. A., Johnson, W. N., & Smith, D. A., MNRAS, 301, 179
- Maraschi et al. (1991) Maraschi, L., Chiapetti, L., Falomo, R., Garilli, B., Malkan, M., Tagliaferri, G., Tanzi, E. G., & Treves, A. 1991, ApJ, 368, 138
- Marscher et al. (2004) Marscher, A. P., Jorstad, S. G., Aller, M. F., McHardy, I., Balonek, J., Teräsranta, H., & Tosti, G. 2004, in X-ray Timing 2003: Rossi and Beyond, ed. P. Kaaret, F. K. Lamb, & J. H. Swank (Melville, NY: American Institute of Physics)
- Marscher et al. (2002) Marscher, A. P., Jorstad, S. G., Gomez, J.-L., Aller, M. F., Teräsranta, H., Lister, M. L., & Stirling, A. M. 2002, Nature, 417, 625
- Mason et al. (2003) Mason, K. O. et al. 2003, ApJ, 582, 95
- Mason et al. (2002) Mason, K. O. et al. 2002, ApJ, 580, L117
- Mason et al. (2001) Mason, K. O et al. 2001, A&A, 365, L36
- McKernan et al. (2003) McKernan, B., Yaqoob, T., Mushotzky, R., George, I. M., & Turner, T. J. 2003, ApJ, 598L, 83
- Merloni, Heinz, & Di Matteo (2003) Merloni, A., Heinz, S., & Di Matteo, T. 2003, MNRAS, 345, 1057
- Mirabel & Rodriguez (1998) Mirabel, I. F., & Rodriguez, I. F. 1998, Nature, 392, 673
- Mirabel & Rodriguez (1994) Mirabel, I. F., & Rodriguez, I. F. 1994, Nature, 371, 46
- Mitsuda et al. (1984) Mitsuda, K. et al. 1984, PASJ, 36, 741
- Mushotzky & Wandel (1989) Mushotzky, R. F., & Wandel, A. 1989, ApJ, 339, 674
- Nandra et al. (1997) Nandra, K., George, I. M., Mushotzky, R. F., Turner, T. J., & Yaqoob, T. 1997, ApJ, 477, 602
- Ogle et al. (2004) Ogle, P. M., Mason, K. O., Page, M. J., Salvi, N. J., Cordova, F. A., McHardy, I. M., & Priedhorsky, W. C. 2004, ApJ, 606, 151
- Osterbrock & Miller (1975) Osterbrock, D. E., & Miller, J. S. 1975, ApJ, 197, 535
- Page et al. (2001) Page, M. J. et al. 2001, A&A, L152
- Peterson et al. (1998) Peterson, B. M., Wanders, I., Bertram, R., Hunley, J. F., Pogge, R. W., & Wagner, R. M. 1998, ApJ, 501, 82
- Piccinotti et al. (1982) Piccinotti, G., Mushotzky, R. E., Bolt, E. A., Holt, S. S., Marshall, E. E., Serlemitsos, P. J., & Shafer, R. A. 1982, ApJ, 253, 485
- Readhead (1994) Readhead, A. C. S. 1994, ApJ, 426, 51
- Reynolds (1997) Reynolds, C. S. 1997, MNRAS, 286, 513
- Ross & Fabian (1993) Ross & Fabian 1993, MNRAS, 261, 74
- Rudy et al. (1983) Rudy, R. J., Schmidt, G. D., & Stockman, H. S. 1983, ApJ, 271, 59
- Salvi (2003) Salvi, N. J., 2003, PhD thesis, University of London
- Sambruna et al. (1999) Sambruna, R., Eracleous, M., & Mushotzky, R. F. 1999, ApJ, 526, 60
- Sargent (1967) Sargent, W. L. W. 1967, PASP, 79, 369
- Seielstad et al. (1979) Seielstad, G. A., Cohen, M. H., Linfield, R. P., Moffet, A. T., Romney, J. D., Schilizzi, R. T., & Shaffer, D. B. 1979, ApJ, 229, 53
- Shakura & Sunyaev (1973) Shakura, N. I., & Sunyaev, R. A. 1973, A&A, 24, 337
- Socrates et al. (2004) Socrates, A., Davis, S. W., & Blaes, O. 2004, ApJ, 601, 405
- Steppe et al. (1993) Steppe, H. et al. 1993, A&AS, 102, 611
- Tanaka et al. (1995) Tanaka, Y., Nandra, K., Fabian, A. C., Inoue, H., Otani, C., Dotani, T., Hayashida, K., Iwasawa, K., Kii, T., Kunieda, H., Makino, F., & Matsuoka, M. 1995, Nature, 375, 659
- Teräsranta et al. (1998) Teräsranta, H. et al. 1998, A&AS, 132, 305
- Titarchuk (1994) Titarchuk, L., 1994, ApJ, 434, 570
- Valtaoja et al. (1999) Valtaoja, E., Lahteenmaki, A., & Teräsranta, H. 1999, ApJS, 120, 95
- Walker et al. (2001) Walker, R. C., Benson, J. M., Unwin, S. C., Lystrup, M. B., Hunter, T. R., Pilbratt, G., & Hardee, P. E. 2001, ApJ, 556, 756.
- Wandel et al. (1999) Wandel, A., Peterson, B. M., & Malkan, M. A. 1999, ApJ, 525, 579
- Ward et al. (1988) Ward, M. J., Done, C., Fabian, A. C., Tennant, A. F., & Shafer, R. A. 1988, ApJ, 324, 767
- Watson et al. (2004) Watson, D., McBreen, B., Hanlon, L., Reeves, J. N., Smith, N., Perlman, E., Stocke, J., & Rector, T. A. 2004, A&A 418, 459
- White & Peterson (1994) White, R. J., & Peterson, B. M. 1994, PASP 106, 879
- Wilms et al. (2001) Wilms, J., Reynolds, C. S., Begelman, M. C., Reeves, J., Molendi, S., Stuabert, R., & Kendziorra, E. 2001, MNRAS, 328, L27
- Wozniak et al. (1998) Wozniak, P. R., Zdziarski, A. A., Smith, D., Madejski, G. M., & Johnson, W. N. 1998, MNRAS, 299, 449
- Yaqoob et al. (2001) Yaqoob, T., George, I. M., Nandra, K., Turner, T. J., Serlemitsos, P. J., & Mushotzky, R. F. 2001, ApJ, 546, 759.
- Zdziarski & Grandi (2001) Zdziarski, A. A., & Grandi, P. 2001, ApJ, 551, 186
- Zdziarski et al. (2003) Zdziarski, A. A., Lubinski, P., Gilfanov, M., & Revnivtsev, M., MNRAS, 342, 355.
| Waveband | (Hz) | (eV) | (W m-2) | aaFlux values corrected for Galactic absorption. (W m-2) |
|---|---|---|---|---|
| 37 GHz | 10.57 | -3.82 | -15.12 | |
| 250 GHz | 11.40 | -2.99 | -13.99 | |
| V | 14.74 | 0.35 | -13.54 | -13.15 |
| UVW1 | 15.01 | 0.63 | -13.18 | -12.44 |
| 1 keV | 17.38 | 3.00 | -13.73 | -13.55 |
| 2 keV | 17.68 | 3.30 | -13.63 | -13.60 |
| Line | (Å) | (km s-1) | FWHM(km s-1) | FaaFlux values corrected for Galactic extinction.( erg s-1 cm-2) |
|---|---|---|---|---|
| Hϵ | 3970.07 | 10 2 | ||
| Hδ(n) | 4101.73 | 13 1 | ||
| Hγ(n) | 4340.46 | 20 2 | ||
| Hγ(b1) | 4340.46 | 30 2 | ||
| He ii | 4686 | 210 170 | 6300 400 | 43 2 |
| Hβ(n) | 4861.32 | -110 20 | 1970 30 | 50 2 |
| Hβ(b1) | 4861.32 | 1070 90 | 5700 100 | 59 3 |
| Hβ(b2) | 4861.32 | 5600 300 | 13,700 600 | 76 3 |
| O III | 4959 | 17 1 | ||
| O III | 5007 | -283 7 | 560 20 | 61 2 |
| Fe vii | 5159 | -210 70 | 330 | 2.00.4 |
| He i | 5876 | 200 60 | 2700 200 | 16 1 |
| Fe vii | 6087 | 0.80.3 | ||
| O i | 6364 | -280 110 | 450 170 | 0.90.3 |
| Hα(n) | 6562.8 | 243 5 | ||
| Hα(b1) | 6562.8 | 206 5 | ||
| Hα(b2) | 6562.8 | 36 3 | ||
| S ii | 6716 | 0 | 330 40 | 3.00.3 |
| S ii | 6731 | 0 | 2.70.4 | |
| He i | 7065 | 9.60.8 | ||
| Ar iii | 7136 | -30 90 | 830 | 2.40.4 |
| He i | 8447 | 11.50.7 |