eurm10 \checkfontmsam10 \pagerange1–8
HIROCS a galaxy cluster survey at high redshifts
Abstract
Clusters of galaxies are the largest bound gravitational systems in the universe. They outline the large scale structure and thus are able to test predictions of cosmological models. Detailed studies of galaxy populations in clusters at high z offer insights into galaxy evolution as a function of look-back time. Unfortunately, large homogeneous samples of galaxy clusters only exist at redshifts 0.5. There are around 1000 candidate clusters with photometric or otherwise estimated redshifts above 0.5, but spectroscopically confirmed clusters are still scarce in this redshift regime. Some clusters with z 1 have recently been identified from X-ray surveys.
1 Survey outline
| Field name | RA (J2000) | DEC (J2000) | Size | E(BV) |
|---|---|---|---|---|
| MUNICS-S2F1 | 03h 06m 41s.0 | 00∘ 01′ 12′′ | 3 1∘ | 0.080 mag |
| COSMOS-10h | 10h 00m 28s.0 | 02∘ 12′ 21′′ | 2 1∘ | 0.018 mag |
| CADIS-16h | 16h 24m 32s.0 | 55∘ 44′ 32′′ | 3 1∘ | 0.006 mag |
| HIROCS-22h | 22h 00m 00s.0 | 02∘ 14′ 20′′ | 3 1∘ | 0.065 mag |
HIROCS ( Heidelberg InfraRed/Optical Cluster Survey) intends to homogeneously select candidate clusters with redshifts up to 1.5. Our survey is part of a large programme (MANOS MPIA for Astronomy Near-infrared Optical Surveys) exploring the evolution of galaxies. To reach out to redshifts of 1.5 we are observing in the infrared (H) supplemented by four optical (B, R, i, z) bands. HIROCS will cover 11 in four fields, three stripes with 3∘ and one with 2∘ (see Table 1). This ensures a sufficient coverage of large scale structure features in the foreseen redshift range. Furthermore, predictions for the number of galaxy clusters above unity from [Bartelmann & White (2002)] for the SDSS show that our dedicated survey area should yield a statistically significant cluster sample. They predict more than 5 clusters per with z 1.
With one exception (CADIS-16h field) we have equatorial fields with few bright stars enabling follow-up studies from both hemispheres with the VLT and the LBT (available in the course of 2004). The right ascension of the fields is distributed such that observations are possible during the whole year. Sufficiently low and uniform galactic extinction over the field area is another requirement.
The MUNICS and CADIS fields provide extensive information for fixing the selection function of the reduced HIROCS filter set. In these fields we have multi-color data sets as well as a large number of spectra for QSOs, galaxies and stars. We chose the COSMOS-10h field because the COSMOS survey will obtain high-resolution images from HST. The HIROCS-22h field is a new field.
| m | E-corr | m⋆ | obsLim | t | S/N | t/ | |
|---|---|---|---|---|---|---|---|
| BJ | 29.0 | -5.975 | 23.1 | 24.1 | 1500 | 19.0 | 6 ksec |
| RJ | 27.3 | -2.878 | 24.4 | 25.4 | 5000 | 5.3 | 20 ksec |
| i | 26.7 | -2.291 | 24.4 | 25.4 | 20 ksec | ||
| z | 25.0 | -2.480 | 22.5 | 23.5 | 6000 | 5.2 | 24 ksec |
| H | 21.2 | -1.348 | 19.9 | 20.9 | 3000 | 5.0 | 48 ksec |
Our survey aims at a limiting magnitude of L 1 for an elliptical galaxy at z 1.5 (5). Table 2 shows the limiting magnitudes and the required exposure times.
The multi-colour-classification scheme developed for the CADIS and COMBO-17 surveys ([Wolf, Meisenheimer & Röser (2001), Wolf, Meisenheimer & Röser 2001]) will classify all objects and assign photometric redshifts. However, the accuracy of the redshifts will be not as accurate though sufficient for cluster detections.
2 Cluster finding
We will employ a 3-dimensional cluster finding algorithm based on finding overdensities in position on the sky and in redshift space. According to its redshift z0 derived from the multi-colour-classification the projected Abell radius RA for each object is calculated and the number of objects Nobj within RA counted. Only objects with velocity differences below a given threshold are added to Nobj:
| (1) |
Candidate galaxy clusters are found as excess numbers in Nobj which exceed values expected for a random object distribution. From these excess numbers we define an overdensity parameter.
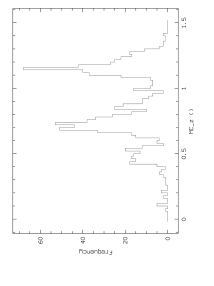
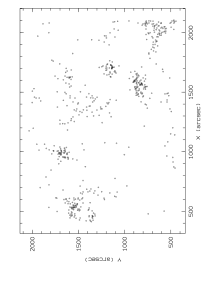
A first test application to the object catalog of the Chandra Deep-Field South (CDFS) observed by COMBO-17 (field size 31′ 30′) reveals galaxy overdensities at z 0.5, 0.7 and 1.1 (Figure 1).
In the past several other techniques for identifying clusters of galaxies have been developed. We intend to compare the performance of our algorithm with the Voronoi tessellation ([Ramella, Boschin, Fadda & Nonino (2001), Ramella, Boschin, Fadda & Nonino 2001]), the matched-filter and the friends-of-friends algorithm. Because of the imaging in five filters we will also be able to apply the red sequence approach established for the Toronto Red-sequence Cluster Survey ([Gladders & Yee (2000), Gladders & Yee 2000]) for various colour combinations.
3 Project status
Since August 2003 we are collecting the survey data at the Calar Alto 3.5 m telescope and since December 2002 with the Wide-Field-Imager (WFI) at the ESO 2.2 m telescope. A first impression of the quality of the IR data gives a pipeline-reduced mosaic of 12 H-band images in the HIROCS-22h field observed with the NIR wide-field camera OMEGA2000 on this webpage:
http://www.caha.es/newsletter/news04a/OMEGA2000mosaic.pdf
It covers almost 3/4 ; the PSF is
0.′′8. Each frame is composed of 25 single
exposures with 1 minute exposure time, the limit is 19.9 mag
(5). The holes around bright objects are due to over-corrected
background, as the pipeline, whose result is shown, uses only a local
sky determination.
References
- [Bartelmann & White (2002)] Bartelmann, M. & White, S. D. M. 2002 A&A 388, 732–740.
- [Garilli, Maccagni & Andreon (1997)] Garilli, B., Maccagni, D. & Andreon S. 1997 A&A 342, 408–416.
- [Gladders & Yee (2000)] Gladders, M. D. & Yee, H. K. C. 2000 AJ 120, 2148–2162.
- [Paolillo, Andreon, Longo, et al.(2001)] Paolillo, D. S. F., Andreon, S., Longo, G., et al. 2001 A&A 367, 59–71.
- [Poggianti (1997)] Poggianti, B. M. 1997 A&A 122, 399–407.
- [Ramella, Boschin, Fadda & Nonino (2001)] Ramella, M., Boschin, W., Fadda, D. & Nonino, M. 2001 A&A 368, 776–786.
- [Schlegel, Finkbeiner & Davis (1998)] Schlegel, D. J., Finkbeiner, D. P. & Davis, M. 1998 ApJ 500, 525S.
- [Wolf, Meisenheimer & Röser (2001)] Wolf, C., Meisenheimer, K. & Röser, H.-J. 2001 A&A 365, 660–680.