Dynamical Mass Estimates for Two Luminous Young Stellar Clusters in Messier 83 ††thanks: Based on observations collected at the European Southern Observatory, Chile under programme 71.B-0303A, and on observations obtained with the NASA/ESA Hubble Space Telescope, obtained at the Space Telescope Science Institute, which is operated by the Association of Universities for Research in Astronomy, Inc., under NASA contract NAS 5-26555
Using new data from the UVES spectrograph on the ESO Very Large Telescope and archive images from the Hubble Space Telescope, we have measured projected velocity dispersions and structural parameters for two bright young star clusters in the nearby spiral galaxy NGC~5236. One cluster is located near the nuclear starburst of NGC 5236, at a projected distance of 440 pc from the centre, while the other is located in the disk of the galaxy at a projected galactocentric distance of 2.3 kpc. We estimate virial masses for the two clusters of and and ages (from broad-band photometry) of years and years, respectively. Comparing the observed mass-to-light (M/L) ratios with simple stellar population models, we find that the data for both clusters are consistent with a Kroupa-type stellar mass function (MF). In particular, we rule out any MF with a significantly lower M/L ratio than the Kroupa MF, such as a Salpeter-like MF truncated at a mass of 1 or higher. These clusters provide a good illustration of the fact that massive, globular cluster-like objects (“super star clusters”) can form at the present epoch even in the disks of seemingly normal, undisturbed spiral galaxies.
Key Words.:
galaxies: star clusters — galaxies: spiral — galaxies: individual (NGC 5236)1 Introduction
Luminous young stellar clusters have been identified in a wide variety of external galaxies, including starburst galaxies (van den Bergh van71 (1971); O’Connell et al. oc95 (1995); Meurer et al. meu95 (1995)), dwarf irregulars (Arp & Sandage as85 (1985); Melnick et al. mel85 (1985); Billett et al. bhe02 (2002)), merger galaxies (Schweizer schweizer02 (2002); Whitmore whit03 (2003)), nuclear and circumnuclear starbursts (Harris et al. har01 (2001); Maoz et al. maoz01 (2001)) and even in the disks of some normal spirals (Larsen & Richtler lr99 (1999)). Many of these clusters are several magnitudes brighter than any young open cluster known in the Milky Way, and the inferred masses can be quite similar to those typical of the old globular clusters observed around virtually all large galaxies (). This has prompted wide-spread anticipation that observations of such clusters may provide clues to the mechanisms that led to the formation of globular clusters in the early Universe.
One question which has prompted some debate is whether or not all of these young luminous clusters will actually be able to survive for time spans comparable to a Hubble time. While there is ample evidence that at least some of them do survive for up to several Gyrs, as illustrated e.g. by the wide range of cluster ages observed in the Large Magellanic Cloud, there have been suggestions that some young clusters might have a top-heavy stellar mass function (MF). Note that we use the term ‘MF’ rather than ‘IMF’ to emphasize that we are observing a present-day mass function which may be different from the initial one. If a significant fraction of the mass is contained in relatively massive stars, the cluster might dissolve once these stars reach the endpoint of stellar evolution (Goodwin goo87 (1997)). However, the most massive young star clusters are quite rare, and therefore tend to be located at distances where direct observations of individual low-mass stars are impossible with current techniques. Thus, the MF can only be constrained by indirect means.
One way to constrain the MF of stellar clusters is to compare a dynamical estimate of the cluster mass with theoretical predictions for various MFs, based on simple stellar population (SSP) models. Dynamical mass estimates are usually obtained by measuring the projected velocity dispersion from an integrated high-dispersion spectrum of the cluster and combining this with information about the physical cluster size (typically derived from an HST image), assuming virial equilibrium. This method was first applied to clusters in NGC 1569 and NGC 1705 (Ho & Filippenko 1996a ; 1996b ), and has since been used by several other authors in attempts to constrain the MF in young clusters. The results so far, however, are far from clear. Smith & Gallagher (sg01 (2001)) found evidence for a top-heavy MF in the cluster M82-F, while Maraston et al. (mar04 (2004)) reported “excellent agreement” between the dynamical mass and SSP model estimates assuming a Salpeter MF extending down to 0.1 for the exceedingly massive cluster W3 in the merger remnant NGC 7252. For a luminous young cluster in the disk of the nearby spiral NGC 6946, Larsen et al. (laretal01 (2001)) found a M/L ratio similar to or even greater than expected for a Salpeter-type MF extending down to 0.1 . Gilbert & Graham (gg03 (2003)) found M/L ratios consistent with “normal” MFs for three clusters in NGC 1569. Other authors have found a mixture of mass-to-light ratios implying normal MFs in some cases and top-heavy MFs in others (Sternberg s98 (1998), based on a re-analysis of the data by Ho & Filippenko; Mengel et al. men03 (2003); McCrady et al. mgg03 (2003)). Evidence for a top-heavy MF has also been claimed based on Balmer line strengths measured on medium-resolution spectra for clusters in the peculiar galaxy NGC 1275 (Brodie et al. bro98 (1998)).
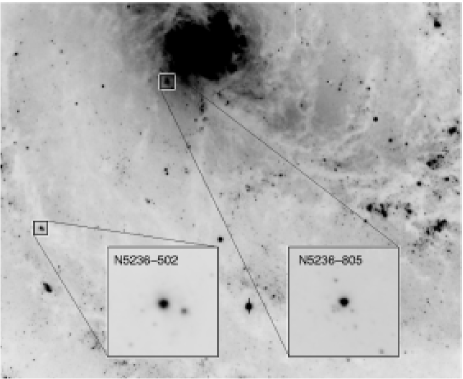
In this paper we analyse two massive young clusters in the nearby spiral galaxy NGC~5236 (M83). In our ground-based survey of young massive clusters in nearby spirals (Larsen & Richtler lr99 (1999, 2000)), NGC 5236 was noted as having a very rich population of such clusters, most likely because of its high star formation rate. For consistency with our previous work, we refer to the two clusters as N5236-502 and N5236-805. One of the clusters, N5236-805, was already noted in our ground-based data, but the other (N5236-502) was too red to pass the colour cuts and was noted during later inspection of archive images taken with the Hubble Space Telescope (HST). The two clusters both appear well resolved on HST images, so that their half-light radii can be reliably measured without being too dominated by resolution effects. We adopt a distance modulus for M83 of ( Mpc) from Thim et al. (thim03 (2003)), corresponding to a pixel scale on the WF chips of the Wide Field Planetary Camera 2 on board HST of 2.2 pc pixel-1. Thus, corrections for the WFPC2 point spread function (PSF) are still necessary, but should not constitute a major uncertainty in the size determinations. The HST images show the clusters to be reasonably isolated, so we can be confident that the velocity dispersions measured from the ground are indeed those of the target clusters themselves. For measurements of the velocity dispersions we use new data from the UVES echelle spectrograph on the ESO Very Large Telescope (Sec. 2). To determine the cluster ages we use broad-band photometry from the Danish 1.54 m telescope at ESO, La Silla, supplemented with archive imaging data from the FORS1 and FORS2 instruments on the VLT (Sec. 4). The locations of the two clusters within NGC 5236 are indicated in Fig. 1.
2 Velocity dispersions
2.1 Data
| Star | Sp type | (502) | (805) | |
|---|---|---|---|---|
| HR 4226 | M1 II | 0.47 | 0.42 | |
| HR 4279 | K1 II | 0.43 | 0.36 | |
| HR 5293 | K4 II | 0.45 | 0.40 | |
| HR 5547 | G8 II | 0.43 | 0.38 | |
| HR 5645 | K4 Ib | 0.47 | 0.42 | |
| HR 5738 | G2 II | 0.41 | 0.37 | |
| HR 6120 | G8 Ib | 0.46 | 0.41 | |
| HR 6693 | M1 Ib | 0.43 | 0.42 | |
| HR 7139 | M4 II | 0.42 | 0.43 |
| N5236-502 | N5236-805 | |||||||||
| Mean | Median | r.m.s | h | S/N | Mean | Median | r.m.s | h | S/N | |
| km/s | km/s | km/s | km/s | km/s | km/s | |||||
| UVES-B | 5.72 | 5.77 | 0.86 | 0.17 | 15 | 8.46 | 8.46 | 0.47 | 0.12 | 27 |
| UVES-RL(1) | 5.23 | 5.15 | 0.54 | 0.28 | 35 | 9.57 | 9.52 | 0.87 | 0.17 | 36 |
| UVES-RL(2) | 5.51 | 5.42 | 0.40 | 0.43 | 32 | 7.82 | 7.81 | 0.34 | 0.39 | 34 |
| UVES-RL(1,2) | 5.36 | 5.34 | 0.39 | 0.35 | - | 8.22 | 8.26 | 0.31 | 0.28 | - |
| UVES-RL(3) | 4.90 | 5.04 | 0.61 | 0.28 | 27 | 7.67 | 7.69 | 0.59 | 0.20 | 29 |
| UVES-RU | 6.33 | 6.28 | 0.81 | 0.34 | 24 | 7.90 | 7.98 | 0.82 | 0.42 | 28 |
| Mean1 | ||||||||||
| Mean2 | ||||||||||
| Adopted | ||||||||||

For the velocity dispersion measurements we obtained spectroscopic observations in service mode with the UVES echelle spectrograph on the VLT / UT2 (Kueyen) at ESO, Paranal, in March 2003. We used a slit width of , providing a spectral resolution , and a dichroic beam splitter to obtain simultaneous exposures with the blue side (3730Å– 4990Å) and red side (6600Å– 10600Å) of UVES. The UVES blue side is covered by a single CCD (UVES-B), while the red side uses a mosaic of two CCDs (UVES-RL and UVES-RU), resulting in a small gap in the wavelength coverage. In addition to the two clusters in NGC 5236, one cluster in NGC 2997 was observed, but this spectrum turned out to have too low S/N for our analysis. We also observed a number of late-type bright giants and supergiant template stars, listed in Table 1. Estimates of the absolute magnitudes are listed for each star, based on the apparent magnitudes in the Bright Star Catalogue (Hoffleit & Jaschek hoff91 (1991)) and Hipparcos parallaxes (Perryman et al. per97 (1997)), assuming zero reddening towards these stars. While a parallax is available for only one luminosity class Ib star (HR 6120), it is curious that this star appears to be no more luminous than the luminosity class II stars in the table. Part of the reason may be that the relative uncertainties on the parallaxes are substantial, as reflected in the large uncertainties on the values. Another factor may be our neglect of reddening. The Bright Star Catalogue lists a colour of = 1.48 for HR 6120, while G8 supergiants have an intrinsic (e.g. Schmidt-Kaler sk82 (1982)). This suggests a foreground reddening of or mag. The Galactic extinction maps of Schlegel et al. (sch98 (1998)) indicate an extinction of mag in the direction of HR 6120, which may be considered an upper limit to the extinction between us and the star itself but is again consistent with mag towards HR 6120.
The total exposure time for N5236-502 was 11680 s (195 min), divided into 4 separate integrations. For N5236-805, the exposure time was 7500 s (125 min), divided into 3 integrations. The initial reductions were done with the standard UVES pipeline which bias-subtracts and flatfields the data, extracts the spectra, performs wavelength- and flux calibration and merges the echelle orders to a single spectrum for each CCD. The final reduced cluster spectra were co-added, using a sigma-clipping algorithm to remove any remaining cosmic ray hits. Typical S/N values for the co-added spectra were 25–35 per resolution element (Table 2).
2.2 Analysis
To measure the velocity dispersions of the clusters we employed the cross-correlation technique described by Tonry & Davis (td79 (1979)). This method has previously been used in several other studies of young clusters, including Ho & Filippenko (1996a ; 1996b ) and Larsen et al. (laretal01 (2001)). For the cross-correlation we used the FXCOR task in the RV package in IRAF111IRAF is distributed by the National Optical Astronomical Observatories, which are operated by the Association of Universities for Research in Astronomy, Inc. under contract with the National Science Foundation. Although the UVES pipeline produces flux-calibrated spectra, the signature of the individual echelle orders was still clearly visible. To prevent these variations from producing spurious features in the cross-correlation function (CCF), we fitted a high-order spline to the continuum level and filtered out low spatial frequencies with a ramp filter before the cross-correlation analysis.
Figure 2 illustrates the basic idea behind our implementation of the cross-correlation method: first, the cluster spectrum is cross-correlated with the spectrum of a suitable template star. The full-width-at-half-maximum (FWHM) of the peak of the resulting CCF is related to the broadening of the spectral lines, here assumed to be due to the motions of the stars within the cluster. The relation between the FWHM of the CCF peak and the velocity dispersion is established by broadening another template star spectrum with Gaussians corresponding to different velocity dispersions, and cross-correlating the broadened spectra with the first template. This method assumes that the projected velocity distributions are indeed Gaussian, which is expected to be a good approximation for relaxed clusters with isotropic velocity distributions (King king65 (1965)). In Fig. 2, the solid curve shows the CCF for cluster N5236-502 vs. the template star HR 4226. The three dashed curves show the CCFs for the spectrum of another template star, HR 5645, broadened by 0 km/s (i.e. no broadening), 4 km/s and 8 km/s, vs. HR 4226. From this example, the cluster appears to have a velocity dispersion greater than 4 km/s, but less than 8 km/s. An important feature of the cross-correlation technique is that the velocity dispersion of the science object is measured relative to a template. Therefore, resolution effects and any intrinsic broadening of the lines (e.g. due to macroturbulent motions in the template star atmosphere) will cancel out, as long as these effects are reproducible. Also, because only the width of the CCF peak is used in the derivation of velocity dispersions, addition of a smooth continuum to the spectra (e.g. from early-type stars in the clusters) will not affect the measurements.
The amplitudes of the cross-correlation peaks are listed in Table 1 for each template vs. the two clusters, cross-correlating over the wavelength range 7310Å–7570Å (UVES-RL(2), see below). The template star spectra were broadened with a series of Gaussians with dispersions separated by steps of 1 km/s. Except for the three G-type supergiants (see below), we used all combinations of the template stars in Table 1 to produce estimates of the velocity dispersions. For each combination of template stars, the velocity dispersions of the cluster spectra were determined by interpolation between the dispersions of the two best-matching broadened template spectra. Including the three G-type stars in the cross-correlation analysis significantly increased the scatter, and since the cross-correlation signal also tends to be weaker than average for these stars we have excluded them from the template sample. Presumably the poorer match by the G stars indicates that the cluster spectra are indeed dominated by later-type stars.
The mean and median values of the velocity dispersions derived for all combinations of template stars are listed in Table 2, along with the dispersions of the measurements, the mean peak values of the CCFs () and the S/N of the cluster spectra. The analysis was carried out for several different wavelength ranges: 4520–4850 Å (UVES-B), 6770–6850 Å and 6940–7110 Å (UVES-RL(1)), 7310–7570 Å (UVES-RL(2)), 7710–8070 Å (UVES-RL(3)) and 8680–8880Å (UVES-RU). In the UVES-RL(1,2) entry, the regions covered by UVES-RL(1) and UVES-RL(2) were both included at the same time in the cross-correlation analysis. The choice of these wavelength ranges was dictated partly by the need for adequate S/N (on the blue side) and partly by the requirement to avoid spectral regions that are strongly affected by night sky lines and atmospheric absorption bands (on the red side). While the UVES blue spectra extend well shortwards of 4500Å, the contribution of red supergiants to the integrated light drops off rapidly at shorter wavelengths. We made some crude estimates of the relative contributions of cool and hot stars at various wavelengths using Girardi et al. (gir2000 (2000)) isochrones. The exact ratio is very sensitive to the age (and also quite model-dependent), especially for N5236-805, but if we define as the relative fraction of the total luminosity contributed by stars with K, then we find that this ratio decreases from % in the -band to % in , 5%–10% in the -band, and % in at an age of about years. Note, however, that the cross-correlation analysis does not rely on any individual strong lines, but instead utilizes the numerous weaker lines present in the spectra of red supergiants.
2.3 Uncertainties
It is gratifying to see that the cross-correlation technique produces fairly consistent results in the different wavelength ranges, with a scatter of less than 10% between the different measurements. Even the UVES-B setting produces consistent results, although the cross-correlation signal here is weak. Furthermore, the scatter of the individual measurements within one wavelength range is always less than 1 km/s, suggesting that the choice of template star is not critical. This is an important point, because the turbulent velocities in the atmospheres of bright red giants and supergiants are comparable ( 10 km/s) to the velocity dispersions we are trying to measure here (Smith & Dominy sd79 (1979); Gray & Toner gt87 (1987)). The small scatter in the velocity dispersion measurements suggests that the intrinsic scatter in the macroturbulent velocities among the template stars must be relatively small as well ( km/s). Still, the macroturbulence is an important source of uncertainty to keep in mind, and it cannot be excluded that the red supergiants in the clusters have systematically different properties in this respect than the local Galactic stars used as templates. If this is the case, our velocity dispersion measurements might be biased in either direction. For N5236-502, this concern is compounded by the fact that the velocity dispersion for this cluster is uncomfortably close to the intrinsic broadening of the lines in the supergiant stars. For N5236-805 there is another problem, namely, that the low age makes it hard to find suitable template stars. Stellar isochrones from Girardi et al. (gir2000 (2000)) predict that the red supergiants have at log(age)7.1, much brighter than any of the templates in Table 1. To test whether any strong dependence on the template star luminosity class exists, we repeated the analysis for the luminosity class Ib and II templates separately and found that the results agreed within 0.1–0.2 km/s, well within the random uncertainty of the measurements. We note, however, that a similar analysis of Keck/HIRES spectroscopy of four massive clusters studied by Larsen, Brodie & Hunter (lbh04 (2004)) yielded a somewhat greater difference of km/s between velocity dispersions derived from luminosity class Ia/Ib and II template stars, with Ia/Ib templates yielding lower velocity dispersions. That paper also includes a more detailed analysis of the dependence of the derived velocity dispersion on the template star properties, including spectral type and luminosity class. If there is a general trend for the macroturbulent velocities to increase with luminosity then we could have overestimated the velocity dispersion (and, consequently, the mass-to-light ratio) for N5236-805. A more detailed investigation of this issue would clearly be of great value.
As our final estimates of the line-of-sight velocity dispersions we adopted a weighted average of the mean values in each wavelength range. We calculated two weighted averages for each cluster, one using the r.m.s. dispersion within each wavelength range for the weights, and another one using the mean amplitude of the cross-correlation peak. The result did not depend strongly on the choice of weighting scheme and we simply adopted the mean of the two weighted averages. For the error estimates, we adopted the larger of the estimated standard errors on the weighted averages. The final adopted line-of-sight velocity dispersions are km/s for N5236-502 and km/s for N5236-805.
3 Structural parameters
| N5236-502 | N5236-805 | |
| King models () | ||
| FWHM | - | |
| - | ||
| - | ||
| King models () | ||
| FWHM | ||
| EFF models () | ||
| FWHM | - | |
| Slope parameter | - | 1.32 |
| (= ) | ||
| (= ) | ||
| EFF models () | ||
| FWHM | ||
| Slope parameter | 1.14 | 1.28 |
| (= ) | ||
| (= ) | ||
| Adopted | ||
Structural parameters for the clusters were measured on HST images obtained under programmes 5971 (for N5236-502) and 8234 (for N5236-814). The data were downloaded from the archive at STScI and processed on-the-fly by the standard pipeline. The individual exposures were then combined with the CRREJ task in the STSDAS package in IRAF. For programme 5971, four exposures in F814W ( and two exposures in F606W (1100 s 1200 s) were available, but the central pixels of N5236-502 were saturated on all but the short (1000 s) F814W exposures, so these were the only exposures used for the analysis of structural parameters for this cluster. The dataset for programme 8234 consisted of 3 exposures in F547M ( s) and 3 exposures in F814W ( s), allowing us to carry out separate analyses in the two bands. Both clusters are imaged on the WF chips of their respective HST datasets.
Interestingly, the HST and VLT images reveal a smaller companion cluster, separated by from N5236-502, which is only hinted at in the images from the Danish 1.54 m telescope as a slight elongation of the cluster image. The companion cluster is clearly resolved on the HST images. The projected separation between the two clusters corresponds to only 26 pc, so they might constitute a real physical pair. From photometry in an pixels aperture on the HST images we find a magnitude difference between the two clusters of = 1.34 mag and = 1.62 mag. Thus, the smaller cluster appears somewhat bluer, although the magnitude difference in F606W may be slightly underestimated due to the saturation of the brighter cluster. If the clusters are a physical pair, the colour difference might be due to differences in the reddenings towards the clusters, which is not too unlikely considering that their position coincides with a conspicuous dust lane (Fig. 1). Below we estimate an age for N5236-502 of about 100 Myr (Section 4), so the clusters probably did not form out of material associated with this dust lane.
At the adopted distance of M83, the image scale of the WF chips corresponds to 2.17 pc pixel-1. This is comparable to the typical half-light radii of stellar clusters, so a correction for the WFPC2 point spread function (PSF) is necessary. We used the ISHAPE code (Larsen lar99 (1999)) to fit analytic King (king62 (1962)) models and “EFF” (Elson et al. eff87 (1987)) profiles of the form
| (1) |
to the images. ISHAPE determines the best fitting shape parameters by iteratively convolving the analytic model with the PSF, adjusting the FWHM and envelope slope parameter (or concentration parameter = in the case of King models) until the best fit to the observed cluster images are obtained. The PSF was modelled using version 6.1 of the TinyTim code (Krist & Hook kh97 (1997)) and the fits were carried out using a fitting radius of (30 pixels). Integration of Eq. (1) yields the following expression for the half-light or effective radius, , of the EFF models:
| (2) |
for a profile extending to infinity and with , and
| (3) |
for a profile truncated at an outer radius . For values significantly greater than 1, does not depend strongly on the adopted , but this convenient behaviour breaks down as approaches or even decreases below unity.
The results of the profile fits are listed in Table 3. The ISHAPE code does not provide formal error estimates on the fitted parameters, and many of the uncertainties are likely to be systematic rather than random. An estimate of the reproducibility of the results can be obtained by repeating the fits several times with different initial guesses for the fit parameters and for different fitting radii. Such an exercise shows that the FWHM generally reproduces within 0.1 pixel (001) and the EFF parameter is stable within a few percent. The King profile concentration parameter is uncertain by at least 20%. In the case of N5236-502, the King and EFF fits agree reasonably well on the FWHM ( and ), corresponding to 3.0 and 3.7 pc. The King fits yield an effective radius of (7.8 pc) with a formal uncertainty of about (1 pc), mostly due to the error on the concentration parameter. For the EFF fits, the effective radius is sensitive to the adopted outer radius of the cluster because the slope is only slightly greater than 1. If we adopt the same (3″) used for the fit itself, the resulting . For and , Eq. (3) yields and . In the extreme case of a profile extending to infinity, Eq. (2) yields an effective radius of . For a smaller fitting radius of the FWHM increases slightly (FWHM), balanced by an increase in () and leading to a slight net decrease (by about relative to the fits within ) in . For N5236-805, the envelope slope is steeper and is therefore less model-dependent. The fits all agree on an effective radius close to . Thus, we adopt (7.6 pc) and (2.8 pc) for N5236-502 and N5236-805 with uncertainties of (1.1 pc) and (0.4 pc). Interestingly, the cluster near the centre of NGC 5236 is much more compact than the one located further out.
4 Photometry and cluster ages
| Cluster | R.A. | Decl. | (HST) | ||||
|---|---|---|---|---|---|---|---|
| 2000.0 | |||||||
| N5236-502 | 13:37:06.12 | 29:53:18.4 | |||||
| N5236-502 (VLT/FORS) | |||||||
| N5236-805 | 13:37:01.82 | 29:52:13.1 | |||||
| N5236-502 | N5236-805 | |||
| Log(age) | Log(age) | |||
| S-sequence | 7.99 | 0.71 | 7.42 | 0.24 |
| 7.90 | 1.31 | 6.80 | 0.20 | |
| 8.06 | 1.02 | 7.16 | 1.00 | |
| 8.01 | 1.13 | 7.10 | 0.56 | |
| 8.11 | 0.86 | 6.82 | 1.07 | |
| 7.86 | 1.42 | 7.12 | 1.41 | |
| 8.06 | 0.78 | 6.66 | 1.55 | |
| Adopted | ||||


Age estimates were obtained from colours. Table 4 lists the integrated magnitudes and , and colours for each cluster, corrected for a Galactic foreground extinction of mag (Schlegel et al. sch98 (1998), provided by the NASA/IPAC Extragalactic Database (NED)). For both clusters, we obtained photometry from images taken with the Danish 1.54 meter telescope at ESO, La Silla, using an pixels () aperture (see Larsen lar99 (1999) for details concerning the photometric calibration). In addition to the data from the Danish telescope, we also list photometry for N5236-502 from VLT FORS1/FORS2 commissioning data (Comerón com01 (2001)). These data have the advantage of much better seeing ( rather than ), but lack an adequate photometric calibration. Therefore, the FORS data were tied to the photometric zero-points of the Danish 1.54 m data using a number of isolated stars outside the main body of NGC 5236. The better seeing in the FORS images allows a more local measurement of the sky background and a smaller aperture radius (4 pixels = ) for the cluster photometry, reducing possible systematic effects on the colours from the nearby companion cluster. Unfortunately, N5236-805 is saturated in the FORS images, so for this cluster we only have the Danish 1.54 m data to rely on. Both the Danish 1.54 m dataset and the FORS1/FORS2 data include H imaging, from which it is clear that neither cluster has any line emission associated with it.
Table 4 also includes estimates of the magnitudes from the HST photometry, obtained in an aperture and using the zero-points in the WFPC2 instrument handbook (Biretta et al. bir96 (1996)). While the central pixels are saturated for N5236-502, these contain only a small fraction of the total flux, and the fact that the 1000 s F814W exposures do not reach saturation furthermore suggests that the F606W exposures (of comparable length) are not strongly saturated. Overall, the magnitudes from different sources agree within 0.1-0.2 mag, which probably provides a better estimate of the true uncertainty due to the background determination, aperture size etc, than the formal errors due to photon statistics. It should be noted that our errors on the HST photometry do not include uncertainties on the photometric zero-points, which may be as large as mag according to the WFPC2 instrument handbook. For the remainder of this paper, we adopt the HST values for the total magnitudes of both clusters, the VLT FORS1/FORS2 colours for N5236-502 and the colours from the Danish 1.54 m data for N5236-805.
In Figure 3 we show the photometry for the two clusters in a (, ) two-colour diagram, together with the “S”-sequence defined by Girardi et al. (gir95 (1995)). The S-sequence is basically the mean locus of LMC clusters in the (, ) plane, and defines an age sequence. The tick marks along the sequence indicate the optimal direction in which to shift clusters onto the sequence, considering reddening effects as well as stochastic colour variations. While the S-sequence has certain limitations, such as being defined only for LMC metallicity and restricted to the two-colour plane, some rough estimates of the ages and reddenings of the two clusters can be drawn already from a visual inspection of Fig. 3. The logarithm of the ages of N5236-502 and N5236-805 appear to be about 7.4 (25 Myr) and 8.0 (100 Myr), respectively. For N5236-805, only a small shift is required to bring the cluster on the S-sequence, suggesting a small reddening correction, while a larger shift is necessary for N5236-502. The formal S-sequence age- and reddening estimates for the two clusters are listed in Table 5.
In order to utilize the full information contained in the photometry and assess the possible role of metallicity differences, we must rely on model calculations for the evolution of broad-band colours as a function of age. In Figs. 4 and 5 we compare Bruzual & Charlot (2000; priv. comm.) model calculations for three different metallicities (, and ) with the observed colours of the two clusters. In each figure, the horizontal solid lines indicate the observed , and colours (corrected for foreground reddening only), while the horizontal dashed lines indicate the effect of an additional internal reddening in NGC 5236 of mag. For each metallicity, Table 5 lists the best-fit ages and internal values obtained by minimizing the r.m.s. difference between the model and observed colours, using both the full set of , as well as just . For N5236-502, the comparison with model colours yields ages that are quite similar to those obtained via the S-sequence method, albeit with somewhat higher reddening estimates. In the case of N5236-805 there are more pronounced differences, and from Fig. 5 it is clear that the models are very metallicity-sensitive in the age range around the best-fit value ( years) for this cluster. In particular, the “red loop” in the broad-band colours around years is smoothed over in the S-sequence. Thus, the age- and reddening estimates are more uncertain for this cluster, although the absence of line emission associated with the cluster argues against an age of much less than years.
5 Modelling mass-to-light ratios

The Bruzual & Charlot models tabulate mass-to-light ratios in different passbands for various stellar MFs. However, in order to have the freedom to explore the effects of varying the MF and compare results for different stellar models, we calculated our own M/L ratios using isochrones from both the Padua group (Girardi et al. gir2000 (2000) and references therein) and the Geneva group (Lejeune & Schaerer ls01 (2001)). In Fig. 6 we compare various calculations of the magnitude per solar mass for these simple stellar population models. As a reference, the solid line shows the Bruzual & Charlot SSP models (which are based on Padua stellar models) for a Salpeter (salp55 (1955)) MF in the mass range 0.1–100 and solar metallicity. The dotted-dashed line shows our calculations for a Salpeter MF with a minimum mass , also based on Padua isochrones. The overall agreement between our calculations and the Bruzual & Charlot models is quite satisfactory and certainly adequate for our purpose. The minor differences may well be due to different treatment of stellar remnants (we do not count any mass above the endpoint of stellar evolution at a given age). The short-dashed and dotted lines both show results for a Kroupa (kroupa02 (2002)) MF with , but for Padua and Geneva isochrones, respectively. The triple-dotted-dashed and long-dashed lines represent Salpeter MFs (based on Padua models) with lower cut-offs at 1 and . For the youngest ages (log(age)7.2) there are substantial differences between the Padua and Geneva models, but otherwise the main difference between the various curves lies in the MF choice.
6 Results
| N5236-502 | N5236-805 | |
|---|---|---|
| Log (age) | ||
| (Kroupa) [] | ||
| (Salp) [] | ||
| [pc] | ||
| [mag arcsec-2] | ||
| [ pc-3] | ||
| [] | ||
| (Kroupa) | ||
| (Salp) |
From application of the virial theorem, the velocity dispersion , total mass and half-mass radius of a star cluster are related as
| (4) |
(Spitzer spit87 (1987), p. 11–12). The 3-dimensional half-mass radius is related to the observed half-light radius roughly as , and with the line-of-sight velocity dispersion given as we can express Eq. (4) in terms of observable quantities:
| (5) |
The exact value of the constant in front of Eq. (4) depends on the detailed radial profile of the cluster, but the value 0.4 should be accurate to 10% or better for most relevant cases (Spitzer spit87 (1987)). We denote the mass derived from Eq. (5) to distinguish it from a “photometric” mass estimate (), based on SSP models. The above relations are valid for spherically symmetric clusters with an isotropic velocity distribution, which are in virial equilibrium. Another implicit assumption is that the cluster light is a good tracer of the underlying mass distribution.
With these above caveats in mind, Table 6 compares the virial mass estimates (from Eq. 5) with photometric masses for the two clusters. The photometric mass estimates are based on Padua isochrones and are calculated both for Kroupa and Salpeter () MFs. The uncertainties on the photometric mass estimates are based on the estimated uncertainties on the age (affecting the M/L ratio) and on the reddening (affecting ). These uncertainties are treated as uncorrelated although this is, strictly speaking, not true. Errors on the virial masses are based on the error estimates for the velocity dispersion in Table 2 and on the sizes. The uncertainty on the distance to NGC 5236 has not been included in the error budget, but the comparison of photometric and virial mass estimates is not very sensitive to the exact distance (M/L ratios scale linearly with distance). The estimated mag error on the distance modulus quoted by Thim et al. (thim03 (2003)) corresponds to an uncertainty of about 7% on the ratio of . For reference, we also list the central -band surface brightness () and the estimated core density for each cluster, using the analytic expressions relating these quantities to the mass-to-light ratios and sizes, luminosities and slope parameters of the EFF profiles given in Larsen, Brodie & Hunter (lbh04 (2004)).
For N5236-502, the agreement between photometric and virial mass estimates is remarkably good. The virial mass estimate falls between the Kroupa and Salpeter photometric mass estimates, but is compatible with both within the errors. In Fig. 6, the cluster actually falls right on top of the Kroupa curve calculated for Geneva isochrones. An MF with a significant deficiency of low-mass stars, such as a Salpeter MF truncated at , can be ruled out. For N5236-805 the difference between the Kroupa and virial masses is somewhat larger than for N5236-502. The virial mass is, in fact, somewhat greater than expected for a Kroupa MF, implying an excess of low-mass stars if the numbers are taken at face value. The photometric mass estimates are less secure for this cluster, however, mainly due to the uncertainties in the stellar models around this age, and the inherent uncertainties in the age- and reddening determination due to the irregular behaviour of the colours and the strong metallicity dependence, even if the models were perfect. Again, a Salpeter MF with a cut-off at 1 can be safely ruled out. The assumption of virial equilibrium may also be less secure for this cluster, due to its young age. We may also have underestimated our errors on the velocity dispersion, cluster size, or both. In conclusion, there is probably no significant discrepancy between the virial mass estimate for N5236-805 and the assumption that the mass distribution of the cluster member stars follows a Kroupa MF.
How reliable are the velocity dispersions derived from integrated spectroscopy of the clusters? One concern is that the velocity dispersions might be affected by small number statistics, i.e. the integrated light might be dominated by a few luminous supergiants. To address this question, we carried out Monte-Carlo simulations of the colour-magnitude diagrams of the two clusters, drawing stellar masses at random from a Kroupa MF until the total masses equaled the virial mass estimates in Table 6. For each “star” in these synthetic clusters, we then looked up the corresponding colour and luminosity in the Padua isochrones. For N5236-502 and N5236-805, we estimate a total of 550 and about 100 red supergiants, respectively. The smaller number of red supergiants in N5236-805 is mostly due to its younger age and correspondingly higher main-sequence turn-off mass (about 13 vs. 5 ). Thus, we do not expect the velocity dispersions or other integrated properties of the clusters to be severely affected by small number statistics.
7 Conclusions
We have measured velocity dispersions, structural parameters and broad-band colours for two stellar clusters in the nearby spiral NGC 5236 (M83). Using these data, we have compared photometric mass estimates, based on Padua stellar isochrones and various assumptions about the stellar mass function (MF), with virial mass estimates for the two clusters. We conclude that the observed mass-to-light ratios are consistent with a Kroupa-type MF, and we can rule out an MF with a significant deficiency of low-mass stars relative to the Kroupa MF. We derive virial mass estimates of (N5236-502) and (N5236-805), comparable to or even somewhat higher than the typical masses of old globular clusters. The velocity dispersions of these clusters (5.5 km/s and 8.1 km/s) are probably close to the limit at which it becomes impractical to measure them from integrated light. For even lower velocity dispersions, systematic uncertainties due to variations in the turbulent velocities of the red supergiant stars, mass segregation, and other factors, will pose a formidable challenge.
While one of the clusters is located near the nucleus of NGC 5236 and may disrupt on relatively short timescales, the other is located in the disk of the galaxy at a projected galactocentric distance of , corresponding to 2.3 kpc, and has an estimated age of about 100 Myrs. The masses of these clusters are comparable to those of the luminous young clusters (sometimes referred to as “super star clusters”) encountered in merger galaxies and starbursts, but they are much higher than that of any young open cluster observed in the Milky Way today. These clusters provide a striking example of the fact that such clusters can still form in the disks of some apparently normal, undisturbed spiral galaxies.
Acknowledgements.
We thank F. Comerón for supplying us with his reduced FORS1/FORS2 imaging data, and the anonymous referee for a number of useful comments. This research has made use of the NASA/IPAC Extragalactic Database (NED) which is operated by the Jet Propulsion Laboratory, California Institute of Technology, under contract with the National Aeronautics and Space Administration. T. R. gratefully acknowledges support from the Chilean Center for Astrophysics FONDAP No. 15010003.References
- (1) Arp, H. & Sandage, A. 1985, AJ, 90, 1163
- (2) Billett, O. H., Hunter, D. A., & Elmegreen, B. G. 2002, AJ, 123, 1454
- (3) Biretta, J. A., et al. 1996, WFPC2 Instrument Handbook, Version 4.0 (Baltimore: STScI)l, Copyright (c) 1996 by STScI
- (4) Brodie, J. P. et al. 1998, AJ, 116, 691
- (5) Comerón, F., 2001, A&A, 365, 417
- (6) Elson, R. A. W., Fall, S. M. & Freeman, K. C. 1987, ApJ, 323, 54
- (7) Gilbert, A. M. & Graham, J. R. 2003, in: Extragalactic Globular Clusters and their Host galaxies, 25th meeting of the IAU, Joint Discussion 06.
- (8) Girardi L., Chiosi C., Bertelli G., Bressan A., 1995, A&A, 298, 87
- (9) Girardi, L., Bressan, A., Bertelli, G., Chiosi, C. 2000, A&AS, 141, 371
- (10) Goodwin, S. P., 1997, MNRAS, 286, 669
- (11) Gray, D. F. & Toner, C. G. 1987, ApJ, 322, 360
- (12) Harris, J., Calzetti, D., Gallagher, J. S. III, Conselice, C. J., Smith, D. A. 2001, AJ, 122, 3046
- (13) Ho, L. C. & Filippenko, A. V. 1996a, ApJ, 466, L83
- (14) Ho, L. C. & Filippenko, A. V. 1996b, ApJ, 472, 600
- (15) Hoffleit, D., & Jaschek, C., 1991, Bright Star Catalogue, 5th rev. ed., New Haven, Conn.: Yale University Observatory
- (16) King, I. R. 1962, AJ, 67, 471
- (17) King, I. R. 1965, AJ, 70, 376
- (18) Krist, J., and Hook, R. 1997, “The Tiny Tim User’s Guide”, STScI
- (19) Kroupa, P. 2002, Science, 295, 82
- (20) Larsen, S. S. 1999, A&AS, 139, 393 (Paper II)
- (21) Larsen, S. S. & Richtler, T. 1999, A&A, 345, 59 (Paper I)
- (22) Larsen, S. S., Brodie, J. P., Elmegreen, B. G., Efremov, Yu. N., Hodge, P. W. and Richtler, T., 2001, ApJ, 556, 801
- (23) Larsen, S. S., Brodie, J. P., & Hunter, D. A., 2004, AJ, in press
- (24) Larsen, S. S. & Richtler, T. 2000, A&A, 354, 836 (Paper III)
- (25) Lejeune, T., & Schaerer, D. 2001, A&A, 366, 538
- (26) Maoz, D., Barth, A. J., Ho, L. C., Sternberg, A., Filippenko, A. V. 2001, AJ, 121, 3048
- (27) Maraston, C., Bastian, N., Saglia, R. P., Kissler-Patig, M., Schweizer, F., & Goudfrooij, P., 2004, A&A, 416, 467
- (28) McCrady, N., Gilbert, A. M., Graham, J. R. 2003, ApJ, 596, 240
- (29) Melnick, J., Terlevich, R. & Eggleton, P. P. 1985, MNRAS, 216, 255
- (30) Mengel, S., Lehnert, M. D., Niranjan, T., Genzel, R., Vacca, W. D. 2003, in: Extragalactic Globular Clusters and their Host galaxies, 25th meeting of the IAU, Joint Discussion 06.
- (31) Meurer, G. R., Heckman, T. M., Leitherer, C., Kinney, A., Robert, C., Garnett, D. R. 1995, AJ, 110, 2665
- (32) O’Connell, R. W., Gallagher, J. S. III., Hunter, D. A., Colley, W. C. 1995, ApJ, 446, L1
- (33) Perryman, M. A. C., Lindegren, L., Lovalevsky, J., Høg, E., Bastian, U., et al., 1997, A&A, 323, L49
- (34) Salpeter, E. E. 1955, ApJ, 121, 161
- (35) Schlegel, D. J., Finkbeiner, D. P., and Davis, M. 1998, ApJ, 500, 525
- (36) Schmidt-Kaler, Th. 1982, in: Landolt-Börnstein Numerical Data and Functional Relationships in Science and Technology, ed. in chief K.-H. Hellwege, vol. 2, Springer-Verlag Berlin - Heidelberg - New York 1982
- (37) Schweizer, F. 2002, in: Extragalactic Star Clusters, eds. D. Geisler, E. K. Grebel & D. Minniti, IAU Symp. 207, ASP, p. 630
- (38) Smith, L. J., Gallagher, J. S. 2001, MNRAS, 326, 1027
- (39) Smith, M. A. & Dominy, J. F. 1979, ApJ, 231, 477
- (40) Spitzer, L., 1987, Dynamical Evolution of Globular Clusters, Princeton Series in Astrophysics, Princeton University Press
- (41) Sternberg, A. 1998, ApJ, 506, 721
- (42) Thim, F., Tammann, G. A., Saha, A., Dolphin, A., Sandage, A., Tolstoy, E., and Labhardt, L. 2003, ApJ, 590, 256
- (43) Tonry, J., Davis, M. 1979, AJ, 84, 1511
- (44) van den Bergh, S. 1971, A&A, 12, 474
- (45) Whitmore, B. C., 2003, in: STScI Symposium Series 14, editor: M. Livio (astro-ph/0012546)