Radial Gas Flows in Colliding Galaxies: Connecting Simulations and Observations
Abstract
We investigate the detailed response of gas to the formation of transient and long-lived dynamical structures induced in the early stages of a disk-disk collision, and identify observational signatures of radial gas inflow through a detailed examination of the collision simulation of an equal mass bulge dominated galaxy. Our analysis and discussion mainly focuses around the evolution of the diffuse and dense gas in the early stages of the collision, when the two disks are interacting but have not yet merged. Stars respond to the tidal interaction by forming both transient arms and long lived bars, but the gas response is more transient, flowing directly toward the central regions within about years after the initial collision. The rate of inflow declines when more than half of the total gas supply reaches the inner few kpc, where the gas forms a dense nuclear ring inside the stellar bar. The average gas inflow rate to the central 1.8 kpc is yr-1 with a peak rate of yr-1. Gas with high volume density is found in the inner parts of the post-collision disks at size scales close to the spatial resolution of the simulations, and this may be a direct result of shocks traced by the discontinuity in the gas velocity field. The evolution of gas in a bulgeless progenitor galaxy is also discussed, and a possible link to the “chain galaxy” population observed at high redshifts is inferred. The evolution of the structural parameters such as asymmetry and concentration of both stars and gas are studied in detail. Further, a new structure parameter (the compactness parameter ) that traces the evolution of the size scale of the gas relative to the stellar disk is introduced, and this may be a useful tracer to determine the merger chronology of colliding systems. Non-circular gas kinematics driven by the perturbation of the non-axisymmetric structure can produce distinct emission features in the ”forbidden velocity quadrants” of the position-velocity diagram (PVD). The dynamical mass calculated using the rotation curve derived from fitting the emission envelope of the PVD can determine the true mass to within 20% to 40%. The evolution of the molecular fraction () is a potential tracer to quantitatively assign the age of the interaction, but the application to real systems may require additional observational diagnostics to properly assess the exact chronology of the merger evolution.
1 Introduction
Collisionally-induced radial inflow of gas is one of the primary mechanisms that forces significant amount of gas to the central kpc of galaxies. Such inward streaming in gas-rich progenitor galaxies can trigger the onset of intense nuclear bursts of star formation, resulting in systems large in infrared luminosity (i.e. ULIRGs; Sanders & Mirabel, 1996; Genzel & Cesarsky, 2000), or supply the fuel for central AGN activity (Kennicutt & Keel, 1984), or possibly both. Recent high resolution imaging by space-borne observatories found that the majority of the ULIRGs display highly disturbed optical and infrared morphology that signify recent or ongoing strong tidal activity (Farrah et al., 2001; Bushouse et al., 2002). While some of the ULIRGs are believed to be in the intermediate stages of merging based on their projected nuclear separation (some as large as 20 kpc), the majority are in a more advanced stage similar to the prototypical nearby ULIRG Arp 220, where the projected nuclear separation of kpc is found from high resolution radio synthesis images (Sakamoto et al., 1999a). Such merger events are important not only to understand the underlying physics that governs galaxy dynamics in the local universe, but are also key events in the formation and evolution of galaxies in the early universe, where the mean distance between galaxies was much smaller at present. Based on a number of observational similarities, these local ULIRGs are now commonly invoked as the closest analogs of high redshift sub-mm sources (Blain et al., 2002).
It is widely believed that the perturbation of the stellar mode (i.e. bars and arms) is the key mechanism in initiating the massive radial gas inflow. Disk instability in isolated systems (Kalnajs, 1971, 1972; Miller, 1978; Combes & Sanders, 1981; Sellwood, 1981; Weinberg, 1985) and forced perturbation in colliding systems (Barnes & Hernquist, 1996; Mihos & Hernquist, 1996, MH96 hereafter) are mostly responsible for the growth of non-axisymmetric modes. To complement the theory, statistical evidence suggests a higher fraction ( 50%) of barred galaxies among interacting systems than among isolated spirals (Elmegreen et al., 1990). There is also evidence of enhanced fraction of barred galaxies in the central region of the Coma cluster, where tidal influences are more effective than in the outskirts of the cluster (Thompson, 1981). Results from steady-state hydrodynamical simulations in such barred potentials emphasize the importance of the orbital resonance (Inner/Outer Lindblad Resonance:ILR/OLR) in promoting both central gas inflow (e.g. Athanassoula, 1992b; Sellwood & Wilkinson, 1993; Byrd et al., 1994) and radial outflow (Buta & Combes, 1996). These results further argue that the crossing of the orthogonal orbits ( & orbits according to the nomenclature of Contopoulos & Papayannopoulos (1980)) is the main mechanism that forces dissipation of energy.
Some of the early numerical studies of colliding systems demonstrate the importance of forced perturbation that can disturb the stellar disk with enough amplitude to initiate the radial inflow (e.g. Noguchi, 1988). In more recent studies, development of the bar-like potential and resulting inflow of more than half of the gas into the central few hundred parsecs of the merger remnant has been demonstrated (Barnes & Hernquist, 1996, MH96). MH96 found in their investigation that major merger events trigger violent central streaming of gas followed by significant starburst activity, the intensity of which could account for the infrared luminosity of the UILRGs. They found, by isolating the torque imposed on the infalling gas particles, that the primary mechanism responsible for the radial gas inflow is torque induced primarily from the stars in the host galaxy. They allude to the importance of hydrodynamical processes in initiating this gas inflow, but did not explore the evolution of the gas distribution on small scales in any detail. In addition, MH96 found that the detailed dynamical structure such as the presence/absence of a dense stellar bulge can strongly influence the intensity and the triggering of the star formation activity. For progenitor galaxies with central bulge support, mild star formation activity occurs continuously shortly after the initial contact, while the final merger of the nuclei is characterized by a more vigorous and acute star formation activity. On the other hand, moderate degree of star formation activity occurs for over a longer time period ( years) in the initial stages of the bulgeless galaxy encounter. Much of the gas in the central region of the bulgeless galaxies is depleted and converted into stars before the final merger. In both cases, a total of nearly of the initial gas has been converted to stars (modeled using a density-dependent Schmidt law) throughout the entire merger sequence. Finally, they investigated the effects of varying encounter geometry and concluded that the dependence on the orbital parameters is less significant than the non-axisymmetric response of the host galaxy (i.e. bars and arms) in initiating the inflow activity.
Because the main intent of the paper by MH96 was to investigate the development of gas inflow and the degree of starbursts that follow, a detailed analysis of the morphological and dynamical evolution of the stars and gas with each colliding disks were not discussed. Furthermore, self consistent analysis of numerical models can offer valuable insight to the observational interpretation of the distribution and kinematics of the ISM in colliding disk systems. Therefore, to further understand and extend the numerical analysis that were beyond the scope in their original analysis in MH96, and to develop a set of analysis tools to help understand the observational data better, a thorough reanalysis of their numerical experiment in MH96 is conducted. Some of the analysis include for example; (1) the detailed response of the gas under a varying stellar potential, (2) the characteristics of the inflow and its consequences, (3) the sensitivity of the gas response to the underlying stellar structure, (4) the evolution of observable parameters such as asymmetry and concentration, (5) the observational interpretation of the inflow, and (6) the determination of the interaction chronology of merging pairs of galaxies through the use of observable parameters. Because the intent of this study is to characterize the development of axi-symmetric structure in stars and the subsequent inflow activity in gas, the analysis will focus on the disk evolution mostly up to the pre-coalescence phase when the disks are interacting but have not yet merged. It will be shown that the resulting inflow period lasts for years (compare with the merger time scale of to years), suggesting that of randomly selected observed pairs of interacting galaxies may show evidence of such radial inflow. In paper II, the observational tools developed here will be tested toward H I and CO (1–0) observations of 10 early stage interacting systems, and paper III discusses the results from a detailed comparison with a control sample that includes isolated galaxies from the BIMA SONG survey (Helfer et al., 2003).
The numerical model and the units adopted are briefly summarized in §2. Detailed analysis of the gas response to the stellar features, the inflow mechanism, mass inflow rate, structural evolution of gas, and some discussion on the role of shocks can be found in §3 and §4. In §5, the observational implication from the gas kinematics is discussed, and the possible use of molecular fraction () is demonstrated in an attempt to infer the merger chronology in §6.
2 Numerical Model
The adopted TREESPH technique (Hernquist & Katz, 1989) is a hybrid between an n-body evolution code developed by arranging the particles in an oct-tree structure (Barnes & Hut, 1986), and the smoothed particle hydrodynamics (SPH) method that allows a gird-free computation of the evolution of the gas and its properties (Lucy, 1977; Gingold & Monaghan, 1977). The initial distribution of the progenitor galaxies are completely identical, but differs in their geometry of the orbits; disk 1 is placed in a prograde geometry whereas disk 2 is highly inclined with respect to the orbital plane. The galaxies are equal in mass, constructed with a stellar and gaseous disk, a stellar bulge with a bulge-to-disk mass ratio of 1/3, and a dark halo (MH96). Each SPH particle has two mass components; the total mass which is used to calculate the gravitational evolution, and the gas mass which is used to calculate the hydrodynamical forces and the associated properties of the gas (Mihos & Hernquist, 1994). The rate of conversion from gas to stars is determined by the smoothed local gas density, where the hybrid SPH particle is converted to a young star when the gas mass fraction falls below 5% of the total (Mihos & Hernquist, 1994). The ISM is modeled with an isothermal equation of state which fixes the gas temperature at K, despite the evidence that the real ISM harbors gas in multiple temperature (McKee & Ostriker, 1977). Such isothermal treatment is often justified by the short cooling time compared to the time resolution adopted for the simulations. Even in simulations that explicitly calculate heating and cooling above and below K, the shock heated gas immediately radiates away its energy resulting in most of the gas staying near the adopted value of K since the cooling curve plummets below this temperature (Hernquist, 1989; Barnes & Hernquist, 1991; Mihos & Hernquist, 1996; Barnes, 2001). If the simulation allowed cooling below K, clumps of high density gas clouds could form, which might represent clusters of active star formation in real systems. The isothermal approximation can yield incorrect results if the goal is to study the detailed kinematics of the ISM at less then the kpc scale (Barnes, 2001). However, since our aim is to characterize the large scale gas streaming motion at scales comparable to or larger than a kpc, the less computationally expensive, isothermal simulation should serve our purpose.
MH96 studied 8 independent simulation results that are different in the disk structure and the orbital geometry of the encounter. The four different orbital geometries include; prograde-inclined, prograde-prograde, prograde-retrograde, and inclined-inclined. For each encounter geometry, two different types of initial conditions were adopted for the disk density structure, one of which has a bulge component dominating the central potential (bulge dominated galaxy) and the other without the central support (bulgeless galaxy), comprising a total of eight different models. The most realistic case in the local universe – the encounter of two bulge dominated galaxies on prograde-inclined orbit – is mainly examined throughout this study. Some quantitative analysis of the experiments using bulgeless models are also discussed, where such a scenario may be more representative of the early universe if the progenitor galaxies were more disk-dominated.
Unless otherwise noted, all simulation units are scaled to those of the Milky Way galaxy, which gives unit length of 3.5 kpc, unit mass of M⊙, unit velocity of 262 km/s, and unit time of years (MH96). The time step used in the simulation is years. The above normalization scales each of the equal mass gas particles to M⊙, mass comparable to a typical GMC in the Milky Way galaxy. Since the main intent is to study the dynamical evolution of the disks after the initial collision, the pericentric passage is defined as and time advances forward thereafter, while the epoch before the collision is represented by negative time. The above normalization and all references to physical scales should be treated as illustrative because the derived physical properties could vary according to the initial conditions of the host galaxies. For instance, the characteristic size and the extent of the bar length is sensitive to the orbital properties and the bulge-to-disk ratio of the host galaxy (Combes & Elmegreen, 1993). Thus, in what follows, the physical units are used only to offer a sense of the size and time scales in a sensible and convenient manner.
3 Results
3.1 Formation and Evolution of the Stellar Structures and the Associated Gas Response
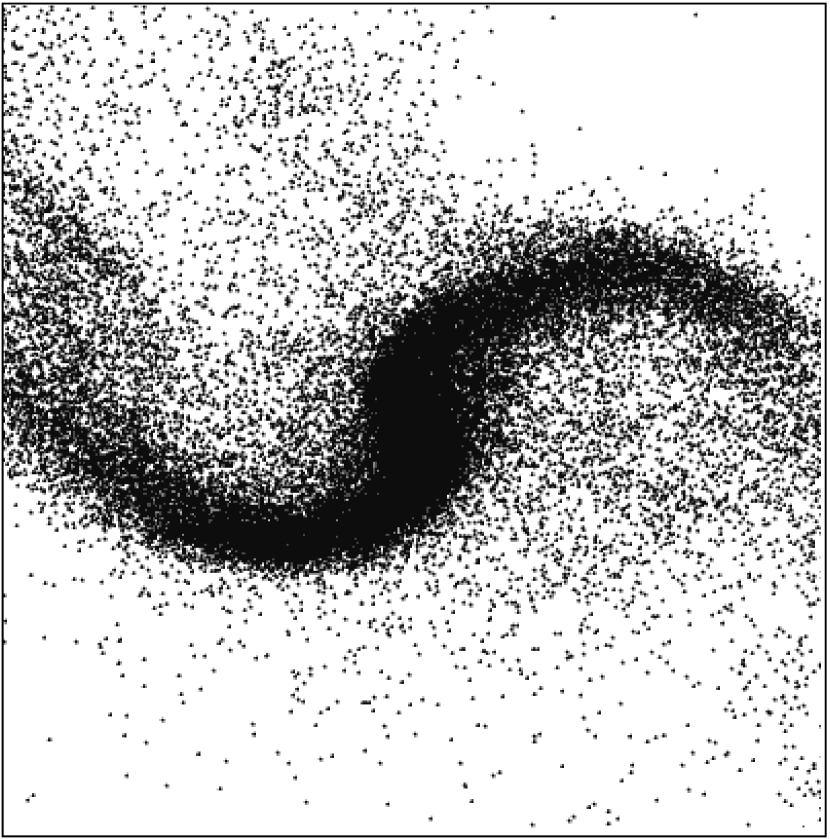
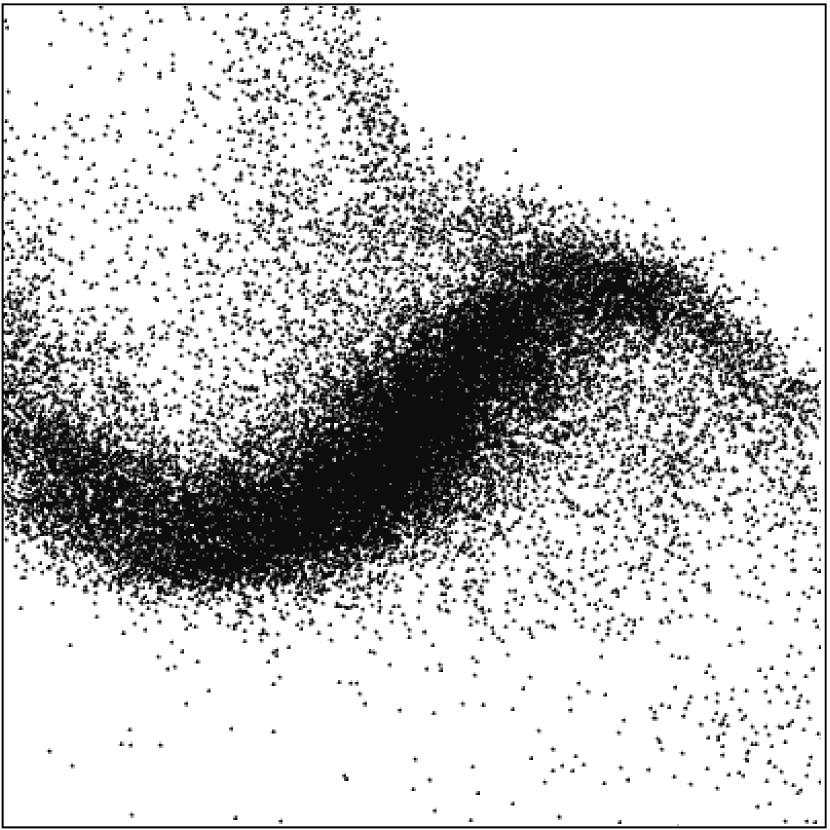
The merger sequence is presented in Figure 1 along with a side-by-side comparison of stars and gas in each disk viewed face-on. Each SPH particle is smoothed by its individual smoothing length in order to display the gas as a continuous distribution, and the overlaid contours represent the logarithmic density distribution of stars. Similar but more detailed evolution of the gas in disk 1 is presented in Figure 2. Here, the distribution of gas is color coded according to the smoothed local volume density, where blue, green, yellow, and red each represent densities above = 0.1, 1, 10 and cm-3 averaged over their smoothing lengths respectively. Also plotted in the upper left side of each panel is the approximate orientation of the major-axis of the stellar bar. Only the evolution of disk 1 is presented here – the distribution of gas in the inner regions of disk 2 undergoes a similar evolution to that in disk 1 (despite the different mass evolution seen in the outer disk due to the difference in the encounter geometry; see §3.4). The local gas density governs the length of a typical smoothing length that ranges from 50 pc to 5 kpc; a difference of two orders of magnitude between the high density nuclear gas and the more diffuse gas populating the outskirts of the galaxy. Since the vertical disk scale hight ( pc) is comparable to or less than the SPH smoothing lengths, structure in the vertical direction is often unresolved (Barnes, 2002). Therefore, only the snapshots of the inner disk are provided in order to study the detailed structure of gas resolved with at least a few hundred parsec scale. Inspection of the merger sequence in Figure 1 & 2 reveals striking difference in both the stellar and gaseous morphology before and after the collision, and presents several distinct features; (1) growth of the large scale stellar features, (2) subsequent gas response and (3) the formation of the nuclear gas ring. Some of the key features seen in each evolutionary stages shown in Figure 1 & 2 are discussed in the following subsections.
3.1.1 Pre-Collision Disks ( years)
During the initial stages of the encounter, the stellar disks generally maintain their initial distribution because the tidal influence from the companion galaxy is negligible at this time. On the other hand, gas particles in both disks develop similar transient spiral structure as seen in Figure 1 and 2. Such phenomenon – swing amplification of particle noise – is often observed in n-body simulations with limited particle resolution, where gas is more susceptible than stars to such disk instability because of its dissipative nature (Barnes & Hernquist, 1996).
3.1.2 The Massive Inflow Period ( to years)
The distribution of gas (see §3.4) shows significant evolution during the first years after the collision when the strong collisional perturbation at the pericentric passage ( kpc) give rise to the excitation of the stellar bar and the tidal arms ( modes). Tidal forces from the companion galaxy are responsible for the perturbation of the non-axisymmetric features (Toomre & Toomre, 1972). The growth of the stellar modes forces rapid accumulation of gas into stellar arms that subsequently forms highly shocked, dense filaments whose dissipational nature allows rapid radial streaming of large quantities of disk gas. The massive inflow continues for years until substantial amount of gas supply in the periphery of the disks has either funneled to the nuclear region or has been radially ejected into tidal tails. Unlike the stellar arms which disperse within a few bar rotation period, the induced stellar bar persists ubiquitously until the final coalescence, with a rotation period roughly twice the time it takes for the massive inflow to slow down (i.e. years).
Comparing the modeled inflow timescale ( years) with the total merger timescale ( years) suggest that 10 - 20% of randomly selected strongly interacting/merging sytems in the local universe might exhibit observable signature of radial inflow. This number is based on the assumption that any observed sample of interacting systems are comprised of systems which bear a resemblance to the simulations, i.e., involve comparable mass galaxies experiencing a close interaction, are past first pericentric passage, and are made of galaxies which are structurally similar to the simulated progenitors. Variation in these properties will likely modify the true fraction of galaxies with signature of inflow to some degree. This hypothesis will be tested in paper II by observing atomic and molecular gas in ten interacting systems in the local universe.
A Fourier modal analysis allows a quantitative way to assess the strength and duration of the excitation of the modes. In order to trace the modes forming inside and outside the radial extent of the stellar bar, all of the star (including the disk and the bulge) and gas particles are divided into equally spaced azimuthal bins with radius restricted from kpc and kpc. The results for kpc are shown in Figure 3 for disk 1 () and disk 2 (), displaying here up to the dipole component. Similarly, the results for kpc are shown in Figure 4. In general, the evolution of all modes are similar between disk 1 and disk 2, but subtle differences arise due to the transient nature of the modes in gas (see below). The initial jump in the mode in stars is attributed to the immediate formation of the central bar whose ends are attached with the arms that are out of phase by . This is more evident in kpc (Figure 3) than in kpc (Figure 4) because the latter is inside the edge of the stellar bar and the bulge dominates the dynamics in the inner disk. At the same time, the gas shows a stronger transient signal as it immediately responds to the formation of the stellar structure. The stronger signal in gas arises in part due to the highly concentrated nature of gas, but also due to the fact that the stellar calculation involves both the disk and (less responsive) bulge stars. While the stellar bar dominates and maintains a strong signal in kpc after the massive inflow period and until coalescence (t years), the behavior of gas during this period is highly transient and it is dominated by the distribution of gas at the central kpc scale. Therefore, the evolution of and in gas are quite similar after t years regardless of the radius (i.e the evolution of and in gas in Figure 3 and Figure 4 are similar after t years).
Spikes in the gaseous mode reach amplitudes slightly smaller than that seen in the mode, but the transient nature of the mode during (t years) and after (t years) the massive inflow period is evident. The stochastic nature of the occurrence of the mode seen in simulations has an important observational consequence. Recent, detailed investigation of the nuclear molecular gas in a few nearby galaxies with high spatial resolution has revealed a distribution of molecular gas that is lopsided toward one side of the galaxy (García-Burillo et al., 2003; Combes et al., 2004). A natural explanation is to assume a possible role of an perturbation that forces direct central transportation of gas which may eventually become the source of the fuel for the central AGN (Combes, 2003). However, since the simulation results imply that the mode is highly transient and could occur anytime throughout the entire merger timescale, persistent central fueling through the mode seems unlikely. This interpretation is not limited to major interacting systems as perturbation of a bar could occur intrinsically or from a minor perturbation such as a satellite companion.
The evolution of the gas velocity field during the massive inflow period is presented in Figure 5. The 2-armed feature in the first panel () clearly illustrates the immediate response of the gas particles to the presence of similar stellar features. The gas particles that are presently unaffected by the arm potential will be captured by the highly shocked, dense filament within a rotation period ( years). Much of the gas particles in the following snapshot ( years) are captured and trapped in the arm potential, while some of the particles are able to stream through the spiral arm which results in substantial energy loss. At years, most of the outer region is void of gas particles except for the few particles which have streamed through the spiral arm, or infalling particles from the periphery of the disk. Finally at years, an insufficient supply of gas in the outer disk decreases the rate of the massive inflow, and much of the gas has already been settled into a ring morphology in the inner kpc. Despite the large difference in the orbital geometry, the gas dynamics in the inner disk appears to be insensitive to the details of the orbital geometry as evident from the evolution of disk 2 which undergoes a similar scenario.


3.1.3 Semi-Equilibrium Stage: the Formation of a Nuclear Ring ( to coalescence)
While the large scale distribution and kinematics are dominated by the diffuse gas that continues to funnel toward the centers of the galaxies, the decreased rate of inflow marks the end of the massive inflow period in the ring dominated inner disk. The nuclear gas ring is commonly observed in central regions of barred galaxies (Buta & Combes, 1996) and its origin is often attributed to the presence of a resonance that introduces a set of orthogonal periodic orbits that govern the kinematics inside the bar. The orthogonal orientation of the ring with respect to the bar resembles orbital structure similar to the orbits, which indicates the existence of the ILR (Sellwood & Wilkinson, 1993). However, since detailed orbital analysis is beyond the scope of the current study, only the morphological evidence suggest the existence of such resonance. As the disks evolve further, gas particles in the ring continuously dissipate energy allowing some of the gas particles to stream further inward. The resulting morphology resembles a gas bar near the final stages of the merger before the two nuclei coalesce.
3.2 The Properties of the High Density Gas


Molecular gas and dust are often used as tracers of shocks. High resolution molecular gas observations of nearby galaxies often reveal a coexistence of dust and molecular gas which occurs most commonly at the leading edge of the bar (e.g. Jogee et al., 2002). In contrast, the limitation in the particle resolution, dynamic range and the uncertainties in the artificial viscosity makes it less trivial to identify shock regions in simulations. One way to identify shock region is to search for steep density gradients, however it is a well known problem that the smoothing nature of SPH complicates the precise characterization of gas properties when sudden changes in particle distribution occurs. An alternative way is to search for discontinuities in the velocity vectors, which is independent of the particle distribution as long as the dynamic range is sufficient near the candidate shock regions. The arm region in Figure 5 (labeled A) is a clear example showing velocity discontinuities and indicating the presence of shocked gas. During the initial stages of the inflow, these shocked regions are evident in both the tidal arms and at the two opposite edges of the forming nuclear ring where the elongated orbits tend to cross. The latter may identify the spots similar to where the bimodal molecular emission is found in isolated nearby barred galaxies (the molecular “twin peaks”, Kenney et al., 1992).
A side-by-side comparison between the stellar and the gas distribution shortly after the initial collision ( years) is shown in Figure 6. The stars form a prominent bar with a major axis of 3.5 kpc and a minor-axis of 1.2 kpc (although we again caution that the exact extent of the bar will depend sensitively on the density structure of the hopst galaxy). While the more diffuse gas (green; cm-3) outlines the inflowing gas and surrounds the nuclear region at a few kpc scale, streams of high density gas (yellow; cm-3) are also found, often corresponding to where discontinuities in the velocity field are evident. There is also evidence of very high density gas (red; cm-3) at the central region of the galaxy during the latter periods of the inflow. The mean densities of the observed galactic GMCs range from to cm-3, however inspection suggest that most of the simulated gas particles have volume densities less than cm-3 (also see Figure 2). The smoothing length is about 50 to 100 pc in the denser nuclear regions, but the radius of a typical galactic GMC is 20 pc (Scoville and Sanders, 1987). Since each SPH particle approximately represents one galactic GMC in mass, this suggests that the volume filling factor of a typical GMC enclosed in one SPH smoothing length is only a few percent. This correction allows a sensible cut at separating the SPH gas into different gas tracers according to their smoothed local density. In the remainder of this article, we define particles with or above to represent the gas dominated by dense gas, while anything below are considered to be in in the diffuse component of the ISM. Thus the denser regions (green) may represent sites of GMCs, and the highest density regions (yellow and red) may represent GMC complexes and associations. The latter are possible sites of current star formation, the intensity of which depends on the degree of shear experienced by the high density gas. On the other hand, the diffuse gas (blue) may identify the tidal tails traced observationally by atomic hydrogen emission.
3.3 The Inflow Rate
Figure 7 presents the differential evolution of the cumulative gas mass enclosed within concentric rings around the disk center. Radial and azimuthal gas compression begin to convert the higher density gas into stars, decreasing the overall gas mass slowly before the collision, while violent inflow and ejection into tidal tails rapidly changes the overall distribution of gas after pericentric passage. It is clearly seen that the stronger response in the disk is more evident in the prograde disk (disk 1), while relatively smaller mass loss is seen in the high inclination disk (disk 2). At the final stages of the massive inflow ( years), the gas in disk 2 is more abundant than in disk 1 inside a radius of 10.5 kpc ( of gas is initially distributed within this radius). The prograde geometry of disk 1 forces ejection of much of the gas (M⊙) out to the tidal tails and the bridge medium. Shortly before the coalescence, about M⊙) of the gas has returned to disk 1, but M⊙) of the ejected mass from disk 1 has been captured by disk 2, M⊙) of which is captured almost immediately ( years) after the collision. The remaining hovers around the bridge region until the final coalescence.
While the mass evolution in the outer disk strongly depends on the orbital geometry due to the presence of the spin-orbit resonance operating on the loosely bound particles, the evolution of the inner disk is less affected by the resonance and is dominated more by the density structure of the progenitor galaxy. Overall, both disks show a central inflow ( kpc) with a total gas mass of a M⊙ before the galaxies coalesce, and this behavior is independent of the orbital geometry. Figure 8 presents the evolution of the inflow/ejection rate at the inner (1.8 kpc) and outer (10.5 kpc) most radii in Figure 7 shown here for both disks. The mass inflow rate at R = 1.8 kpc shows similar evolution in both disks because the evolution of the inner disk is less sensitive to the orbital geometry, while the outer disk is more susceptible to the resonance affecting the prograde disk (disk 1) more severely. At R = 10.5 kpc, the average ejection rate is 9 and 3 M⊙/yr with a maximum found just after the initial collision at 25 and 11 M⊙/yr for disk 1 and disk 2 respectively. At R = 1.8 kpc, the average inflow rate is 7 and 8 M⊙/yr for disk 1 and disk 2, with both disks showing a maximum value of 17 M⊙/yr. These inflow rates are comparable to those derived from observations of isolated and interacting barred galaxies ( M⊙/yr; Jogee et al., 1999; Sakamoto et al., 1999b; Petitpas & Wilson, 2002), although significant uncertainties exist when trying to apply the simulation results to individual observed galaxies. Nonetheless, the large inflow rate calculated here is more than enough to initiate and sustain central starburst activity at a few M⊙/yr, but may not be high enough to account for the very high star formation rates observed in ULIRGs ( M⊙/yr) (Sanders & Mirabel, 1996).
3.4 The Bulgeless Case
MH96 demonstrated that a collision of bulgeless galaxies results in a strong stellar bar that dominates more than half of the radial extent of the entire galaxy, and produces high inflow and star formation rates shortly after the initial encounter. While galaxies with a central bulge dominate the luminous galaxy population in the nearby universe at least up to (Lilly et al., 1998), increasing number of bulgeless galaxies are suggested in the early universe (Wyse, Gilmore & Franx, 1997). Thus multiple collisions between bulgeless galaxies may be a more common phenomenon in the early universe, and may also play an important role in the early stages of galaxy formation and evolution. Figure 9 presents the density evolution of the gas disk in the bulgeless galaxy simulation similar to that in Figure 2, but shown here up to years because the inflow timescale is longer by a factor of 2. The absence of the bulge permits the growth of the stellar bar to a size of about 10 kpc, which is 3 times longer than what is formed in the bulge dominated galaxies (see the comparison in Figure 10). High density gas () is completely absent initially () in the central region. Only after years after the collision does azimuthal compression of gas raise the smoothed local densities of the gas to a higher level () in the densest regions of the bar-dominated galactic disk. The subsequent evolution of the gas is also clearly different from the bulge dominated case, forming a linear bar-like structure that allows direct central streaming along the strong stellar bar. A long strip (length kpc) of very high density gas () forms as a consequence of the gas accumulation toward the central region. Finally, the inflow of dense gas effectively declines at years. The inflow rate to the inner 1.8 kpc in the initial stages of the inflow period is much lower than the bulge dominated case (/yr for both disks), but peaks at years at 25 and 14 /yr for disk 1 and disk 2 respectively.
This result clearly demonstrates the sensitivity of the behavior of the gas to the detailed stellar structure that could profoundly change the resulting evolution of the gas and ultimately to the distribution and the intensity of the subsequent starburst activity. Some clues as to why the behavior of the gas differers dramatically between the two models may be obtained by comparing the results with the hydrodynamical simulations in a steady-state bar potential (e.g. Athanassoula, 1992a), and it appears to be intimately linked to the properties of the ILR. These models suggest that the physical properties of the bar dictates the presence/absence of the ILR; i.e. the ILR is absent when the bar has large axial ratio or low central concentration. The resulting stellar properties found in the bulgeless models fulfill these conditions at least qualitatively, but a thorough quantitative description is beyond the scope of the present paper and will not be conducted. Nevertheless, if the structural properties of the bar indeed govern the existence of the ILR and the orbital structure of the gas, the existence of the ILR (and consequently orbits) in the bulge dominated galaxies effectively prevents the gas from further reaching the very center of the galaxy, as the gas particles streaming along the nuclear ring suffers from little torque and dissipation. This may explain the less intense star formation rate seen in the bulge dominated disk encounter model at the stages following the initial collision (MH96). On the other hand, for a galaxy with no ILR, gas streams directly to the central region without interference. The sharp rise in star formation activity in the bulgeless model may be attributed to such direct central inflow.
In summary, a few markedly distinct properties are evident when a comparison between the two cases are made. First and most importantly, the inflow in the bulgeless galaxy is characterized by a direct central streaming where a linear bar-like structure dominates the distribution and the kinematics of the inflow. In contrast, the bulge dominated galaxy forms a nuclear ring that largely delays the central inflow and the subsequent star formation activity. Secondly, the gas in bulgeless galaxy seems to take slightly more time to respond, likely due to the different internal structure and dynamical timescales. The initial inflow rate is much smaller in the bulgeless galaxies which therefore results in a longer inflow timescale ( years) compared to the bulge dominated disk encounter ( years). The peak inflow rates are comparable at (15-25) . By comparing the gas morphology to the results from hydrodynamical simulations of Athanassoula (1992a), it is suggested that these two are both possibly related to the characteristics of the stellar bar, whose properties can profoundly alter the governing orbital structure of gas within the bar potential.
The linear appearance of the gas in the bulgeless galaxy is remarkably similar to that of the so called “chain galaxies” observed at high redshifts (Cowie, Hu & Songaila, 1995; Taniguchi & Shioya, 2001; Elmegreen, Elmegreen & Sheets, 2004). These are a population of galaxies that have axial ratio of (Taniguchi & Shioya, 2001), and has been speculated to be star forming galaxies at intermediate to high redshift () (Cowie, Hu & Songaila, 1995). The observational evidence of increasing number of bulgeless galaxies in the early universe, and the linear morphology of gas inflow predicted in this study offers a possible new interpretation to the origin of the “chain galaxy” phenomenon; forced radial inflow and linear star formation in bulgeless galaxies. It is possible that this proposed scenario may not necessarily require a presence of an equal mass perturber as massive bulgeless disks are unstable to bar formation intrinsically (Ostriker & Peebles, 1973; O’Neill & Dubinski, 2003), but the intrinsic perturbation will be significantly smaller and the amplitude of the resulting bar may not be as extreme. This transient phase persists for years which is much longer than the timescale for the massive UV-emitting young stars to form ( years), assuming that the gravitational collapse can withstand the immense radial shear from the inflow. In these systems, the kinematics of the gas is dominated by the inflow and any attempts to derive the rotation velocity will substantially underestimate the true rotation of the galaxy even when the galaxy is viewed edge-on. This is consistent with the finding by Bunker et al. (2000) that HDF 4-555.1 (a “chain galaxy” at z = 2.80) has a small rotation velocity ( km/s), and systematic spectroscopic surveys of the “chain galaxy” population should reveal a better picture of its origin in the future.
4 The Structural Parameters: the Asymmetry, Concentration and Compactness of Stars and Gas
The development of sensitive detectors mounted on space-borne observatories allow deep and large scale galaxy surveys whose sample size now exceeds the limit in which one can investigate each source individually. Because it is a more systematic and robust way to measure galaxy morphology, automatic classification of the optical galaxy morphology has become increasingly popular in recent years. Two structural parameters that are commonly computed are the asymmetry parameter () (Schade et al., 1995; Abraham et al., 1996; Conselice, Bershady & Jangren, 2000; Bershady, Jangren & Conselice, 2000), and the concentration index () (Morgan, 1958; Fraser, 1972; Doi, Fukugita & Okamura, 1993; Abraham et al., 1994; Graham, Trujillo & Caon, 2001; Conselice et al., 2003). The application of the structural parameters to gas morphology has not been done in the literature to date primarily because of the lack of spatial resolution that has only become readily available recently with the use of interferometric techniques. In addition, morphological classification of ISM in galaxies has not received much attention in the context of understanding galaxy formation and evolution. The observational sample presented in paper II, as well as recent CO (1–0) surveys of nearby galaxies (i.e. BIMA SONG (Helfer et al., 2003)) are obtained at high enough spatial resolution ( kpc) and S/N making such investigations feasible. In what follows, similar structural parameters, and are computed for the simulated morphology of both the stars and gas in order to form a theoretical template that will aid to understand the structural parameters derived for the observational sample in paper II. In addition, in order to better trace the relative sizes of the gaseous and stellar components of galaxies, a new parameter , the compactness parameter, is introduced.
4.1 Definition of A, C, and K Parameters
The asymmetry parameter () is defined as;
| (1) |
where, is the face-on image of stars (or gas), is rotated around the center of the galaxy (typically defined as the maxima of stellar density), and is the total integrated intensity of a single disk. Uncertainties in the centering is the dominant source of error in the asymmetry parameter, and the common approach that has been adopted in observation is to use the global minima of after iterating through each pixel in the image. This method will likely result in a rotation center that is close to the dynamical center of the disk as long as the stellar or gas distribution is azimuthally and radially near uniform. However, the true interpretation of becomes much more complex when two or more galaxies are involved in the determination of a single , and only the evolution of for a single galaxy in the pair is computed here to avoid confusion. To best represent the observational procedure in paper II in which the rotation center is defined from the peak coordinates in the relatively extinction-free K-band images, the disk potential minima is used here to define the rotation center of the galaxy. The above definition normalizes so that for complete axisymmetry and for total antisymmetry. The asymmetry parameter is computed for both the raw image whose pixel resolution is 216 pc/pixel, and the image convolved with a Gaussian beam (FWHM = 1 kpc) allowing a direct comparison to the observational sample in paper II which has a mean spatial resolution roughly 1 kpc in FWHM of the synthesized beam. This and all of the stellar structural parameters derived in the remainder of this article assumes that the mass-to-light ratio does not change across the disk.
The concentration index () is defined as the ratio between the outer and inner regions represented by the radius enclosing 20 and 80% of the total flux, or;
| (2) |
where represents the radius (i.e. where = number of pixels, = area of each pixel) enclosing 20% of the total emission from the peak, and is the same but enclosing 80% of the total emission. The concentration index is calculated for both stars and gas for comparison.
The new compactness index () quantifies the relative concentration of gas with respect to the size of the stellar disk;
| (3) |
where and represent the radius enclosing X% of the total flux of stars and gas respectively. The stellar radius () is sensitive to the the value adopted for ; shows small evolution for small X since the particles inside the tidal radius are less affected by the companion tidal force, while particle ejection into the tidal tails increases rapidly for large X (Figure 11). On the other hand, radial streaming and central condensation of the gas particles makes the gaseous radius () less sensitive to the value adopted for .
The evolution of the A, C and K parameters for gas are calculated using two different density criteria; (1) all gas particles confined within a 14 kpc radius to investigate the behavior of both the diffuse and dense gas, and (2) all gas particles above (see Figure 2; green) to trace only the denser component of the gas. Creating stellar maps with different density thresholds is more difficult to implement in a meaningful way, since it requires the use of a model for the mass-to-light ratio and particle smoothing, both of which are significantly nontrivial. As such, we only measure the quantitative morphological parameters for the stellar distribution as a whole.
4.2 The Evolution of A, C and K Parameters
The evolution of A, C and K for both stars and gas are presented in Figures 12 and 13. The stellar asymmetry () increases by a factor of two over a period of years and maintains approximately a similar amplitude until the end of the sequence presented here. The spatial smoothing results in only a modest reduction in since the local and central condensations seen in the gas are absent in collisionless stellar particles. The small dynamic range in simply reflects the intrinsic axisymmetric nature of the tidally induced features, and blindly applying this technique to examine the degree of tidal disturbance therefore can result in large uncertainties. In reality, the angular resolution and line of sight projection can largely complicate the application of this technique to a single galaxy in a pair, and a more practical way is to derive a single value of to the system as a whole, similar to what has been demonstrated in high resolution optical images of galaxies (e.g. Conselice et al., 2003). The resulting in an intermediate stage merger in this case may be sensitive to the relative stellar mass ratio of the pair assuming a constant M/L ratio, since the asymmetry is sensitive to the residual structure in the most luminous parts of the galaxies (i.e. the bulge). These results suggest the use of as a replacement for the Hubble classification scheme is somewhat technically ambiguous even when a single galaxy in a pair is tracked instead of the system as a whole. The situation only becomes worse at higher redshift when surface brightness dimming, loss of angular resolution and line of sight projection effects all play a role in further complicating the interpretation of the analysis.
The modest dynamic range seen in the evolution of the parameter for the dense gas particles further supports the idea that the use of to trace the dynamical evolution is mostly impractical. A growth in after years is seen but the increase is too small to be effectively used as part of a distinct classification scheme. In contrast to stars, the Gaussian smoothing of the gas significantly reduces the clumpiness in the distribution, reducing by about a factor of two overall. The initial value of when all of the gas particles are used is comparable to the case in which the dense gas is smoothed to a 1 kpc beam, but the evolution subsequent to the collision becomes similar to that of the unsmoothed, dense gas particles. The gas and stars both initially follow a smooth exponential radial decline, which leads to the slightly evolved progenitor disks with near azimuthal symmetry. Such an idealized scenario will inevitably result in a gas response with a strong axial symmetry since the underlying stellar disk responds to the collision with a strong perturbation, but weak in (§3.1.2). A more realistic case will involve collisions of disks where the distribution of gas is initially more clumpy and filamentary, in which case the excitation of the stellar mode may result in a gas response that largely depends on the initial distribution, suggesting that the results presented here are only lower limits. In concordance with such speculation, the initial investigation of applied to the isolated galaxies in the BIMA SONG sample (Helfer et al., 2003) yield a mean of (unsmoothed) and (smoothed to the worst resolution in the sample), and and for the colliding galaxy sample in Paper II respectively.
The evolution of is sensitive to the behavior of and since the inner region of both stars and gas ( and ) responds to the collision with significantly smaller amplitudes. Thus the ejection of the outer stars into tidal tails is directly seen as a monotonic increase of C in stars. Gas particles on the other hand exhibits a small peak shortly after the collision that is followed by an immediate drop which is simply a reflection of the behavior of gas at . This behavior is seen in the case where all of the gas particles (i.e., not just dense gas) is used, but to a smaller degree. These results suggest that is a poor tracer of structural evolution of gas during a major merger, but its application to stars alone appears to work reasonably well.
The strong sensitivity of to the amount of flux included (i.e. the value of ) illustrated the differences in how various parts of the disk evolve. The stellar disk expands rapidly and monotonically outside the tidal radius (between and ), but the evolution of the dense gas is more transient, marked by an initial increase followed by a rapid decline in both and 68 (see Figure 11). The ratio of these (), therefore, results in a slow initial evolution followed by a stronger evolution toward the latter epochs of the massive inflow period. A similar trend is seen in the case where all of the gas particles are traced, but the post-collision value of is smaller by a factor of two. One potential problem concerning the use of is when the observation is limited by angular resolution and sensitivity. A simple test using a Gaussian shows that the galaxy needs to be extended at least 8 pixels in FWHM, otherwise the ratio is overestimated by a factor of a few. Another potential problem arises when the data are not sensitive enough to detect the fainter tidal structure in stars. Thus the idealized results presented here may only provide an upper limit to since may be significantly smaller when the extended emission is not accounted for. Since further discussion depends on the quality of the actual data, these issues are further addressed in detail in the analysis of observational data in paper II.


5 Implication on the Analysis of Observational Data
The position velocity diagram (PVD) offers an efficient and powerful way for studying the disk kinematics in observations of molecular and atomic gas (e.g. Sofue Honma & Arimoto, 1995). One of the potential application of the PVD is to infer the presence of a bar in edge-on isolated galaxies by identifying anomalous non-circular motions driven by the barred potential (Athanassoula & Bureau, 1999; Bureau & Athanassoula, 1999). Therefore, the evolution and the shape of the PVD contains important diagnostic information regarding the inflow kinematics and this can further help the observational interpretation of interacting systems.
5.1 The Evolution of the PVD
The evolution of the PVD from years is presented in Figure 14. The PVD slit is aligned with the major axis of the edge-on disk, viewed from angle 1 in Figure 2. The center of the PVD is fixed at the disk potential minima, and the same spatial (220 pc) and velocity resolution (26 km/s) were chosen as before. In addition, in order to further investigate how the viewing angle affects the shape of the PVD in the initial stages of the massive inflow, an additional viewing angle from south (from viewing angle 2 in Figure 2) is adopted (Figure 15). In both viewing angles, different cutoff densities are used to study the PVD that is dominated by different component of the gas. For example, the PVD generated using all of the gas particles may represent both the diffuse and dense components of the ISM, while a cutoff density of 1.0 and 10 may filter out the diffuse component leaving only the regions dominated by the denser clouds.
The detailed structure seen in the PVD is highly dependent on the viewing angle toward the bar in the initial stages of the inflow (compare first and second row of in Figure 14); the inflow gas is characterized by distinct clumps at years (labeled A and B in Figure 6 and Figure 14), while a long and dense strip in the PVD depicts the inflow gas at years (labeled C and D in Figure 14). Toward the final stages of the inflow and near the semi-equilibrium stage, the emission morphology becomes less sensitive to the adopted viewing angle since the disk is composed of only two major components (i.e. a dense nuclear ring and diffuse extended tails). The diffuse gas in the outskirts of the galaxies (see the left column of Figure 14) shows a decline in the radial velocity along the line of sight, which is often seen observationally in extended H I disks, and is attributable to warping of the outer disk.
The dense gas forms a morphology that resembles an -shape (integral-shape) in all PVDs in Figure 14, where the upper-right/lower-left quadrant represents the redshifted/blueshifted gas along the line of sight. Careful observation of the inner PVD reveals that the -shape begins relatively flat (i.e. the flat part of the rotation begins kpc at t= years) but becomes steeper in the subsequent epochs (i.e. the flat part of the rotation rotation begins kpc at t= years) and flattens again at the final epoch of the sequence. This apparent steepening of the inner rotation is due to the changing line of sight as the galaxy rotates, and occurs when the line of sight intersects the stellar bar near end-on, where the particular orientation projects the gas particles moving closer to the nucleus and consequently faster. On the other hand, when the bar is observed near edge-on, the projected distribution of the gas with higher column density appears near the two edges of the stellar bar where the gas is moving farther from the nucleus and slower, resulting in a flatter -shape. This demonstrates one way the emission in the PVD can be used to predict the approximate line-of-sight orientation of the bar in a disk observed near edge-on (Binney et al., 1991), which is especially useful when the line of sight inclination and extinction prohibits direct identification of the bar in the optical and NIR images.
5.2 Kinematic Signatures of Gas Inflow Found in the PVD
The large scale PVD morphology of the dense gas (n) generally shows axial symmetry across the origin, while the small scale details (i.e. darker gray scale in Figure 14) often show larger asymmetries. The example shown in Figure 14 has stronger emission in the lower left quadrant along the rising part of the rotation. This indicates that the dense material is slightly lopsided toward one side of the galaxy, and that there exists a depression of nuclear gas (i.e. a central cavity) (Sakamoto et al., 1999a). Since the central cavity is a sign of the nuclear ring — which is shown in §3 to be a possible consequence of a central inflow — observational evidence of such features in the PVD is a potential signature of past or ongoing inflow. For this method to work effectively, the observational images require enough angular resolution that the nuclear structure is resolved. Figure 16 presents the PVD of UGC 12915 (the “Taffy Galaxy”)(Condon et al., 1993), demonstrating one such example where a lopsided PVD emission and the emission in the forbidden velocity quadrant (see below) both suggest that some of the gas is currently involved in an inflow.
The comparison between Figure 14 ( years) and Figure 15 presents a more dramatic difference in the morphology of the PVD and the corresponding dependence on the viewing angle. From this particular viewing angle (labeled 2), the nuclear emission is dominated by a linear feature intersecting the origin, surrounded by a large elliptical emission that mainly arises from the structure of the developing nuclear ring. The emission along any radial offset from the origin spans a large range in velocity since different velocity components from physically different parts of the inflow contributes significantly to the emission in the PVD. For example at an offset distance of +1 kpc (see Figure 15), more than half of the emission is seen in the redshifted part of the PVD (positive velocity), which is expected if the gas particles follow normal rotation. However, it is evident that a significant fraction of emission at +1 kpc populates the blueshifted half of the PVD (negative velocity) – the so-called “forbidden velocity quadrant” – because of substantial contribution from the inflow from the opposite side of the galaxy along this line of sight. The viewing angle from position 2 is one such example that shows substantial emission in the forbidden velocity quadrant, although emission in the forbidden velocity quadrant is almost always present to some degree as seen in Figure 14. This a powerful way to identify transient and anomalous kinematics in observations with adequate spatial and velocity resolution. However, the information contained in the PVD is not enough to distinguish between infall and outflow, and a robust, self-consistent interpretation requires an a priori knowledge of the dynamical state of the source.
The Taffy Galaxy is an example of two disk systems that have recently undergone a penetrating collision, evidence of which comes from the long stretching radio continuum bridges seen between the two galaxies (Condon et al., 1993, 2002). The PVD shown in Figure 16 presents substantial emission in the forbidden velocity quadrant (dotted circle) which is kinematically and spatially distinct from the rest of the galaxy. The above analysis suggests that one possible implication of such distinct emission in the forbidden velocity quadrant is inflow (or outflow) caused by the immense head-on collision that occurred years ago (Condon et al., 1993).
5.3 Rotation Curve Derived from the PVD and the Derivation of Mdyn
A well sampled rotation curve allows an indirect measurement of the mass distribution of galaxies. For example, in many rotationally supported normal spiral galaxies, the observational evidence of flat CO and H I rotation curves indicate the ubiquitous presence of massive dark matter halos (see Sofue & Rubin, 2001, for a review). Spectroscopic observations of atomic and molecular emission lines have been the most common approach to derive the rotation curves of low velocity dispersion, rotationally supported disks (Sofue & Rubin, 2001). In colliding systems, however, tidal interactions can drive strong non-circular motion in gas which can in turn significantly impact the interpretation of the observed PVD and the derivation of a rotation curve. Not all colliding systems are readily identified as such based on optical appearance alone (e.g. M81, Yun, Ho & Lo, 1994), and tidally driven non-circular motion may play an important role in many apparent isolated galaxies. Therefore, it is important to understand the accuracy, reliability and the limitation of the rotation curves derived from a simulated disk-disk collision first, in order to gain confidence in the interpretation of the observational results. Several rotation velocity fitting techniques are commonly used in the literature (see Sofue & Rubin (2001) for a review) such as the (1) terminal velocity method (Sofue, 1996), (2) fitting the lowest emission corrected by the instrumental resolution and the ISM velocity dispersion (the envelope method) (e.g. Sancisi & Allen, 1979), (3) fitting a Gaussian to the line profile, or (4) tracing the peak intensity. Line of sight projection can complicate the use of many of these methods in highly inclined galaxies (Uson & Matthews, 2003), but the peak intensity method works reasonably well for optical spectroscopic observations of low inclination galaxies with good S/N (Rubin, Ford & Thonnard, 1980; Mathewson & Ford, 1996). A Gaussian can represent the line profile in similarly low inclination galaxies, but the approximation fails again for edge-on galaxies when substantial beam smearing occurs. A commonly used technique to avoid this problem is to construct a PVD of a galaxy along the kinematic major axis, and fit the edges of the emission contours using techniques such as the terminal velocity or envelope methods. In brief, the rotation velocity from the terminal velocity method is defined as
| (4) |
where is the systemic velocity, is the velocity resolution of the data, and is the velocity dispersion of the interstellar medium. The terminal velocity, , is defined as the velocity at , where and are the peak and lowest emission respectively, and the suggested value of is used to represent the emission intensity at the 20% level (Sofue & Rubin, 2001). Experiments show that this method works well for isolated galaxies of various inclinations, except for the inner most regions of the galaxies where the angular resolution limits the goodness of the fit (Sofue, 1996). The envelope method is a less sophisticated technique, correcting only for the velocity resolution and the ISM turbulence and not weighting the peak intensity. Strictly speaking, the application of any of these methods to simulations is subject to uncertainties since the PVD in simulations can only trace the gas density and not the emission intensity. Since the emission intensity depends on the optical depth, excitation conditions, and the beam filling factor — all of which varies from one tracer to another — we assume here for simplicity that the emission intensity is proportional to the gas column density (i.e. the optically thin case). For all of the derived rotation curves in what follows, the turbulence term () is neglected for consistency since the contribution is small ( km/s) and the exact value varies from source to source.
The rotation curves during the massive inflow period are shown in Figure 17. Since the higher density gas ( cm-3) is clumpy and only abundant in the inner few kpc of the galaxy, the rotation curve fitting is done only on the first two columns of Figure 14 (“All” and cm-3). It is clear from Figure 17 that simply tracing the maximum intensity does not offer a reliable fit of the rotation curve at any epoch. The largest discrepancy is found in the outer disk because the dense gas does not fill the disk uniformly and the PVD is not fully sampled. The terminal velocity method and the maximum intensity fitting both significantly underestimate the true rotation in the outer disks. The envelope method, on the other hand, appears to offer a reasonably good fit to the true rotation curves at all scales up to 7 kpc, possibly because the envelope kinematics are dominated by the limb-brightened tangent points.

Figure 18 presents the rotation curve derived using the PVD constructed along angle 2. Since the shape of the PVDs depend strongly on viewing geometry, the resulting rotation curves also show significant variations depending on the adopted line of sight toward the inner disk. In concordance with such expectation, the envelope method now significantly overestimates the rotation in the inner few kpc, but the rotation in the outer disk is consistent with that derived along angle 1 (Figure 17). Since the inflow predominantly affects the shape of the PVD inside the effective bar potential (which occurs only in the inner few kpc), the dependence on the viewing angle effectively diminishes at large radii.


Table 1 summarizes the dynamical mass () calculated at different radii using the rotation curve derived from the terminal velocity method, and Table 2 presents the results obtained using the envelope method. Assuming a spherical mass distribution for a flattened potential introduces a % uncertainty in the computed dynamical mass (Binney & Tremaine, 1987), with the exact correction factor depending on the details of the true mass distribution. Table 1 also compares the dynamical mass with the true mass obtained directly from the simulation by summing, gas, stars, and dark matter particles enclosed in a sphere defined by . On average, the derived dynamical mass underestimates the true mass by %, and sometimes as large as 80% ( and years). The dynamical mass in the inner disk is underestimated by % even before the collision ( years) when the disk kinematics are mostly dominated by rotation and not by inflow. The results presented in Table 1 are merely a reiteration of the previous argument that the terminal velocity method often results in inaccuracies in deriving the true rotation curve. In contrast, it is readily seen that the results from the envelope method presented in Table 2 are more consistent with the true mass. A % error can easily be accounted for by the spherical mass approximation, thus the results here imply that the envelope method can predict the enclosed mass to within % of the true mass.
Significant variations in the shape of the PVD and the resulting rotation curve are seen when two viewing angles are compared. To form a complete set of systematically different viewing angles, a total of 7 rotation curves were derived by varying the viewing angle by increments azimuthally around the galaxy at years. The rotation curves presented in Figure 19 use both the terminal velocity and the envelope methods for comparison. The dotted points again represent the true rotation derived from the spherically averaged mass distribution, which in principle should reflect the average of all of the rotation curves derived from different viewing angles. Using the terminal velocity method to measure the rotation velocity in the inner few kpc works well, and the dynamical mass is determined to within 10% of the true mass. However, significant deviations from the true rotation speed are evident in the outer disk in about half of the viewing angles, underestimating the true mass by 30% on average. In contrast, the envelope method consistantly overestimates the true rotation curve and the resulting dynamical mass. Even when the tidal features dominate the outer disk, on average the envelope method appears to trace the true rotation better.
| time | () | |||
|---|---|---|---|---|
| ( yr) | R = 1.8 | R = 3.5 | R = 5.3 | R = 7.0 |
| -19 | 1.1 (-35%) | 3.0 (-22%) | 5.9 ( -5%) | 8.6 ( -2%) |
| 3.1 | 1.2 (-37%) | 2.8 (-32%) | 9.1 ( 40%) | 9.3 ( 51%) |
| 6.2 | 2.3 ( 11%) | 2.5 (-35%) | 3.9 (-31%) | 5.8 (-24%) |
| 9.3 | 2.6 ( 27%) | 0.7 (-83%) | 2.4 (-54%) | 4.1 (-40%) |
| 12 | 1.6 (-26%) | 2.9 (-25%) | 3.0 (-45%) | 1.4 (-80%) |
Note. — The percentage error from the true mass is shown in (), where a minus sign represents an underestimate from the true mass.


| time | () | |||
|---|---|---|---|---|
| ( yr) | R = 1.8 | R = 3.5 | R = 5.3 | R = 7.0 |
| -19 | 1.6 (-10%) | 3.1 (-18%) | 7.3 ( 16%) | 9.1 ( 3%) |
| 3.1 | 2.1 ( 9%) | 5.6 ( 37%) | 10.2 ( 57%) | 14.8 ( 71%) |
| 6.2 | 2.8 ( 35%) | 4.8 ( 25%) | 4.5 (-20%) | 7.2 ( -6%) |
| 9.3 | 2.8 ( 35%) | 5.6 ( 45%) | 4.7 (-14%) | 5.5 (-21%) |
| 12 | 2.5 ( 18%) | 5.0 ( 30%) | 5.4 ( -3%) | 4.0 (-41%) |
6 The use of Atomic and Molecular Observation to Determine the Merger Chronology
The optical morphology of interacting systems conveys distinctive information about the interaction history of the galaxy pairs. The shortcoming of this method is similar to the problem of classifying galaxies into Hubble types (§4) in that it is rather subjective and potentially biased, making a more robust and systematic method preferable. A possible quantitative method is to use the compactness parameter () in a statistically significant sample of colliding galaxies as a tracer of dynamical age. If Figure 13 holds true universally, later stage interactions should have higher compactness parameters. Another possible approach is to characterize the fraction of molecular gas to the total gas mass, since conversion from atomic to molecular gas (and molecular gas to stars) is expected to be more efficient in a colliding system.
The evolution of the molecular gas mass fraction () during the simulated collision is presented in Figure 20. A cutoff volume density of 1.0 cm-3 is adopted to roughly separate the gas that is dominated by atomic verses molecular gas, which gives initially. Although slightly higher, this value is consistent with the mean empirical ratio derived by Casoli et al. (1998) () using a distance-limited sample of 582 galaxies. The sharp rise in the molecular fraction occurs immediately after the collision and during the inflow period, followed by a gradual decline while the system settles to the semi-equilibrium state, as the inner nuclear gas slowly converts to stars. The molecular fraction peaks at years when the two galaxies finally coalesce, after which the molecular fraction plummets due to the strong merger-induced starburst.
6.1 Application to the Toomre Sequence
Toomre (1977) compiled a set of 11 nearby systems currently experiencing collisions or mergers, and roughly ordered them according to the completeness of the interaction purely based on optical morphology (the so called “Toomre Sequence”). The Toomre Sequence has since been studied in a number of ways including; IR (e.g. Joseph & Wright, 1985), H I (e.g. Hibbard & van Gorkom, 1996), CO (Yun & Hibbard, 2001), and numerical simulations (e.g. Barnes, 1988; Mihos, Bothun & Richstone, 1993). Recently, Laine et al. (2003) investigated the nuclear regions of the complete sample of the Toomre Sequence using both the broad-band and narrow-band filters on the HST/WFPC2. One of their main goals was to search for trends in the optical nuclear properties of the galaxies as a function of merger age. No clear trends were found; while firm conclusions were difficult to make due to the ubiquitous presence of dust in the nuclei, this result may also point towards the need for further observational diagnostics to address whether the Toomre Sequence represents the correct canonical ordering of galaxy evolution.
In order to study the gas properties along the Toomre Sequence, Table 3 shows the molecular fraction for six subsystems of the Sequence, compiled from the extant literature. In general, the data does not show an obvious trend in the molecular fraction as a function of the proposed interaction sequence. However, it may be possible to argue that the first three systems (early stage mergers) have slightly higher molecular fraction on average compared to the latter three (late stage mergers) where the coalescence may have converted much of the molecular gas to stars as was demonstrated in the simulation in Figure 20. Direct comparison between observation and simulation may prove difficult in the early stage mergers since the sharp rise in molecular fraction (i.e. the massive inflow period) only accounts for % of the total merger timescale which is then followed by a gradual decline. However, the possibility that the molecular fraction is higher in the pre-merger phase is intriguing, and a systematic survey of a larger sample should address the validity of this analysis (Paper II).

7 Summary
We revisit numerical simulation results of Mihos & Hernquist (1996) to investigate the response of gas in colliding systems and identify observational signature of inflow in the simulated data. The key results found in this study are summarized below:
-
1.
Response of the gas to the perturbation
Stars respond to the tidal interaction by forming both transient arms and long lived bars, but the gas response is more transient, flowing directly toward the central regions within years after the initial collision. The rate of inflow declines when more than half of the total gas supply reaches the inner few kpc, where the gas forms a dense nuclear ring inside the stellar bar. The orientation of the ring suggests an orbital structure similar to those identified as orbits induced by the presence of an ILR. The presence/absence of the ILR may govern the strength and duration of the star formation activity by regulating the gas inflow to the center of the galaxy as seen, for example, in the bulgeless galaxy encounter. Shocks are identified using velocity discontinuities, which often spatially coincides with the high density gas regions near the inflowing gas.
-
2.
Evolution of the structural parameters
The evolution of the asymmetry (), concentration () and the new compactness () parameters were investigated for both the stars and gas. In contrast to the concentration () and compactness () parameters which work reasonably well, the asymmetry parameter () appears to be a poor tracer of the structural evolution of both stars and gas. The strong evolution in may be used to infer the merger chronology of colliding systems and this will be further tested in paper II.
-
3.
The use of the PVD as a diagnostic tool to infer inflow
Gas in non-circular kinematics can populate the “forbidden velocity quadrant” of the PVD, most distinctively seen when the line of sight intersects the infalling gas. Three PVD fitting techniques were employed to derive the rotation curves, and the dynamical mass was estimated to test how accurately the true mass can be recovered. The results show that the dynamical mass can be determined to within % of the true mass if the envelope method is adopted.
-
4.
Merger chronology from atomic/molecular gas observations
The simulation results predict a marked increase in the molecular fraction during the massive inflow period, but the application to real systems may require additional observational constraints to properly assess the exact chronology especially in the pre-mergers. More speculatively, the spatial distribution of atomic/molecular gas can be used to convey information on the approximate merger age since the galaxies have collided for the first time. By combining molecular and atomic gas observations in tidally interacting systems, the determination of an approximate merger age may be possible. This hypothesis will be tested in our forthcoming paper (paper II).
| System | AgeaaThe interaction age assigned based on investigating the optical morphology by eye; E (early stage), I (intermediate stage), L (late stage) | |
|---|---|---|
| NGC 4038/9 b,cb,cfootnotemark: | 0.76 | E |
| NGC 4676 ddHibbard (1995) | 0.61 | E |
| NGC 6621/2 eePaper II | 0.83 | I |
| NGC 520 ddHibbard (1995) | 0.66 | IL |
| NGC 3921 ddHibbard (1995) | 0.47 | L |
| NGC 7252 ddHibbard (1995) | 0.64 | L |
References
- Abraham et al. (1996) Abraham, R. G., van den Bergh, S., Glazebrook, K., Ellis, R. S., Santiago, B. X.; Surma, P. & Griffiths, R. E. 1996, ApJS, 107,1
- Abraham et al. (1994) Abraham, R. G., Francisco, V., Yee, H. K. C. & van den Bergh, S. 1994, ApJ, 432, 75
- Athanassoula (1992a) Athanassoula, E., 1992, MNRAS, 259, 328
- Athanassoula (1992b) Athanassoula, E. 1992, MNRAS, 259, 345
- Athanassoula & Bureau (1999) Athanassoula, E. & Bureau, M. 1999, ApJ, 522, 699
- Barnes & Hut (1986) Barnes, J. & Hut, P. 1986, Nature, 324, 446
- Barnes (1988) Barnes, J. E. 1989, ApJ, 331, 699
- Barnes & Hernquist (1991) Barnes, J. E., & Hernquist, L, 1991, ApJ, 370, 65
- Barnes & Hernquist (1996) Barnes, J. E., & Hernquist, L, 1996, ApJ, 471, 115
- Barnes (2001) Barnes, J. E. 2001, in Gas and Galaxy Evolution, ed Hibbard, J. E., Rupen, M. & van Gorkom, J. H. (San Fransisco: Astronomical Society of the Pacific), p135
- Barnes (2002) Barnes, J. E. 2002, MNRAS, 333, 481
- Bershady, Jangren & Conselice (2000) Bershady, M. A., Jangren, A., Conselice, C. J. 2000, AJ, 119, 2645
- Binney & Tremaine (1987) Binney, J. & Tremaine, S. 1987, Galactic Dynamics, (Princeton:Princeton University Press)
- Binney et al. (1991) Binney, J, Gerhard, O. E., Stark, A. A., Bally, J., & Uchida, K. L. 1991, MNRAS, 252, 210
- Blain et al. (2002) Blain, A. W., Smail, I., Ivison, R. J., Kneib, J. P., & Frayer, D. T., 2002, PhR, 369, 111
- Bunker et al. (2000) Bunker, A., Spinrad, H., Stern, D., Thompson, R., Moustakas, L., Davis, M. & Dey, A. 2000, in Galaxies in the Young Universe II, ed. H. Hippelein & K. Meisenheimer (Berlin:Springer)
- Bushouse et al. (2002) Bushouse, H. A., Borne, K. D., Colina, L., Lucas, R. A., Rowan-Robinson, M., Baker, A. C., Clements, D. L., Lawrence, A., & Oliver, S. 2002, ApJ, 138, 1
- Bureau & Athanassoula (1999) Bureau, M. & Athanassoula, E. 1999, ApJ, 522, 686
- Buta & Combes (1996) Buta, R. & Combes, F. 1996, Fund. Cosmic Physics, 17, 95
- Byrd et al. (1994) Byrd, G., Rautiainen, P., Salo, H., Buta, R., & Crocker, D. A. 1994, AJ, 108, 476
- Casoli et al. (1998) Casoli, F., Sauty, S., Gerin, M., Boselli, A., Fouque, P., Braine, J., GAvazzi, G., Lequeux, J. & Dickey, J. 1998, A&A, 331, 451
- Cowie, Hu & Songaila (1995) Cowie, L. L., Hu, E., & Songaila, A. 1995, AJ, 110, 1576
- Combes & Sanders (1981) Combes, F. & Sanders, D. B. 1981, A&A, 96, 164
- Combes & Elmegreen (1993) Combes, F. & Elmegreen, B. G. 1993, A&A, 271, 391
- Combes (2003) Combes, F. 2003, in Active Galactic Nuclei: from Central Engine to Host Galaxy, ed Collin, S., Combes, F. & Sholsman, I., ASP (Astronomical Society of the Pacific), Conference Series, Vol. 290, p. 411
- Combes et al. (2004) Combes, F. et al., 2004, A&A, 414, 857
- Condon et al. (1993) Condon, J. J., Helou, G., Sanders, D. B., & Soifer, B. T. 1993, AJ, 105, 1730
- Condon et al. (2002) Condon, J. J., Helou, G., & Jarrett, T.H. 2002, AJ, 123, 1881
- Conselice et al. (2003) Conselice, C. J., Bershady, M. A., Dickinson, M. & Papovich, C. 2003, AJ, 126, 1183
- Conselice, Bershady & Jangren (2000) Conselice, C. J., Bershady, M. A. & Jangren, A. 2000, ApJ, 529, 886
- Contopoulos & Papayannopoulos (1980) Contopoulos G., & Papayannopoulos T. 1980, A&A, 92, 33
- Doi, Fukugita & Okamura (1993) Doi, M., Fukugita, M. & Okamura, S. 1993, MNRAS, 264, 832
- Downes & Solomon (1998) Downes, D, & Solomon, P. M. 1998, ApJ, 364, 615
- Elmegreen et al. (1990) Elmegreen, D. M., Elmegreen, B. G., & Bellin, A. D. 1990, ApJ, 364, 415
- Elmegreen, Elmegreen & Sheets (2004) Elmegreen, D. M., Elmegreen, B. G. & Sheets, C. M. 2004, ApJ, 603, 74
- Englmaier & Gerhard (1997) Englmaier, P. & Gerhard, O. E. 1997, MNRAS, 287, 57
- Farrah et al. (2001) Farrah, D., Rowan-Robinson, M., Oliver, S., Serjeant, S., Borne, K., Lawrence, A., Lucas, R. A., Bushouse, H. & Colina, L. 2001, MNRAS, 326, 1337
- Fraser (1972) Fraser, C. W. 1972, Observatory, 92, 51
- Gao et al. (2001) Gao, Y., Lo, K. Y., Lee, S. -W. & Lee, T. -H. 2001, ApJ, 548, 172
- García-Burillo et al. (2003) Garcia-Burillo, S. et al., 2003, A&A, 407, 485
- Genzel & Cesarsky (2000) Genzel R., & Cesarsky, C. J. 2000, ARAA, 38, 761
- Gingold & Monaghan (1977) Gingold, R. A. & Monaghan, J. J. 1977, MNRAS, 181, 375
- Graham, Trujillo & Caon (2001) Graham, A. W., Trujillo, I. & Caon, N. 2001, AJ, 122, 1707
- Helfer et al. (2003) Helfer, T. T., Thornley, M. D., Regan, M. W., Wong, T., Sheth, K., Vogel, S. N., Blitz, L & Bock, D. C.-J. 2003, ApJS, 145, 259
- Hernquist (1989) Hernquist, L. E. 1989, Nature, 340, 687
- Hernquist & Katz (1989) Hernquist, L. E., & Katz, N. S. 1989, ApJ, 70, 419
- Heyer et al. (1998) Heyer, M. H., Brunt, C., Snell, R. L., Howe, J. E. & Schloerb, F. P. 1998, ApJ, 115, 241
- Hibbard (1995) Hibbard, J. E., 1995, Ph.D. thesis, Columbia University
- Hibbard & van Gorkom (1996) Hibbard, J. E. & van Gorkom, J. H. 1996, AJ, 111, 655
- Hibbard et al. (2001) Hibbard, J. E., van der Hulst, J. M., Barnes, J. E., & Rich, R. M. 2001, AJ, 122, 2969
- Ho et al. (1997) Ho, L. C., Filippenko, A. V., & Sargent, W. L. W. 1997, ApJ, 487, 591
- Kenney et al. (1992) Kenney, J. D. P., Wilson, C., D., Scoville, N., Z., Devereux, N., A., & Young, J., S. 1992, ApJ, 395, 79L
- Kennicutt & Keel (1984) Kennicutt R. C., & Keel, W. C. 1984, ApJ, 279, 5L
- Jogee et al. (1999) Jogee, S., Kenney, J. D. P.& Smith B. J. 1999, ApJ, 526, 665
- Jogee et al. (2002) Jogee, S., Knapen, J. H., Laine, S., Shlosman, I., Scoville, N. Z., & Englmaier, P. 2002, ApJL, 570, 55
- Joseph & Wright (1985) Joseph, R. D. & Wright, G. S. 1985, MNRAS, 214, 87
- Kalnajs (1971) Kalnajs, A. J. 1971, ApJ, 166, 275
- Kalnajs (1972) Kalnajs, A. J. 1972, ApJ, 175, 63
- Koda & Wada (2002) Koda, J. & Wada, K. 2002, A&A, 396, 867
- Laine et al. (2003) Laine, S., van der Marel, R. P., Rossa, J., Boker, T., Mihos, J. C., Hibbard, J. E. & Zabludoff, A. I., 2003, AJ, 126, 2717
- Lilly et al. (1998) Lilly, S. et al. 1998, ApJ, 500, 75
- Lucy (1977) Lucy, L. B. 1977, AJ, 82, 1013
- Mathewson & Ford (1996) Mathewson, D. S. & Ford, V. L. 1996, ApJS, 107, 97
- McKee & Ostriker (1977) McKee, C. F., & Ostriker, J. P. 1977, ApJ, 218, 148
- Mihos, Bothun & Richstone (1993) Mihos, J. C., Bothun, G. D. & Richston, D. O. 1993, ApJ, 418, 82
- Mihos & Hernquist (1994) Mihos, J. C., & Hernquist, L. 1994, ApJ, 431, L9
- Mihos & Hernquist (1996) Mihos, J. C., & Hernquist, L. 1996, ApJ, 464, 641
- Miller (1978) Miller, R. H. 1978, ApJ, 223, 811
- Morgan (1958) Morgan, W. W. 1958, PASP, 70, 364
- Mulchaey et al. (1997) Mulchaey, J. S., Regan, M. W., & Kundu, A. 1997, ApJS, 110, 299
- Noguchi (1988) Noguchi, M. 1988, A&A, 203, 259
- Oka et al. (1998) Oka, T., Tetsuo, H., Fumio, S., Masato, T., & Miyazaki, A. 1998, ApJS, 118, 455
- O’Neill & Dubinski (2003) O’Neill, J. K. & Dubinski, J. 2003, MNRAS, 346, 251
- Ostriker & Peebles (1973) Ostriker, J. P., & Peebles, P. J. E. 1973, ApJ, 186, 467
- Petitpas & Wilson (2002) Petitpas, G. R., & Wilson, C. D. 2002, ApJ, 575, 814
- Regan & Teuben (2003) Regan, M. W., & Teuben, P. 2003, ApJS, 582, 723
- Rubin, Ford & Thonnard (1980) Rubin, C. V., Ford, W. K. & Thonnard, N. 1980, ApJ 238, 471
- Sanders, Solomon & Scoville (1984) Sanders, D. B., Solomon, P. M., & Scoville, N. Z. 1984, ApJ, 276, 182
- Sanders & Mirabel (1996) Sanders, D. B., & Mirabel, I. F. 1996, ARAA, 34, 749
- Sancisi & Allen (1979) Sancisi, R. & Allen, R. J. 1979, A&A, 74, 73
- Sakamoto (1996) Sakamoto, K. 1996, ApJ, 471, 173
- Sakamoto et al. (1999a) Sakamoto, K., Scoville, N. Z., Yun, M. S., Crosas, M., Genzel, R., & Tacconi, L. J. 1999, ApJ, 514, 68
- Sakamoto et al. (1999b) Sakamoto, K., Okumura, S., Ishizuki, S., & Scoville, N. Z. 1999, ApJS, 525, 691
- Schade et al. (1995) Schade, D., Lilly, S. J., Crampton, D., Hammer, F., Le Fevre, O. & Tresse, L. 1995, ApJL, 451, 1
- Scoville and Sanders (1987) Scoville, N. Z., & Sanders, D. B. 1987, in Interstellar Processes, ed Hollenbach, D. J., & Thronson, H. A. (Netherlands: Reidel), p21
- Scoville, Yun & Bryant (1997) Scoville, N. Z., Yun, M. S., & Bryant, P. M. 1997, ApJ, 484, 702
- Sellwood (1981) Sellwood, J., A. 1981, A&A, 99, 362
- Sellwood & Wilkinson (1993) Sellwood, J., A., & Wilkinson, A. 1993, RPPh, 56, 173
- Schwarz (1981) Schwarz, M. P. 1981, ApJ, 247, 77
- Sofue Honma & Arimoto (1995) Sofue, Y., Honma, M. & Arimoto, N. 1995, A&A, 296, 33
- Sofue (1996) Sofue, Y. 1996, ApJ, 458, 120
- Sofue & Rubin (2001) Sofue, Y. & Rubin, V. 2001, ARAA, 39, 137
- Tacconi et al. (1999) Tacconi, L. J., Genzel, R., Tecza, M., Gallimore, J. F., Downes, D., & Scoville, N. Z 1999, ApJ, 524, 732
- Taniguchi & Shioya (2001) Taniguchi, Y. & Shioya, Y. 2001, ApJ, 547, 146
- Toomre (1978) Toomre, A. 1978, IAUS, 79, 109
- Toomre (1977) Toomre, A. 1977, in “The Evolution of Galaxies and Stellar Populations,” ed. B. M. Tinsley & R. B. Larson (New Haven:Yale Univ.), 401
- Toomre & Toomre (1972) Toomre, A. & Toomre, J. 1972, ApJ, 178, 623
- Thompson (1981) Thompson L. A. 1981, ApJ, 244, L43
- Uson & Matthews (2003) Uson, J. M. & Matthews, L. D. 2003, AJ, 125, 2455
- Wang et al. (2001) Wang, W-H, Lo, K. Y., Gao, Yu, & Gruendl, R. A. 2001, AJ, 122, 140
- Weinberg (1985) Weinberg, M. D. 1985, MNRAS, 213, 451
- Weinberg (1998) Weinberg, M. D. 1998, MNRAS, 299, 499
- Weinberg (2001) Weinberg, M. D. 2001, MNRAS, 328, 321
- Wyse, Gilmore & Franx (1997) Wyse, R. F. G., Gilmore, G. & Franx, M. 1997, 35, 637
- Yun, Ho & Lo (1994) Yun, M. S., Ho, P. T. P. & Lo, K. Y. 1994, Nature, 372, 530
- Yun & Hibbard (2001) Yun, M. S., & Hibbard, J. E. 2001, ApJ, 550, 104