7323
A. Wolter, OAB \mailvia Brera, 28, 20121 MILANO
22institutetext: INAF/IASF, via P. Gobetti 101, 40129 Bologna
33institutetext: Center for Astrophysics, 60 Garden St., Cambridge, MASS
44institutetext: Dipartimento di Astronomia, Università di Bologna, via Ranzani 1, 40127 Bologna
X-ray properties of the “Composite” Seyfert/Star-forming galaxies
Abstract
An enigmatic, small class of IR and X-ray luminous sources, named “Composite” starburst/Seyfert galaxies, has been defined from IRAS and RASS data. The objects have optical spectra dominated by the features of HII galaxies (plus, in some cases, weak Seyfert signatures) but X-ray luminosities higher than expected from starbursts and more typical of Seyfert nuclei. The true nature of this class of objects is still unknown. We present Chandra data of four of these galaxies that were obtained to investigate the nature of the X-ray source. The X-ray spectrum, the lack of any significant extended component, and the observed variability indicate that the AGN is the dominant component in the X-ray domain.
keywords:
Galaxies: active – Galaxies: starburst – X-rays: galaxies1 Introduction
An enigmatic class of six low redshift galaxies has been defined during a spectroscopic survey of bright IRAS and RASS sources (Moran et al., 1996). They were named “Composite” to indicate their dual nature: the optical spectrum typical of a star forming galaxy is characterized by additional weak broad H wings that, together with the high X-ray luminosities, suggests the presence of an AGN. We have performed a study with Chandra of the four “Composites” that still lack a high resolution X-ray observation, with two main goals: 1) to investigate any extended X-ray component possibly associated with the InfraRed Starburst; 2) to determine the nature of the nuclear emission. We present here the first results obtained, while a detailed description of the X-ray data will appear in Panessa et al. (in preparation).
2 X-ray data
The sources were all observed with the ACIS-I instrument on board Chandra for a nominal exposure of ksec. Relevant data for the sources are listed in Table 1. Based on the RASS fluxes we had requested a Chandra configuration that would allow more frequent read-out of the data by using a smaller field of view to avoid pile-up. The results however indicate that the precautions taken were not necessary, since the observed count rates (see Table 1) are well below the expected value and the pile-up is not significant.
| Name | Redshift | c/s | R∗ | LX(2-10keV) | L(FIR) |
|---|---|---|---|---|---|
| ACIS-I | cgs (Chandra) | cgs | |||
| IRAS01072+4954 | 0.0237 | 0.0630.002 | 0.5 | ||
| IRAS01319–1604 | 0.0199 | 0.1150.002 | 0.5 | ||
| IRAS04392–0123 | 0.0289 | 0.0150.001 | 0.1 | ||
| IRAS20069+5929 | 0.0374 | 0.1800.003 | 1.0 |
∗ R is the ratio between Chandra and RASS fluxes.
2.1 Variability
We compare the total Chandra luminosities to previous RASS data (Moran et al., 1996). We find consistency only for IRAS20069+5929. The luminosity is smaller by a factor 10 for IRAS04392-0123, and a factor 2 for IRAS01072+4954 & IRAS01319-1604, as indicated by R in Table 1. A discrepancy of a factor 25 was also reported for IRAS00317-2142 (Georgantopoulos et al., 2003), while no information is available so far for IRAS20051-1117 that has been observed by Chandra and XMM-Newton. The long term variability alone already indicates that the dominant source of emission is due to a point sources.
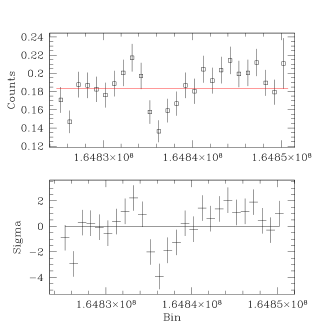
We have further investigated short term variability. We compute light curves by extracting the source counts in a region of 4′′ radius and background in a larger, source free, annulus around it. We bin light curves at 1000 sec to have enough statistics per bin. We show in Figure 1 the non constant light curve of source IRAS20069+5929, which has the largest statistics of the 4 Chandra observations. We highlight this variability detection since it indicates the presence of a point source even if the average luminosity of this source has not changed since RASS.
2.2 Spatial distribution
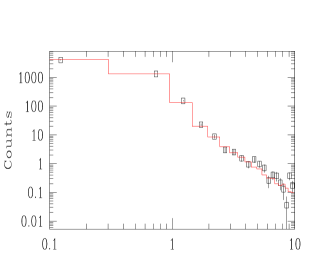
No extent is evident in any of the four sources, although a low surface brightness component might be present; more detailed analysis in underway. With the ciao task chart we simulate a point source distribution of photons that has the same spectrum of the observed source. We then extract the profile of both the source the Chandra PSF to compare them. We plot the histograms in Figure 2 for the brightest source IRAS20069+5929 and verify that it is consistent with a point source.
2.3 X-ray spectra
We extract spectra for the four sources and fit them with a simple model: a power law modified by low energy absorption due to our galaxy (from Dickey & Lockman 1990) plus an intrinsic redshifted component such as that expected in the hypothesis that the bright broad component in the optical spectrum is not seen because of absorption. We find instead that intrinsic NH is always small or negligible: IRAS01072+4954 and IRAS01319-1604 do not require statistically an intrinsic NH component; IRAS04392-0123 has N; IRAS20069+5929 has N.
A similar behavior is reported for IRAS 00317-2142, with ASCA data (Georgantopoulos, 2000), where there is no evidence of intrinsic absorption above a few .
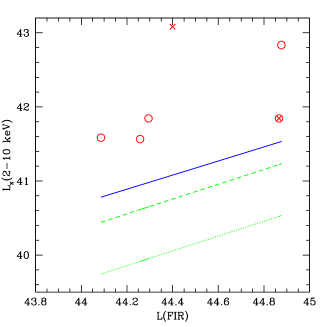
In spite of the lower luminosities in the most recent measurements, the current values are still not consistent with the hypothesis of them being produced by the starburst seen at InfraRed wavelengths. This is evident in Figure 3, where we plot (circles) the X-ray hard luminosity from Chandra vs. the FIR luminosity from Moran et al. (1996). The cross represents IRAS 20005-1117 (from Moran et al. 1996, X-rays from RASS); circle+cross is IRAS 00317-2142 (from Georgantopoulos et al. 2003, X-rays from Chandra). From the FIR Luminosity we compute the expected Star Formation Rate (SFR = 8-80 M⊙/yr). From the SFR we derive the expected X-ray luminosity according to Persic et al. (2004) (dotted line is contribution from HMXB; dashed line is the total from the Starburst) or David et al. (1992) (solid line). The currently observed X-ray luminosities of the sources are still at least about a factor of 10 higher than both estimates. The AGN dominates in X-rays or the starburst component is anomalous.
3 Conclusions
From the X-ray Chandra observations we conclude that the sources are: 1) point-like in the Chandra images, although we cannot exclude a low surface brightness component; 2) variable - both within the single Chandra observation (as in the case of IRAS20069+5929) and with respect to older data; 3) a thermal component is in general not present, even if in a few cases it might account for part of the soft emission; 4) the intrinsic absorption measured in the X-ray band is small or not required by the fit; 5) the current LX is still at least an order of magnitude higher than the predictions from the starburst power, which is of the order of SFR = 10-100 /yr.
Since the emission lines from the AGN are weak in the optical band, and absorption is not detected in X-rays, we cannot suggest obscuration as responsible for hiding the optical AGN.
Therefore we conclude that an AGN is present and dominant in X rays, but probably of low luminosity: LX(2-10 keV)=3.5-7. erg/s. This could explain the optical faintness observed by Moran et al. (1996).
Acknowledgements.
We acknowledge partial financial support from Agenzia Spaziale Italiana (ASI).References
- David et al. (1992) David L.P., Jones C., & Forman W., (1992), ApJ, 388, 82
- Dickey & Lockman (1990) Dickey J.M. & Lockman F.J., (1990), ARAA, 28, 215
- Georgantopoulos (2000) Georgantopoulos, I., (2000), MNRAS, 315, 77
- Georgantopoulos et al. (2003) Georgantopoulos, I., Zezas, A., Ward, M. J., (2003), ApJ, 584, 129
- Moran et al. (1996) Moran, E., Halpern, Jules P., Helfand, David J., (1996), ApJS, 106, 341
- Persic et al. (2004) Persic, M., Rephaeli, Y., Braito, V., Cappi, M., Della Ceca, R., Franceschini, A., Gruber, D. E., (2004), A&A 419, 849