The Fate of Lyman photons in local Starburst: new ACS/HST images
Abstract
We review the imaging and spectroscopic properties of the emission in starburst galaxies. The photons escape is largely driven by kinematical and orientation effects related to the presence of large scale expanding shells of neutral hydrogen. The various profiles can be linked to the evolutionary state of the starburst. Our recent imaging study using the HST-ACS is presented here: it highlights the presence of diffuse extended emission of low intensity leaking out the diffuse HI components. The similarities with the line profiles observed on high redshift galaxies is an important fact that cautions the use of to derive the cosmic star formation rate and constrains the search for high redshift galaxies.
1 Introduction
Star-formation rates in primeval galaxies are expected to reach hundreds of yr-1 (Partridge & Peebles,1967). For a normal Salpeter IMF this corresponds to total bolometric luminosities in excess of , which is similar to the values in luminous IRAS galaxies (Heckman 1993). The ionizing radiation from the newly formed young stars should lead to prominent emission due to recombination of hydrogen in the ambient interstellar medium. Therefore, the line could be an important spectral signature in young galaxies at high redshift since the expected luminosity amounts to a few percent of the total galaxy luminosity (Schaerer 2003; Stiavelli et al. 2003).
From the above estimates, typical fluxes of erg s-1 cm-2 are expected. Such values are within easy reach of present instruments. Over the past 20 years major observational efforts were undertaken to search for emission from faint galaxies at high redshift (Djorgovski & Thompson 1992). Although many emitters have been found (e.g., Frye et al. 2002; Malhotra & Rhoads 2002; Fujita et al. 2003; Ouchi et al. 2003, Schaerer, this conference), their numbers are smaller than predicted. Where is the population of emitting field galaxies, which should exist at high redshift?
The assumption of the intensity as produced by pure recombination in a gaseous medium may be too simple. Meier & Terlevich 1981, Hartmann et al. 1988, Neufeld 1990, and Charlot & Fall 1993 considered the effects of dust on . photons experience a large number of resonant scatterings in neutral atomic hydrogen, thereby increasing the path length and the likelihood of dust scattering and absorption. This process can be very efficient in removing photons from the line of sight to the observer, leading to much lower line strengths in comparison with the idealized Case B. Depending on the aspect angle of the galaxy as seen from the observer, this may lead to a decrease of the equivalent width. On the other hand, may actually be enhanced due to the presence of many supernova remnants which form during the starburst (Shull & Silk 1979). The net result is controversial. Bithell (1991) finds supernova remnants to be an important contributor to the strength whereas Charlot & Fall (1993) reach the opposite conclusion.
The theoretical situation is sufficiently complex that observational tests are required. The most obvious test are measurements of in local starburst galaxies whose redshifts are sufficiently large to permit observations of their intrinsic outside the geocoronal and Galactic interstellar . Observations of local starbursts have indeed been performed with the IUE satellite, (Meier & Terlevich 1981; Hartmann et al. 1988; Calzetti 2001; Terlevich et al. 1993; Valls-Gabaud 1993). Again, the results are controversial. For instance, Calzetti & Kinney (1992) and Valls-Gabaud find strengths in agreement with pure recombination theory whereas Hartmann et al. and Terlevich et al. conclude that significant dust trapping of photons must occur.
2 The role of kinematics in HI gas
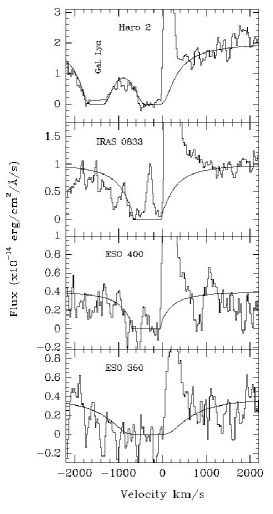
Finally, and most importantly, the kinematic properties of the interstellar medium may very well be the dominant escape or trapping mechanism for (Kunth et al. 2003). The complex nature of the escape probability has been revealed by the HST/GHRS spectroscopy (Kunth et al. 1998) and raised additional questions. They detected emission in half of them, with clear asymmetric P–Cyg profiles, as shown in Fig. 1a, while the other half showed prominent damped absorptions. The sample was extended at lower resolution by Thuan & Izotov (1997). In Fig. 1b we show the 3 characteristic profiles that can be found in star-forming galaxies: pure emission with symmetric profile, P–Cyg emission and broad, damped absorption profile.
The analysis of these data yielded the following results:
-
•
As is detected in emission, a clear P–Cyg profile is seen in most cases. Also the interstellar neutral metallic lines appear blueshifted by 200–400 km/s.
-
•
When the neutral gas is static with respect to the HII region, a damped broad absorption profile is detected.
Hence HST-GHRS data clearly showed that the kinematics of the gas was one major parameter determining the visibility of the line. However, if the dust content is small, the photons may, after multiple resonant scatterings could diffuse out over a larger area. This would create a bias in the spectroscopic studies which usually target the regions of peak UV intensity - under this scenario the places where we do not expect to see in emission. Another possibility is that the UV-continuum sources are partly shielded by a clumpy medium, in which case we would see mixed absorption and emission. In cases where the ISM has a non-zero radial velocity with respect to the UV continuum source, may appear in emission with a characteristic P-Cygni profile. Depending on the morphology and kinematics of the galaxy this can occur in different regions, and e.g. in a galaxy merger the escape probability may be enhanced.
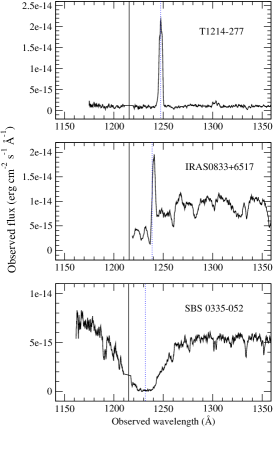
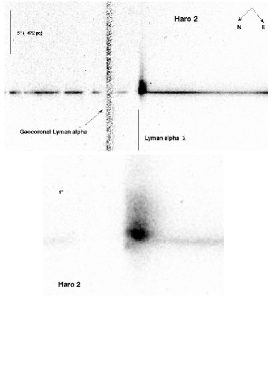
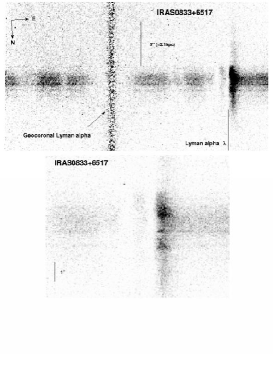
Further on, Mas-Hesse et al. (2003) have performed 2–D observations using HST-STIS in order to analyze the spatial structure of the emission profile, and look for areas where the photons could be leaking. Three objects were included in the sample: 2 showing a strong P–Cyg profile (Haro 2 and IRAS 0833+6517) and 1 showing a damped absorption (IZw18).
No emission whatsoever was detected from IZw18 along the STIS slit. The spectral images for Haro 2 and IRAS 0833+6517 are shown in Fig. 2. The main results drawn from these data are:
-
•
No velocity structure has been detected on the sharp edge of the P–Cyg profiles on scales of 1–5 kpc.
-
•
These profiles imply the presence of large column densities of neutral gas outflowing from the HII region at velocities of 200 – 400 km/s, acting practically as a moving plane-parallel slab on kpc scales.
-
•
Detection of broad and extended emission components of low intensity.
3 Interpretation: an evolutionary view
These observational results suggest that the central starbursts in these galaxies are driving a huge expanding shell of neutral gas. One can postulate that the interaction of the ionizing flux and the shell itself with the surrounding medium can lead to different configurations which could explain the variety of profiles. Moreover, these scenarios could be correlated with the evolutionary state of the starburst process.
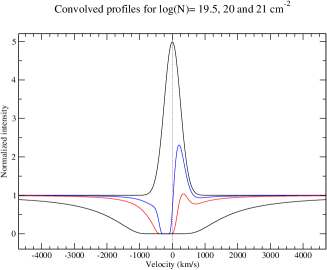
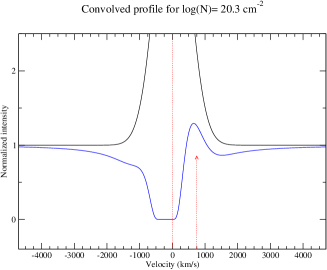
Mas-Hesse et al. (2003) show first in Fig. 3 the predicted effect of an expanding shell of neutral Hydrogen for different column densities. P–Cyg profiles similar to the observed ones are produced for column densities cm-2, moving at velocities around 300 km/s with respect to the HII region where the emission line is produced. For higher column densities the absorption is completely damped, and no photons can escape. On the other hand, for much higher outflowing velocities, the absorption takes place so much to the blue of the emission profile, that this wouldn’t be affected at all. Note that as a result of this saturated absorption by neutral gas, the centroid of the emerging emission line might appear artificially redshifted by a significant amount (see Fig. 3b) with respect to the HII region. This effect can be mistaken as an evidence for the presence of receding flows of ionized gas, which is not the case since the line is indeed emitted by the HII region.
As discussed in detail in Tenorio-Tagle et al. (1999) and Mas-Hesse et al. (2003), the interaction of bubbles and superbubbles as the starburst episode evolves may lead to different scenarios affecting the properties of the emission line profiles. We have identified 4 basic steps:
-
i)
Initially, when a star-forming episode starts, a central HII region begins to develop. At this phase, if the neutral gas surrounding the starburst region has HI column densities above 1014-15 cm-2, an absorption line centered at the systemic velocity of the galaxy will be visible, independently on the viewing angle. If the total HI column density along the line of sight is higher than around 1018 cm-2, a damped absorption profile will be detectable. It is important to stress that during this early phase of a starburst the Balmer emission lines will be strongest, due to the high ionizing flux produced by the most massive stars.
-
ii)
The situation changes drastically and becomes a strong function of viewing angle, once the mechanical energy released by the starburst is able to drive a shell of swept up matter exceeding the dimensions of the central disk. Then, upon the acceleration that this shell experiences as it enters the low density halo, it becomes Rayleigh–Taylor unstable and fragments. This event allows the hot gas (composed basically by matter recently processed by the starburst), to stream with its sound speed between fragments and follow the shock which now begins to form a new shell of swept–up halo matter, expanding at a velocity . Another consequence of the blowout is the fact that the ionizing photons from the recent starburst are now able to penetrate into the low density halo, and manage to produce an extended conical HII region that reaches the outskirts of the galaxy. An observer looking then at the starburst through the conical HII region will be able to detect the strong emission line produced by the central HII region, centered at the systemic velocity of the galaxy, and without any trace of absorption by neutral gas. On the other hand, an observer looking far away from the conical HII region will detect a broad absorption profile at any evolutionary state.
-
iii)
Sooner or later, recombination will begin in the expanding shell. This will cause a strong depletion of the ionizing radiation which formerly was able to escape the galaxy after crossing the extended conical HII region. Recombination in the expanding shell will produce an additional broad component of low intensity.
-
iv)
The ionization front becomes eventually trapped within the expanding shell by basically 3 effects. First, by the increasingly larger amount of matter swept into the expanding shell, as this ploughs into the halo. Second, the growth of the shell dimensions also implies less UV photons impinging, per unit area, at the inner edge of the shell. And third, in the case of a nearly instantaneous starburst, the production of UV photons starts to decrease drastically (as ) after the first 3.5 Myr of evolution.
The trapping of the ionization front will lead to the formation of a neutral layer at the external side of the expanding shell. All these effects result in an increasingly larger saturated absorption, as the external neutral layer will resonantly scatter the photons. This absorption will appear blueshifted with respect to the emitted by the central HII region by leading so to the formation of a P–Cyg profile where a variable fraction of the intrinsic emission would be absorbed.
In addition, the profile will be contributed by the radiation arising from the receeding section of the shell, both by recombination on the ionized layer, and by backscattering of the central photons by the neutral layer.
Under some circumstances, the leading shock front on the external surface of the shell can be heated and become ionized, producing so an additional emission which would be detected blueshifted by and not affected by absorption. This could be the case of the secondary emission peak detected in IRAS 0833+6517.
4 The ACS imaging studies
In the distant universe, imaging and low resolution spectroscopic techniques are now successfully used to find large numbers of galaxies. However, without a proper understanding of the emission processes this line cannot be used to estimate astrophysical quantities such as star formation rates and fluxes for reionisation and it becomes dubious to use it to study clustering if the biases are not properly known. If the star forming activity of a high redshift galaxy is connected with its environment, the escape probability will not be independent of this parameter.
These considerations led us to start a pilot programme to image local starburst galaxies in the line using the solar blind channel (SBC) of the Advanced Camera for Surveys (ACS) onboard HST, allowing us to study the emission and absorption morphology in detail. A sample of six galaxies with a range of luminosities ( to ) and metallicities (), including previously known emitters as well as absorbers, were selected and observed during 30 orbits in Cycle 11. The observations were obtained through the F122M ( ) and F140LP (continuum) filters.
| Galaxy | 12+log(O/H) | emitter/absorber | |
|---|---|---|---|
| SBS 0335-052 | –17 | 7.3 | absorber |
| NGC 6090 | –21 | 8.8 | emitter |
| ESO 350-38 | –20 | 7.9 | emitter |
| Tol 1924-416 | –19 | 7.9 | emitter |
| Tol 65 | –15 | 7.6 | absorber |
| IRAS 08+65 | –21 | 8.7 | emitter |
4.1 First continuum subtractions
The first results for two of the galaxies, ESO 350-38 and SBS 0335-052, were presented in Kunth et al. (2003). The images were drizzled to correct for geometric distortion, aligned and background subtracted. In order to subtract the continuum (F140LP) from the on-line (F122M) images to construct line-only images it is necessary to assume a shape of the continuum. As the UV spectra of starbursts are fairly well described by power-law spectral energy distributions (SEDs), a natural first step would be to adopt a power-law, , with the slope derived from, e.g. IUE spectra in the range Å. The relative scaling factors between the filters differs by a factor 1.7 for assumptions of and . The images in Kunth et al. (2003) were obtained in this way, by assuming , however it was noted that was variable over the face of each galaxy.
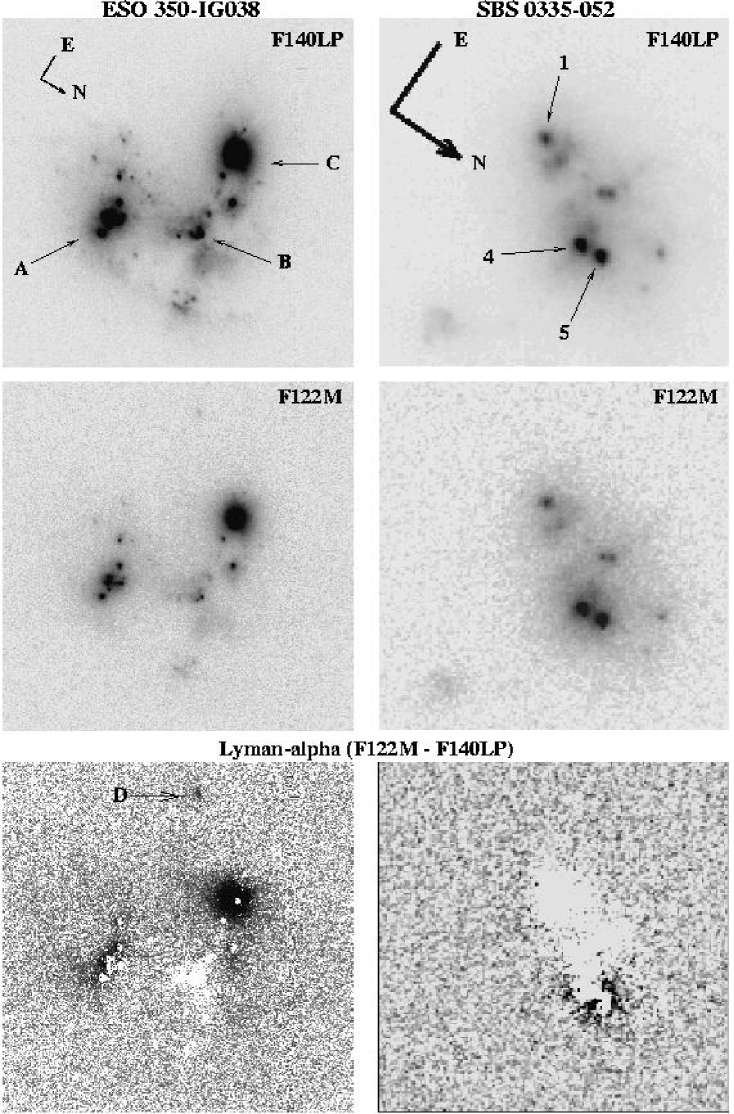
The results presented in Kunth et al. (2003) give a view of that is complementary to the results of previous HST/GHRS spectroscopy by Kunth et al. (1998). Moreover, they reveal the complex nature of emission and absorption in starburst galaxies. ESO350-IG038 shows in emission from several knots (A and C following Vader el. al 1993). By using the F140LP image, and an archival F606W WFPC2 image these knots were found to have very blue UV/optical colours (). In knot B and the surrounding region, is seen in absorption. Here, colours are much redder (). Knot A also shows a P Cygni profile and and diffuse emission is seen in numerous regions, particularly to the south-west of the image.
The image of SBS0335-052 shows broad damped absorption almost throughout, confirming the reports of Thuan et al. (1997). Diffuse emission is seen towards the north of the image (around SSC 5 following Thuan et al.) although it is very sensitive to the assumptions in the continuum subtraction.
Clearly, in order to separate emission from absorption in the less obvious cases, and in order to obtain photometrically valid images, a continuum subtraction procedure that takes the spatial variation of the continuum slope into account, is necessary.
4.2 Continuum subtractions using a -map
A more realistic way of estimating the scaling factor would be to use photometric maps of the ultraviolet continuum slope, so called “-maps”. A -map can be constructed from the F140LP images and an HST image in another, preferably blue, passband. Many of the target galaxies have been previously imaged e.g. with WFPC2 and -maps were constructed based on these. A general feature of such continuum subtractions is that the continuum is oversubtracted. This calls for several explanationss: i) The continuum often starts to deviate from a power-law at wavelengths Å, and in addition, absorption features may be present. Moreover, this -region is sensitive to extinction and the the extinction near is greater than for the continuum. ii) The F122M filter also covers, in addition to in the target galaxies, absorption from gas in the Milky Way. This means that a fixed fraction of the photons with wavelength will be lost. Since the solid angle covered is very small, this fraction will be fixed for each galaxy and will depend only on the column density of neutral hydrogen along the sightline.
It should be pointed out that the first point concerns also high- galaxies where continuum subtraction is a potential, yet little discussed, problem. In addition there might be an effect of intergalactic dust along the sightline. What is needed is a way to relate the correct continuum level at to the colours at longer wavelength.
We proceeded by switching our attention to another galaxy in our sample, ESO338-IG04 (Tololo 1924-416) where we have deep HST/WFCP2 images in the F218W, F336W, F439W, F555W and F814W filters (Östlin et al. 1998, 2003), as well as STIS long slit spectra with G140L available (Leitherer et al. in preparation). The combination of spectroscopic and imaging data over a wide wavelength interval meant that this target was ideal for a thorough investigation of the continuum subtraction procedures. From IUE spectra (e.g. Giavalisco et al. 1996) this target was known to be one of the brighter emitters in the local universe.
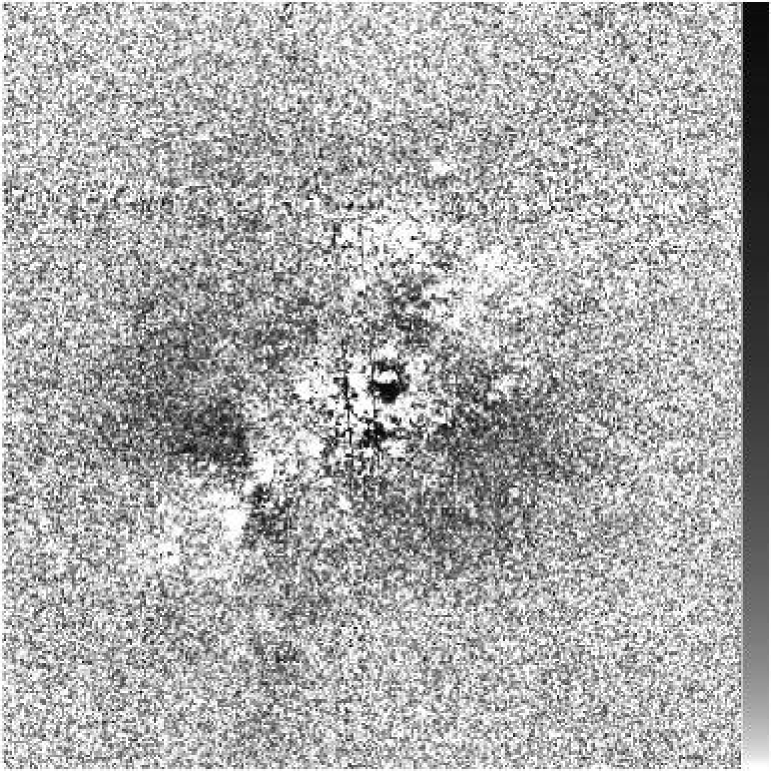
Preliminary continuum subtractionsusing a flat () continuum, similar to those produced for ESO350-IG038 and SBS0335-052 had already shown ESO338-IG04 to be a bright emitter over nearly all of the starburst region. This can be seen in Figure 5. Small offset absorption holes appeared in the brightest regions, similar to those announced for ESO350-IG038 in Kunth et al. (2003) and a feature consistent with a P-Cygni profile was visible in the brightest central star cluster. Also, a lot of diffuse was seen leaking out from regions approximately east and west of the central starburst. Adopting the normal -map procedure again lead to the usual oversubtraction of the continuum, even after experimenting with -maps constructed from a variety of filter combinations.
Comparison with the low resolution STIS spectrum of the central regions proved this continuum subtraction to be inaccurate. The spectrum shows emission from regions were the -map subtracted image shows absorption. Comparison of the values from the images and spectra in several star forming regions revealed that photometrically determined values were usually more negative than those determined by fitting a power law to the slope of the spectrum. It is clear that in at least some cases, the method of continuum subtraction using -maps substantially underestimates the scaling factor between the F122M and F140LP filters, leading to the subtraction of too much continuum.
The method of using a -map to estimate the scaling factor indeed relies upon the power-law being continuous at wavelengths Å. The IUE spectrum of this galaxy seems to indicate that this is not the case. The spectrum seems to flatten off slightly at around 1500Å, increasing (making less negative) the value of between out online and offline filters. Moreover there is no one-to-one relationship between the s obtained through -maps and power-law fitting to the STIS spectrum at shorter wavelengths, i.e. there is no simple relationship that describes the flattening of the spectrum shortwards of the F140LP filter.
4.3 Synthetic spectra techniques
The way forward is to use synthetic UV-spectra of starbursts (these are either based on model atmospheres or use empirical data, the latter being more realistic but there is a general lack of data for hot stars with low metallicities and there may be contaminations from interstellar absorption lines).
High resolution synthetic stellar evolutionary spectra (M. Cerviño, private communication) were used to approximate the SED of the central cluster of the galaxy. Our aim was to try and recreate the observed spectra of ESO338-IG04. The chosen synthetic spectra were generated using a Salpeter IMF, solar metalicity and burst ages ranging from 3 to 6 Myr. We took the low-resolution STIS spectrum of the central star cluster and fitted a Voigt profile to the wings of the damped Galactic absorption profile (giving a Galactic HI column density of 20.7 cm-1, independently confirming the value of 20.8 cm-1 from Galactic HI maps). This Voigt profile was then convolved with the spectrum to simulate Galactic absorption. We then applied Galactic reddening using the Cardelli law with values AV=0.288 and E(B-V) = 0.087 taken from NED. We fitted the synthetic spectrum to the real spectrum, fitting parameters were burst age and internal reddening using the SMC law. The best fit synthetic spectrum was then convolved with the HST/ACS/SBC F122M and F140LP instrument throughput profiles obtained using the SYNPHOT package in IRAF/STSDAS and synthetic fluxes in these filters were computed. The F122M-F140LP scale factor required to produce a net flux of zero in a continuum subtraction was calculated as . This method therefore gives us the scale factor depending only on the flux through the online and offline filters; totally independent of the shape of the slope at longer wavelengths. It is not dependent on the parameterisation of the continuum slope. For the central region, this gave a scale factor of 8.89 which corresponds to a of -0.86. While significantly less negative than the value of = -2.08 (Calzetti et al 1994), it does represent the continuum slope in exactly the region of interest.
This method works well for the bright clusters along the STIS slit where the starburst is young but is less applicable as the burst has aged. The general problem is that the aging of a burst and interstellar extinction have very similar but non-identical effects (reddening of the SED). Moreover, we need to find a method that does not rely on spectra, but allow us to use images. To do so we calculated a model for the appropriate metallicity (), and Salpeter 0.1–120 IMF using the Starburst99 code (Leitherer et al. 1999). We also included nebular emission lines through the interface with Starburst99 to the “Mappings” code. The model spectra were convolved with the WFPC2 and ACS/SBC filter profiles for all burst ages from 1 to 900 Myr and for a range of reddenings from E(B–V)=0 to 0.25 using the SMC law. We then calculated the scale factor in the above manner (taking the Galactic absorption into account) for all grid points.
We then investigated the relation between the scale factor and observed colours using various filter combinations, i.e. we are not primarily interested in resolving the age–reddening degeneracy, but to get a correct scale factor as a function of colour, whatever its reason. We quickly concluded that a single colour index can not uniquely determine the scale factor. Based on our experience with -maps and fitting of the spectra, this was not, of course, a surprise.
However, when using some filter combinations involving at least two different colour index, the scale factor can be tightly constrained. The best combinations in this case were F140LP-F218W vs. F336W-F439W and F140LP-F336W vs. F336W-F439W, the latter is presented here.
The model data points were used to populate a lookup table where the scale factor could be looked up from any pair of F140LP-F336W and F336W-F439W colours. In between evolutionary steps in the models (jumps in burst age), more colours and scale factors were interpolated linearly. Using this lookup table, the ACS F140LP image and WFPC2 F336W and F439W images were used to create a map of the scale factor over the whole starburst region. This scale factor map was then used to make a continuum subtraction.
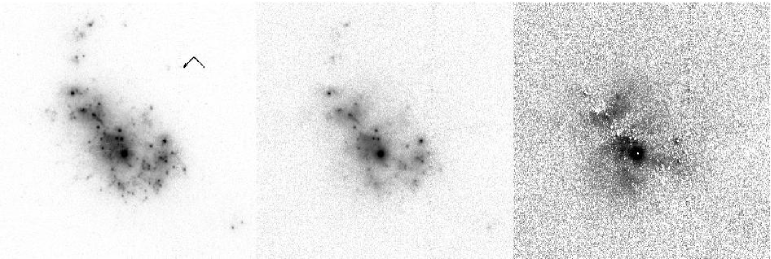
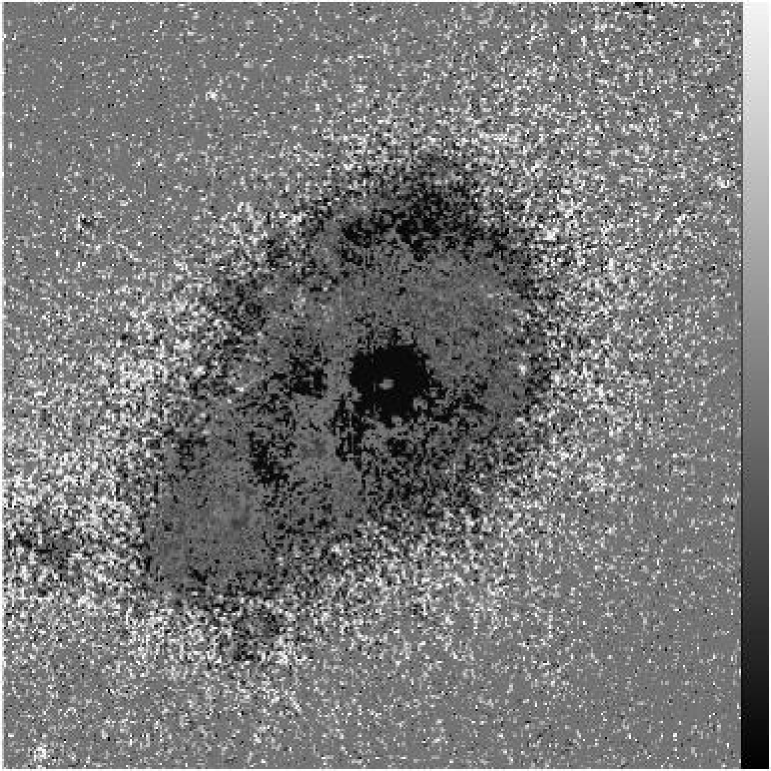
A scale factor map and associated continuum subtraction are shown in Fig 6. The first continuum subtracted image shows excellent agreement with features in the spectrum. is seen in both emission and absorption across the starbusrt region. Emission is seen from knot A and the region surrounding knot C with a P-Cygni profile at knot A. Diffuse emission is seen around knot D but not emission from this knot itself. Diffuse emission is also visible in large regions outside starburst regions. These are photons produced elsewhere that, after multiple scatterings, manage to leave the cloud thanks to a low dust content. Little is seen around knot B which is really strong in continuum but shows almost nothing in the low-res STIS spectrum.
We are now in the process of refining this procedure and will apply it to our whole sample using available HST images. In principle the method is applicable also to ground based data of high- galaxies.
5 Implications for high-redshift galaxies
In many respects, could be a fundamental probe of the young universe. It suffers from fewer luminosity biases than Lyman-break techniques so that surveys become a more efficient way to trace the fainter end of the luminosity function, i.e., it traces the building blocks of present-day galaxies in the hierarchical galaxy formation paradigm (Hu, Cowie, & McMahon 1998; Fynbo et al. 2001). Early results paint a complex picture. The equivalent widths of the sources are much larger than expected for ordinary stellar populations (Malhotra & Rhoads 2002). They could be explained by postulating an initial mass function (IMF) biased towards more massive stars, as predicted theoretically for a very metal-poor stellar population (Bromm, Coppi, & Larson 2001). The combined effect of low metallicity and flat IMF, however, can only partly explain the anomalous equivalent widths. Additional mechanisms must be at work (AGN activity?). Could spatial offsets between the escaping and the stellar light, together with higher extinction of the dust shrouded stars be important? Our HST spectroscopy and recent ACS imagery cautions against using the equivalent width as a star-formation indicator in the absence of spatial information.
The source numbers themselves are only about 10% of the numbers expected from an extrapolation of the Lyman-break luminosity function. Malhotra & Rhoads speculate if the youngest galaxies are preferentially selected, whereas older populations are excluded, the results are skewed towards large equivalent widths. Could dust formation after yr destroy the photons? The results in the low-redshift universe suggests otherwise. We find little support for dust playing a major role in destroying photons. Rather, the ACS images favor the complex morphology as key to understanding the escape mechanism.
Haiman & Spaans (1999) proposed galaxies as a direct and robust test of the reionization epoch (see Schaerer, this conference). Prior to reionization, these galaxies are hidden by scattering of the neutral intergalactic medium (IGM). Therefore, a pronounced decrease in the number counts of galaxies should occur at the reionization redshift, independent of Gunn-Peterson trough observations using quasars. in galaxies would have the additional appeal of being sensitive at much higher IGM optical depths since its red wing coincides with the red damping wing of intergalactic only. While this idea is attractive in principle, our ACS imagery calls for caution. In practice, is a complex superposition of emission and absorption in the star-forming galaxy itself. The resulting profile will be strongly affected by absorption from the continuum. This becomes even more of a concern when imaging data are interpreted. When integrating over the filter bandpass, the emission part of the profile is partly compensated by the absorption. As a result, we measure significantly lower fluxes than with spectroscopic methods, and the escape fraction of photons is significantly underestimated.
The line is a premier star-formation tracer, in particular at high where traditional methods, such as H or the far-IR emission, become impractical. Radiative transfer effects in the surrounding interstellar gas make its interpretation in terms of star-formation rates less straightforward than often assumed. Clearly, a better understanding of the complex escape mechanisms, both empirically and theoretically, is required before we can attempt to interpret large-scale surveys. Future high-resolution imagery of local starburst galaxies may provide the necessary calibrations.
6 References
References
- [1] Bithell, M. 1991, MNRAS, 253, 320
- [2] Bromm, V., Coppi, P. S., & Larson, R. 2001, ApJ, 564, 23
- [3] Calzetti, D. 2001, PASP, 113, 1449
- [4] Calzetti, D., Kinney, A. L. & Storchi-Bergmann, Th. 1994, ApJ, 429, 582
- [5] Charlot, S., & Fall, S. M. 1993, ApJ, 415, 580
- [6] Deharveng, J. M., Joubert, M., & Kunth, D. 1986, in Star-Forming Dwarf Galaxies and Related Objects, ed. D. Kunth et al. (Paris: Editions Frontieres), p. 431
- [7] Djorgovski, S., & Thompson, D. J. 1992, in IAU Symp. 149, Stellar Populations, ed. B. Barbuy & A. Renzini (Kluwer: Dordrecht), p. 337
- [8] Frye, B., Broadhurst, T., & Benitez, N. 2002, ApJ, 568, 558
- [9] Fujita, S. S., et al. 2003, AJ, 125, 13
- [10] Fynbo, J. U., Möller, P., & Thomsen, B. 2001, A&A, 374, 443
- [11] Giavalisco, M., Koratkar, A., & Calzetti, D. 1996, ApJ, 466, 831
- [12] Haiman, Z. & Spaans, M. 1999, ApJ, 518, 138
- [13] Hartmann, L., Huchra, J. P., Geller, M. J., O’Brien, P., & Wilson R. 1988, ApJ, 326, 101
- [14] Heckman, T. M. 1993, in The Environment and Evolution of Galaxies, ed. S. M. Shull & H. Thronson (Kluwer: Dordrecht), p. 155
- [15] Hu, E. M., Cowie, L. L., & McMahon, R. G. 1998, ApJ, 502, L99
- [16] Kunth, D., Leitherer, C., Mas-Hesse, J. M., stlin, G., & Petrosian, A. 2003, ApJ, 597, 263
- [17] Kunth, D., Mas-Hesse, J. M., Terlevich, E., Terlevich, R., Lequeux, J., & Fall, S. M. 1998, A&A, 334, 11
- [18] Leitherer, C., Schaerer, D., Goldader, J. D., Gonz lez Delgado, R. M., Robert, C., Kune, D. F., de Mello, D. F, Devost, D., & Heckman, T. M. 1999, ApJS, 123, 3
- [19] Malhotra, S., & Rhoads, J. E. 2002, ApJ, 565, L71
- [20] Mas-Hesse, J. M., Kunth, D., Tenorio-Tagle, G., Leitherer, C., Terlevich, R. J., & Terlevich, E. 2003, ApJ, 598, 858
- [21] Meier, D.L. & Terlevich, R. 1981, ApJ, 246, L109
- [22] Neufeld, D. A. 1990, ApJ, 350, 216
- [23] Ouchi, M., et al. 2003, ApJ, 582, 60
- [24] Östlin, G., Bergvall, N. & Rönnback, J. 1998, A&A, 335, 85
- [25] Östlin, G., Zackrisson, E., Bergvall, N. & Rönnback, J. 2003, A&A, 408, 887
- [26] Partridge, R.B. & Peebles, P.J.E. 1967, ApJ, 147, 868
- [27] Schaerer, D. 2003, A&A, 397, 527
- [28] Shull, J. M., & Silk, J. 1979, ApJ, 234, 427
- [29] Stiavelli, M., Fall, S. M., & Panagia, N. 2004, ApJ, 600, 508
- [30] Tenorio-Tagle, G., Silich, S.A., Kunth, D., Terlevich, E., & Terlevich, R. 1999, MNRAS, 309, 332
- [31] Terlevich, E., Diaz, A. I., Terlevich, R., & Vargas, M.L. 1993, MNRAS, 260, 3
- [32] Thuan, T.X. & Izotov, Y.I. 1997, ApJ, 489, 623
- [33] Thuan, Izotov & Lipovetsky ApJ, 477, 661
- [34] Vader, P., Frogel, J., Terndrup, D. & Heisler, C. 1993, AJ, 106, 1743
- [35] Valls-Gabaud, D. 1993, ApJ, 419, 7