22institutetext: Space Telescope Science Institute, 3700 San Martin Drive, Baltimore, MD 21218, USA, e-mail: kamp@stsci.edu
Modeling the gas reservoir of circumstellar disks around young G-type stars
Interpretation of molecular line observations in tenuous circumstellar disks around young G-type stars in terms of a disk mass is difficult without a model that describes the chemical structure of these disks. This paper now discusses the chemistry in tenuous disks around young solar-type stars based on disk models that take into account the presence of a stellar chromosphere. The example of the disk around a 70 Myr old solar-type star shows that the dissociating radiation from the chromosphere is stronger than the interstellar ultraviolet radiation field up to a distance of 400 AU from the star. Similar to other studies in this research field, it is found that, due to photodissociation, the CO-to-H2 ratio is far from the canonical value of for molecular clouds. Moreover, the dust-to-gas mass ratio, as well as the dust grain size play an important role for the H2 abundance in these disks.
Key Words.:
Stars: chromospheres – circumstellar matter – Stars: pre-main sequence1 Introduction
The IRAS and ISO satellites revealed that a large fraction of nearby pre-main sequence solar-type stars are surrounded by cool dust. Near-infrared and submillimeter observations have shown that the dust is distributed in disk-like sometimes ring-like structures around the star (see Zuckerman Zuckerman:2001 (2001) for a recent review). However, the gas content of these protoplanetary disks is still under debate. CO observations by Zuckerman et al. (Zuckerman_etal:1995 (1995)) for a sample of young stars in the range - yr lead to the conclusion that the gas dissipates very rapidly — within a few million years — from the protoplanetary disks. A later study by Coulson et al. (Coulson_etal:1998 (1998)) for a sample of 24 candidate Vega-excess stars shows also too little or no CO emission. Only recently, Greaves et al. (Greaves_etal:2000 (2000)) found no evidence for CO rotational lines in a sample of 14 nearby F and G-type stars with known circumstellar dust. Since solar-type stars are thought to have little UV radiation, the non-detection of CO is generally interpreted as an overall lack of gas in the disks around these stars. As a consequence planets would have to form either faster in the framework of the core-accretion model or they form on a very short timescale — a few thousand years — via gravitational instabilities.
What people have neglected so far, is the possible existence of a chromosphere in solar-type stars. Ayres (Ayres:1997 (1997)) has shown that the ionizing ultraviolet flux from our Sun was much stronger in the past and evolved roughly as with time. The aim of this paper is to study the influence of a chromosphere on the chemistry in late phases of disk evolution, that is for disks with . For this purpose, we choose a template for a 70 Myr old solar-type star and compile a typical chromospheric radiation field (Sect. 2). The modeling procedure is briefly described in Sect. 3 and the outcome of the model calculations is presented and discussed in Sect. 4.
2 The template G-type star
The initial search for a template star was lead by the following criteria:
-
•
The spectral type has to be similar to our Sun, G5V.
-
•
, that is the disk has to be optically thin in the UV.
-
•
Disk parameters have to be known from infrared photometry.
-
•
CO observations have to exist (either detection or upper limit).
From a literature study of the papers by Sylvester & Skinner (SylvesterSkinner:1996 (1996)), Sylvester et al. (Sylvester_etal:1996 (1996)), Dunkin et al. (1997a , 1997b ), Zuckerman et al. (Zuckerman_etal:1995 (1995)), Coulson et al. (Coulson_etal:1998 (1998)) and Greaves et al. (Greaves_etal:2000 (2000)), only one candidate star was found: HD 123160. Unfortunately, the spectral type as well as the nature of the infrared excess of this star was recently questioned: Mora et al. (Mora_etal:2001 (2001)) and Kalas et al. (Kalas_etal:2002 (2002)) classify this star as a K5 giant and detect a complex reflection nebula instead of a disk-like structure. We conclude that observational data is simply up to now too scarce, and we proceed by compiling a template star using typical stellar and disk properties.
2.1 Stellar parameters and disk properties
The basic stellar parameters and disk parameters assumed for the template star are summarized in Table 1. We assume in the following a typical age of 70 Myr for our template.
| parameter | template star |
|---|---|
| spectral type | G5 V |
| 5570 | |
| 4.5 | |
| stellar radius | 0.9 |
| distance | 15.7 pc |
| age | yr |
| (disk) | 190 AU |
| (60 AU) | |
| (disk) | 470 AU |
| (disk) | 0.057 |
| (0.77 ) |
Given the fact that observations yield in most cases only a lower limit for the gas mass, the disk models are calculated for three different gas masses: 0.033, 0.33 and 3.3 M⊕. On the other hand, the dust mass is fixed to 0.057 M⊕. This means that the gas-to-dust mass ratio varies in the three models from 0.58 to 58. In addition, model calculations are performed with an alternative more massive dust disk model, M M⊕, which shows a very similar IR excess.
2.2 The UV radiation field
Following Table 1, a Kurucz ATLAS9 stellar atmosphere model (Kurucz Kurucz:1992 (1992)) with an effective temperature of 5750 K and a of 4.5 is assumed for our template star.
In early stages of star formation, the ultraviolet radiation field is dominated by active accretion from the circumstellar disk/envelope. In later stages, when accretion is no longer the dominant process, stellar activity takes over. Studies of open star clusters have shown that young solar-type stars are more active than the present Sun. Ayres (Ayres:1997 (1997)) estimated correlations between stellar activity and rotation for different tracers like O vi, C iii and Ly based on observed X-ray-rotation and C iv-rotation relations. Combining this with observed age-rotation relations, Ayres concludes that all the photorates scale approximately as with time. Photodissociation of CO and H2 takes place through discrete bands and is thus affected mostly by the continuum. Nevertheless, some of the dissociating bands overlap with the emission lines of an active solar-type star, e.g. with the O vi emission around 1038 Å or the C iii at 977 Å. Hence, it is assumed that the total flux in the 912 - 1110 Å region scales with time as .

Data from the LASP/CU rocket experiment and Solar Stellar Irradiance Comparison Experiment (SOLSTICE) serves as a template for the UV radiation of our present Sun. Fig. 1 shows that the rocket and satellite data agrees well with a Kurucz ATLAS9 model of 5750 K and a of 4.5.

With an age of 70 Myr for our template star, the flux has to be scaled by a factor with regard to the Sun. Since Ayres (Ayres:1997 (1997)) states that the linear scaling of the flux does not hold for processes involving the continuum at wavelength larger than 1500 Å, a different scaling law is used for the 912 - 1190 Å range (rocket data) and the 1190 - 2000 Å range (SOLSTICE data). The first wavelength interval is scaled up by a constant factor of 70. To match the photospheric flux at 2000 Å, the latter is then scaled according to the following relation
| (1) | |||||
where is given in erg cm-2 s-1 Hz-1 and is in Å. The resulting flux distribution is depicted in Fig. 2. Our high resolution spectrum overlaps with previously published reconstructed near UV fluxes for the 70 Myr old Sun (Dorren & Guinan DorrenGuinan:94 (1994)). The latter does not cover the UV region of interest, where CO and H2 photodissociate. However, in the overlap region beyond 1250 Å, the overall agreement is very good.
Fig. 3 illustrates the strength of the scaled UV radiation field with respect to an interstellar Habing field (Habing Habing:1968 (1968)), cm-2 s-1. denotes the integrated UV flux over the range 912 - 1110 Å. It is clearly seen that the stellar radiation field dominates up to AU in an optically thin disk.

3 The disk model
The main features of the disk models are briefly summarized and for further details, we refer to the original paper Kamp & Bertoldi (KampBertoldi:2000 (2000)).
We assume thin hydrostatic equilibrium models
| (2) |
As a simplification, we assume a dimensionless scale-height . This does not lead to fully self-consistent disk models, but a coupling of the gas temperature calculation and the disk structure calculation is beyond the scope of this paper. The inner and outer radius of the disk are set to the respective values given in Table 1. The power-law exponent of the disk surface density is . The stellar radiation field is described above (see Sect. 2.2).
The dust temperature follows from radiative equilibrium assuming large spherical grains of radius m (Kamp & Bertoldi KampBertoldi:2000 (2000))
| (3) |
with the stellar luminosity in units of the solar luminosity . The assumption of this simple form of radiative equilibrium is certainly correct for the large dust grains and optically thin disks described in this paper.
The chemical network consists of 47 atomic, ionic, and molecular species that are related through 268 gas-phase chemical and photoreactions. A number of reactions is treated in more detail like H2 and CO photo-dissociation, and C ionization. The only surface reactions incorporated are H2 formation and freezing out of CO on cold dust-grain surfaces. Since we are dealing with large dust particles, we reduced the H2 formation rate according to the reduced grain surface area. The abundance of CO ice is due to a balance between freezing out of gaseous CO and reevaporation of CO ice. The two differences to the Kamp & Bertoldi (KampBertoldi:2000 (2000)) paper are: (1) the inclusion of cosmic ray reactions and (2) a lower temperature of 20 K for freezing out of CO ice. However, due to the strong stellar UV radiation field, the chemistry is mostly driven by stellar photons. A modified Newton-Raphson algorithm is used to obtain a stationary solution of the entire chemical network.
4 Results
Four main questions are adressed in the following subsections:
-
•
What is the chemical composition of the disk? How does it depend on disk mass, what is the role of shielding?
-
•
How does the CO-to-H2 ratio change with disk mass?
-
•
How does the varying dust-to-gas mass ratio affect the chemical composition of the disk?
-
•
What is the effect of a chromosphere as compared to the interstellar radiation field? When does a chromosphere need to be included in disk modeling?
The basic parameters of the disk models computed to answer these questions are summarized in Table 2. The outer radius is fixed to 470 AU in all models. The name of the disk model is composed as follows: __. The type of radiation field is indicated by ’CH’ or ’IS’, which stands for ’chromosphere’ or ’interstellar’. The former radiation field is explained to great detail in Sect. 2.2. The interstellar radiation field is taken from Habing (Habing:1968 (1968)) and approximated by the following expression
| (4) | |||||
with being the wavenumber in cm-1. For simplicity, it is assumed that the interstellar radiation field only penetrates the disk from the inner edge. A more realistic approach would involve a 2D radiative transfer, which is so far not included in the model.
| name | |||||
|---|---|---|---|---|---|
| m0.033_190_CH | 190 | 0.033 | 1.73 | 3.37(-21) | CH |
| m0.33_190_CH | 190 | 0.33 | 1.73(-1) | 3.37(-22) | CH |
| m3.3_190_CH | 190 | 3.3 | 1.73(-2) | 3.37(-23) | CH |
| m0.033_190_IS | 190 | 0.033 | 1.73 | 3.37(-21) | IS |
| m0.33_190_IS | 190 | 0.33 | 1.73(-1) | 3.37(-22) | IS |
| m3.3_190_IS | 190 | 3.3 | 1.73(-2) | 3.37(-23) | IS |
| m0.033_60_CH | 60 | 0.033 | 2.3(1) | 5.38(-20) | CH |
| m3.3_60_CH | 60 | 3.3 | 2.3(-1) | 5.38(-22) | CH |
| m0.033_60_IS | 60 | 0.033 | 2.3(1) | 5.38(-20) | IS |
| m3.3_60_IS | 60 | 3.3 | 2.3(-1) | 5.38(-22) | IS |
Note: numbers in parentheses: 3.37(-21) =
4.1 The chemical composition of the disk
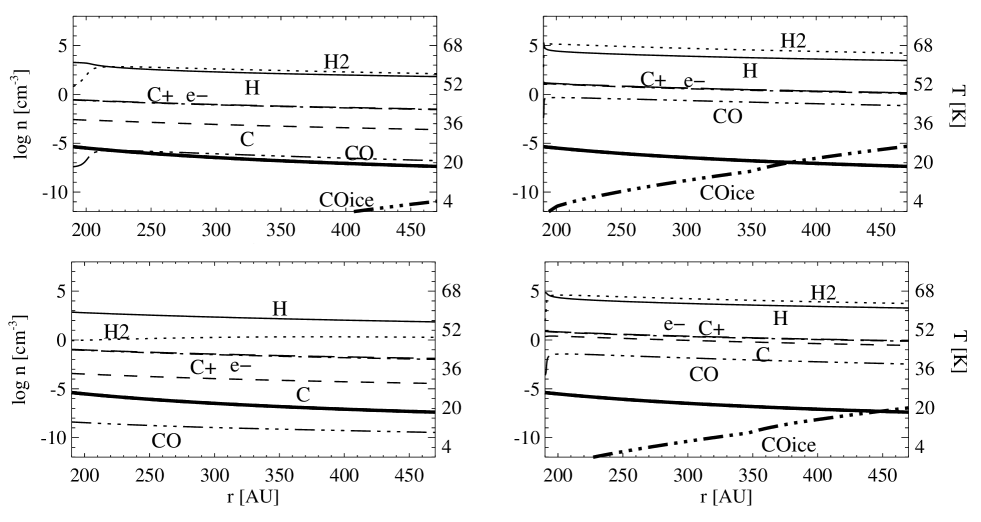
We limit the discussion here to some key species, namely H, H2, C, C+, CO, and CO ice, that can act as possible tracers for the disk mass. The three models m0.033_190_CH, m0.33_190_CH, and m3.3_190_CH cover the transition from a completely transparent disk to a moderately shielded one.
Fig. 4 illustrates the chemical structure of two disk models: m0.033_190_CH and m3.3_190_CH. Since the disks are optically thin in the UV, dust shielding is not important for the photoreactions. H2 can efficiently shield itself against photodissociation within one scaleheight in all three models. In the m3.3_190_CH model the molecular hydrogen extends even to 1.5 scaleheights. Despite this high abundance of molecular hydrogen, H2 is not able to shield CO against photodissociation. Self-shielding of CO sets in for the m0.33_190_CH disk model and becomes efficient in the highest mass model, m3.3_190_CH. There, the CO abundance reaches values of . In the outermost parts of the disk, AU, the temperature drops below 20 K, but the low densities cm-3 prevent a strong freeze-out of CO on dust grains.
The chemistry depends very much on the He abundance: Helium is partially ionized by cosmic rays. The ionization degree He ii/He i is always much smaller than 1 and depends strongly on the recombination processes and hence on the densities in the disk model. Since we use here the solar He abundance of , the destructive reaction He+ + CO keeps the C+ abundance up throughout the disk in all models.
4.2 The CO-to-H2 ratio
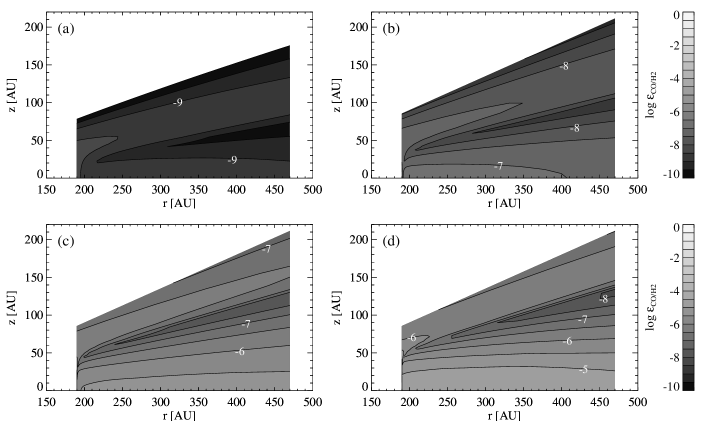
Fig. 5 illustrates how the The CO-to-H2 ratio changes throughout the disk for various disk models. With increasing disk mass, the CO abundance in the disk rises and hence the CO-to-H2 ratio increases. In general, the difference between a model with chromospheric radiation field and one with interstellar radiation field amounts at maximum to CO-to-H2 ratio dex.
For an interpretation of observations, which give rather an integrated picture of the CO in the disk, it is better to use the integrated [CO/H2] ratio of the various disk models (see Table 3)
| (5) |
| name | [CO/H2] |
|---|---|
| m0.33_190_CH | |
| m3.3_190_CH | |
| m0.33_190_IS | |
| m3.3_190_IS | |
| m3.3_60_CH | |
| m3.3_60_IS |
Given the tenuous character of these disks, an IS UV radiation field would penetrate the disk from all directions and therefore lead to a much higher [H2/CO] ratio even for the 3.3 M⊕ model. Thus, we draw the tentative conclusion that the [CO/H2] conversion factor in these disks can be orders of magnitude smaller than the canonical value for molecular clouds, [CO/H2]. These disks resemble in their nature generally the photon dominated regions (PDR) on the surfaces of molecular clouds, very high UV irradiation and densities ranging from to a few times cm-3.
4.3 The role of dust
As already stated above, dust shielding plays no role for the photochemistry in the disk. On the other hand, the dust grain surfaces are the location where molecular hydrogen is formed. Hence, the H2 formation rate
| (6) |
is higher in models with a higher dust-to-gas mass ratio, e.g. m0.033_190_CH as compared to m3.3_190_CH. denotes here the effective UV attenuation cross section per H nucleus. Assuming a low dust-to-gas mass ratio of for the 0.033 M⊕ model prevents formation of H2 throughout the whole disk.
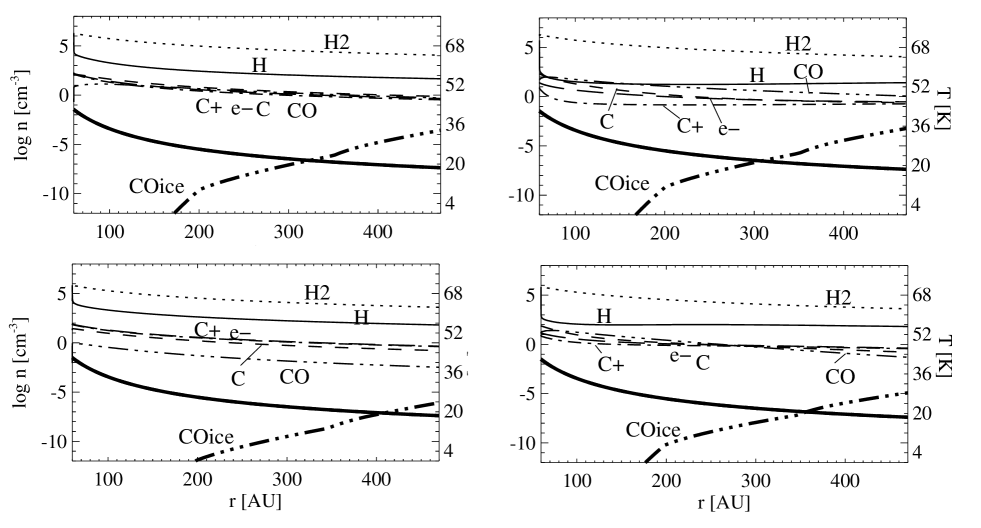
The alternative model (Sylvester & Skinner SylvesterSkinner:1996 (1996)) with an inner radius of 60 AU and a dust mass of 0.77 has an even higher dust-to-gas mass ratio (m3.3_60_CH: 0.23 compared to m3.3_190_CH: ) and therefore H2 extends up to two scaleheights and CO up to one scaleheight in the disk. Additionally, the freezing out of CO is slightly enhanced, but still not efficient enough to obtain a high CO ice abundance. But even in these disk models with a high dust mass, dust absorption is not a dominant shielding process.
4.4 The role of the chromosphere
The outer parts of the disk beyond 400 AU are clearly dominated by the interstellar radiation field. Nevertheless, for the inner gas disk the chromospheric UV radiation is the driving mechanism in chemistry. If one neglects the presence of a chromosphere, the resulting H and CO abundances differ by more than a factor 10, especially in regions where most of the disk mass is located (see Fig. 6).
For somewhat younger stars, the chromosphere will be even more important, because the stronger stellar activity will give rise to an even higher UV photon flux. At a certain point back in time, the disk has been optically thick and actively accreting; therefore UV photons and X-rays from the accretion process have probably determined the chemistry and temperature balance in the upper layers of the protoplanetary disk. At which stellar age the transition to optically thin disks occurs as well as the point in time when accretion ceases and stellar activity takes over has still to be determined.
5 Conclusion
In this paper, we investigate the chemical structure of tenuous circumstellar disks around young solar-type stars using the disk models developed by Kamp & Bertoldi (KampBertoldi:2000 (2000)). Previous observational studies have neglected the possible influence of a chromosphere for solar-type stars. Especially in an earlier evolutionary stage (WTTS), the UV radiation from the chromosphere is much stronger than that of the present Sun and may determine the chemistry in the circumstellar surrounding.
The main results of this work are:
-
•
We present a recipe to calculate the chromospheric UV radiation field of young solar-type stars as a function of age.
-
•
The CO-to-H2 ratio in low mass disks around solar-type stars is smaller than the canonic value of for molecular clouds and resembles more the values found for the PDR surface layers of molecular clouds.
-
•
The dust-to-gas mass ratio has a strong influence on the molecular hydrogen abundance in disks. Low mass disks, in which hydrogen would otherwise be atomic, can become molecular in the presence of a high dust-to-gas mass ratio. Note that since these disk models are optically thin in the UV, this is not due to dust shielding, but due to an enhanced H2-formation rate.
-
•
The chromosphere of a 70 Myr old star dissociates the CO in the inner disk ( AU) of a solar-type star. Due to self-shielding effects, H2 is much less affected than CO. In the outer disk, the stellar UV radiation field is smaller than the typical interstellar UV field.
This work presents a first step towards the modeling of protoplanetary disks around young solar-type stars. The model is for example limited by the fact that we did not include an interstellar UV radiation field in a self-consistent way (2D radiative transfer). Moreover, at least a simple line radiative transfer has to be included in order to (a) be able to calculate the gas temperature in these disks self-consistently and (b) to extend these disk models to higher masses.
Acknowledgements.
The authors thank Ewine van Dishoeck for many fruitful discussions during the course of this work. We are grateful to the referee, whose comments helped to make this paper clearer and more concise and to Jeff Valenti for a careful reading of the manuscript. Astrochemistry in Leiden is supported by a SPINOZA grant from the Netherlands Organization for Scientific Research (NWO).References
- (1) Ayres T.R. 1997, JGR Planets 102, 1641
- (2) Coulson I.M., Walther D.M., Dent W.R.F. 1998, MNRAS 296, 934
- (3) Dorren, J.D., Guinan, E.F. 1994, ApJ 428, 805
- (4) Dunkin S.K., Barlow M.J., Ryan S.G. 1997, MNRAS 286, 604
- (5) Dunkin S.K., Barlow M.J., Ryan S.G. 1997, MNRAS 290, 165
- (6) Greaves J.S., Coulson I.M., Holland W.S. 2000, MNRAS 312, L1
- (7) Habing H.J. 1968, Bull. Astr. Inst. Netherlands 19, 421
- (8) Jura M., Kahane C. 1999, ApJ 521, 302
- (9) Kalas P., Graham J.R., Beckwith S.V.W., Jewitt D.C., Lloyd J.P. 2002, ApJ 567, 999
- (10) Kamp, I., & Bertoldi, F. 2000, A&A, 353, 276
- (11) Kurucz R.L. 1992, Rev. Mex. Astron. Astrofis. 23, 181
- (12) Mora A., Merín B., Solano E., Montesinos B., de Winter D., et al. 2001, A&A 378, 116
- (13) Scoville N.Z., Sargent A.I., Sanders D.B., Claussen M.J., Masson C.R., Lo K.Y., Phillips T.G. 1986, ApJ 303, 416
- (14) Sylvester R.J., Skinner C.J. 1996, MNRAS 283, 457
- (15) Sylvester R.J., Skinner C.J., Barlow M.J., Mannings V. 1996, MNRAS 279, 915
- (16) Zuckerman B. 2001, ARAA 39, 549
- (17) Zuckerman B., Forveille T., Kastner J.H. 1995, Nature 373, 494