A Constant Bar Fraction out to Redshift in the Advanced Camera for Surveys Field of the Tadpole Galaxy
Abstract
Bar-like structures were investigated in a sample of 186 disk galaxies larger than 0.5 arcsec that are in the I-band image of the Tadpole galaxy taken with the Hubble Space Telescope Advanced Camera for Surveys. We found 22 clear cases of barred galaxies, 21 galaxies with small bars that appear primarily as isophotal twists in a contour plot, and 11 cases of peculiar bars in clump-cluster galaxies, which are face-on versions of chain galaxies. The latter bars are probably young, as the galaxies contain only weak interclump emission. Four of the clearly barred galaxies at have grand design spirals. The bar fraction was determined as a function of galaxy inclination and compared with the analogous distribution in the local Universe. The bar fraction was also determined as a function of galaxy angular size. These distributions suggest that inclination and resolution effects obscure nearly half of the bars in our sample. The bar fraction was also determined as a function of redshift. We found a nearly constant bar fraction of from to . When corrected for inclination and size effects, this fraction is comparable to the bar fraction in the local Universe, , which we tabulated for all bar and Hubble types in the Third Reference Catalogue of Galaxies. The average major axis of a barred galaxy in our sample is kpc after correcting for redshift with a CDM cosmology. The average exponential scale length is kpc. These are half the sizes of local barred galaxies and not likely to be influenced much by cosmological dimming because the high-z galaxies are intrinsically brighter. We conclude that galaxy bars were present in normal abundance at least Gy ago (); the bars in clump cluster galaxies may have formed from gaseous disk instabilities and star formation rather than stellar disk instabilities, and bar dissolution cannot be common during a Hubble time unless the bar formation rate is comparable to the dissolution rate. If galaxy interactions trigger bar formation more than bar destruction, then the higher interaction rate in the past suggests relatively few bars actually dissolved in a Hubble time.
1 Introduction
The fraction of barred galaxies as a function of redshift is an important quantity for understanding galaxy evolution. Models predict that the secular evolution of bars may lead to dissolution and bulge formation following the accretion of a sufficiently large gas mass to the center (e.g., Combes & Sanders 1981; Hasan & Norman 1990; Pfenniger & Norman 1990; Bournaud & Combes 2002; Debattista et al. 2004). Recent 3-D chemodynamical models by Immeli et al. (2004a) show that disk evolution depends on the relative cooling rate: rapid cooling leads to early gas instabilities, big star-formation complexes, and the mergers of these complexes into a bulge, as in Noguchi (1999). This phase resembles high redshift chain galaxies if viewed edge-on (Cowie, Hu, & Songaila 1995; O’Neil et al. 2000; Elmegreen, Elmegreen, & Sheets 2004, hereafter Paper I; Immeli et al. 2004b), and what we termed clump-clusters if viewed face-on (Elmegreen, Elmegreen, & Hirst 2004; hereafter Paper II). Slow cooling in other models by Immeli et al. (2004a) leads to smoother stellar disks that may become bar unstable if the effective Toomre-Q parameter drops to a low value in the center. The possibility that bars also form in clumpy galaxies was not discussed, nor was the formation of clumpy bars. Little observational evidence has been presented for the actual formation process of bars at high z.
Barred galaxies at intermediate and high redshifts are difficult to find (van den Bergh et al. 1996, 2000, 2001; Abraham et al. 1999). The fraction of barred galaxies at has appeared to be less than the local fraction (Abraham et al. 1999, Jogee et al. 2003), which van den Bergh et al. (2002) argued is not entirely a selection effect. Nonetheless, because of the high angular resolution required to find bars, and because there are inadequate morphological clues in the rest-wavelength ultraviolet bands where even low-redshift bars are indistinct (e.g., Windhorst et al. 2002; Sheth et al. 2003), it is possible that the fraction is higher than these surveys indicate. Sheth et al. (2003) found four barred galaxies with in the Near-Infrared Camera and Multi-Object Spectrometer (NICMOS) observations of the Hubble Deep Field-North (HDF-N), and commented that the corresponding fraction of local galaxies with equally large bars ( kpc length) was about the same.
Here we use the Hubble Space Telescope Advanced Camera for Surveys (HST ACS) image of the Tadpole galaxy field (Tran et al. 2003) to study bar fraction as a function of galaxy size, inclination, and redshift using our sample of 186 spiral galaxies with major axes greater than 10 pixels (see Paper I). Bars are identified by morphology based on grayscale images and contour plots, and by ellipticity and position angle twists in ellipse fits. Photometric redshifts are from Benitez et al. (2004).
The Tadpole field observations have higher resolution than the WFPC2 or NICMOS images of the HDF-N (Williams et al. 1996) and HDF-S (Casertano et al. 2000) fields and they have about the same depth at I band, so small galaxy features like bars at high z are better seen in the Tadpole field. For the Tadpole field, the pixel size is 0.05 arcsec and the stellar FWHM is 0.105 arcsec (Benitez et al. 2004), whereas the HDF images have twice the pixel size with WFPC2 and a stellar FWHM of 0.14 arcsec. All three fields have about the same depth at in I band: 27.2 mag for the Tadpole field (Benitez et al. 2004), 27.6 mag for the HDF-N (Williams et al. 1996), and 27.7 mag for the HDF-S (Casertano et al. 2000). The point spread function of NICMOS is twice that of the WFPC2 (Sheth et al. 2003).
The present survey of 186 spiral galaxies in the Tadpole field presents 22 cases of bars that are clearly visible in the grayscale images, contour plots, and ellipse fits, and an additional 21 cases where the contour plots show elongated structures in the center that are twisted with respect to the outer isophotes. The latter cases tend to be more poorly resolved than the former, and may also be bars.
Triaxial bulges formed by galaxy mergers or bar dissolution (e.g., Friedli & Martinet 1993; Friedli et al. 1996; Pfenniger 1999) should be composed of a relatively smooth population of stars. Evidence for significant clumpy structure in moderate-redshift bars or evidence for asymmetric and irregular bars in clump-cluster galaxies would suggest bar and bulge formation processes operating mostly in the gas. This follows from the observation of relatively large sizes and small numbers of clumps in clump-cluster galaxies, which imply that the gas represents a high fraction of the disk mass (Papers I and II). Thus, bars in clump-cluster galaxies may have formed from gaseous instabilities like the clumps, rather than from instabilities in existing stellar disks, which is the standard model of bar formation (Sellwood & Wilkinson 1993). To check this, we searched for bar-like elongations in clump clusters and for clumpy bars in disk galaxies with exponential profiles. Eleven examples of barred clump-cluster galaxies and 2 examples of clumpy bars in exponential disks were found.
The sample of high-redshift barred and inner twist galaxies is large enough to allow corrections for selection biases resulting from inclination and galaxy size. It also begins to give the distribution of bar fraction with redshift. The largest redshift for a clearly barred galaxy in this survey is z=1.22 and the largest for a galaxy with an inner isophotal twist is 1.84.
2 Data and Analysis
We used deep images of UGC 10214 in I band (F814W filter, total exposure time per pixel 8180 s), which were obtained in April 2002 with the HST ACS as part of the Early Release Observations proposal 8992 (Tran et al. 2003). The combined image is 3.9 arcmin x 4.2 arcmin, with 0.05 arcsec pixels. The fully reduced image was kindly made available by the ACS team in advance of publication, using the methods of Blakeslee et al. (2003) and Tran et al. (2003) but with more up-to-date reference files and a new damped sinc (’lançzos3’) drizzling kernel for improved resolution (Blakeslee, private communication). We determined photometric parameters using the conversion , with a zeropoint of 25.921 for I band (Blakeslee et al. 2003).
In Papers I and II, we classified galaxies according to their morphology based on visual inspection of the V and I-band images coupled with radial profiles and contour plots. In this paper, we focus on the galaxies that appear to be normal spirals or clump clusters.
Contour plots were made of each galaxy. The axial ratios of the objects were determined by measuring lengths and widths from contour plots at a contour level , corresponding to a surface brightness of 24.75 mag arcsec-2. Ellipse fits were made using the IRAF task ellipse, in which we specified the central coordinate and the approximate ellipticity and position angle, and stepped 1 pixel in radius. Not all galaxies could be well fit by the ellipse task; 36 of the 186 galaxies in our exponential disk sample failed to converge. We examined the contour plots and images in order to provide a check on the parameters obtained from the ellipse fits.
Galaxies were considered to be clearly barred if they looked barred on grayscale images and contour plots, and also had a maximum ellipticity accompanied by a change in position angle at the same radius. Galaxies with poor pixel resolution often did not have clear bars on gray scale images, but if they still had contours that twisted in the centers, as in clearly barred galaxies, we considered them to be bar-like anyway. We refer to this latter type as galaxies with inner isophotal twists.
3 Results
3.1 Barred and Inner Twist Galaxies in the Tadpole Deep Field
Barred and inner-twist galaxies found in the deep Tadpole Galaxy field are listed in Table 1. The galaxy number and redshift are from Benitez et al. (2004); the bar type, size, exponential scale length, ratio of axes, and apparent I-band magnitude are from our measurements. The apparent I-band magnitude is measured down to of the noise, which is mag arcsec2. The absolute magnitude comes from the distance modulus, which is given by the equation (Carroll, Press, & Turner 1992)
| (1) |
We assume the cosmology determined from WMAP (Spergel et al. 2003): , , and km s-1 Mpc-1. Entries at the bottom of the table were not catalogued by Benitez et al. (2004) because they are close to the Tadpole Galaxy or near a bright star. Instead of giving a Benitez et al. catalog number for these, we give in the table notes the coordinates in RA and DEC for epoch 2000.
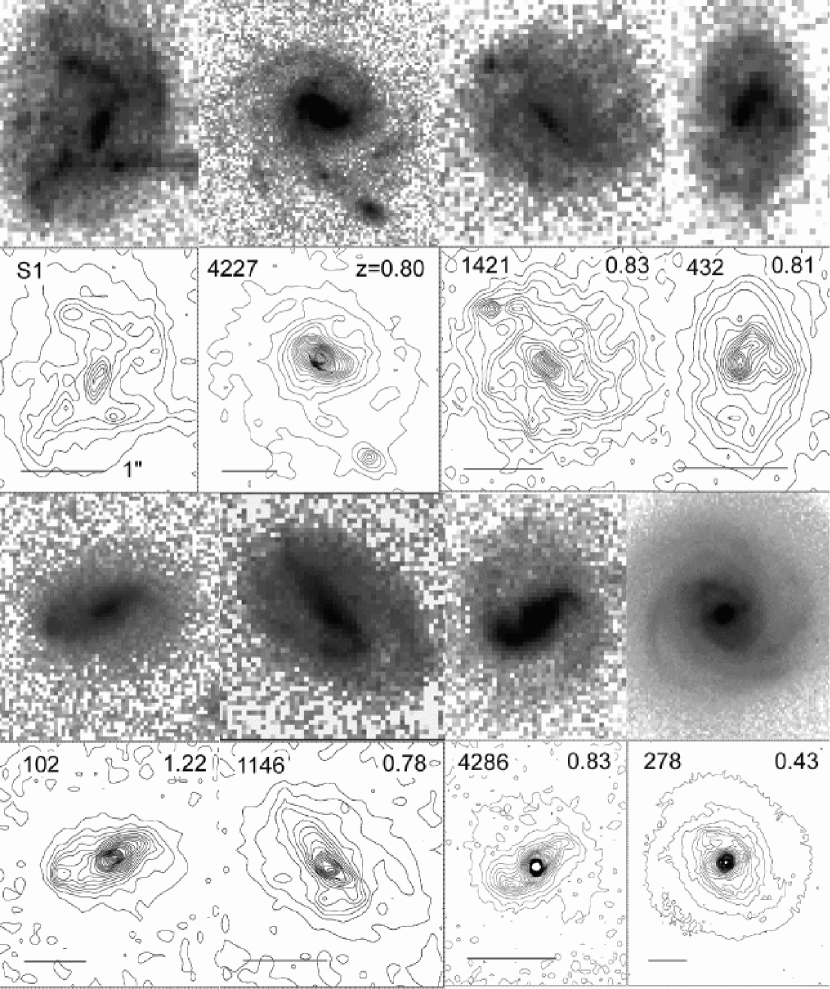
Figure 1 shows a sample of I-band images of 8 barred galaxies in logarithmic grayscale and linear contour plots. Most look like normal galaxies in the nearby Universe, having spirals outside the bars, some of which are grand-design spirals, and end-of-bar enhancements to star formation. The galaxies are named by Benitez et al. number (except for S1), and the redshifts and scales are indicated. The nicest grand design spirals in this figure are numbers 4227, 102, 1146, and 4286, with redshifts between 0.78 and 1.22. van den Bergh et al. (2000) noted that grand design galaxies are rare beyond , although they showed one at . The bars in our survey also extend to higher than the limit of found by van den Bergh et al. (2000).
Figure 2 illustrates ellipse and position angle fits to the light distribution in galaxy 1146, not corrected for projection. The end of the bar at 11 pixels is evident from the change in the position angle and decrease in ellipticity as the bar ends and the spirals begin beyond this radius. Figure 2 also shows the average disk light profile, obtained from the ellipse fits; it is approximately exponential, as is the light profile along the bar (not shown). The maximum projected ellipticities for our barred galaxies are between 0.35 and 0.72.
Figure 3 shows the effects of inclination on bar recognition for galaxies in our survey (top left) and for all of the spiral galaxies in the Third Reference Catalogue of Bright Galaxies (RC3, de Vaucouleurs et al. 1991). The plotted quantity for the RC3 survey is the fraction of all spiral galaxies with T types 1 through 9 ( for Sa, 2 for Sab, etc.) that were also classified as type SB. Each curve is for a different T type. Statistical errors determined from for fraction and total number are all around for RC3 galaxies and are not shown. Many of the RC3 galaxies with T types have no bar type classification (SA, SAB, or SB) so the plotted fraction represents a lower limit to the bar fraction. The decrease in bar fraction for decreasing ratio of minor to major axis, , indicates that bars are hard to recognize in edge-on galaxies. The same difficulty apparently arises for the Tadpole field, where statistical errors, determined in the same way as for the RC3 sample, are shown. Errors in measurement of either or are approximately one pixel, so is accurate to better than 10% for typical inclinations and sizes. Surface brightness dimming with z reduces and together if the ellipticity on a contour diagram is independent of radius. For barred galaxies, the ellipticity strongly depends on radius in the inner regions but varies weakly in the outer regions where we measure .
A random distribution of thin circular disks would have a uniform distribution of down to the ratio of the intrinsic disk thickness to the diameter, with a slight bump at this lower limit before it drops to zero (Sandage, Freeman, & Stokes 1970; Paper II). If there are in fact equal numbers of galaxies in equal intervals of , and the actual presence of a bar is independent of our perspective, then the gap between the curve and the asymptote at high is the result of unrecognized bars. We calculate from the RC3 plots that between % of the late type galaxies and % of the early type galaxies have bars that are missing because of high inclinations. The asymptotic SB fractions are taken from the averages for and are plotted in Figure 4 below.
Based on the upper left panel in Figure 3, %–50% of the galaxies in the Tadpole field have missing bars because of high inclinations. These limits come from the gradual rise in the bar fraction with : If we consider the average barred fraction for the most face-on half, with , to be representative of the intrinsic barred fraction, and use the relative drop in the average for as an indication of the missing barred fraction, then we get 25%. If we consider the peak barred fraction at to be indicative of the intrinsic fraction, and consider everything below this fraction to be missing, then we get 50%.
Evidently, deep field bars are harder to recognize at low inclination than nearby bars. This is probably because deep field bars are closer to the detection limits imposed by pixel size and surface brightness than local bars. The ratio of these two missing-bar fractions should be the correction factor to the relative number of bars in the Tadpole field compared to the local field resulting from more sensitive inclination losses in the Tadpole field. This correction depends on which local Hubble type is used for comparison.
The asymptotic barred galaxy fraction at high in the Tadpole field is % for the bars alone and % for the combined bars and inner twist galaxies. The asymptotic fractions for RC3 galaxies of types SB (solid lines), SAB (dashed lines), and SA (dotted lines) are plotted in Figure 4. In each case, the bottom curve is the fraction relative to the total number of galaxies having the same spiral T type in the RC3, and the top curve is the fraction relative to the total number having any SB, SAB, or SA type within that T type (not all galaxies with spiral T types have classified bar types). There is either a bias in the RC3 or an intrinsic difference in bar structures such that intermediate Hubble types (T corresponding to Sbc, Sc, and Scd) are more likely to be classified SAB than SB compared to early and late Hubble types. This same pattern of optical bar fraction versus T type was shown by Eskridge et al. (2000) using a smaller sample of 186 RC3 galaxies. To make Figure 4, we determined the averages using only RC3 galaxies with , i.e., using only the most face-on half of the sample, for which the bar type is most evident. There are 7134 spiral galaxies with classified T types and in the RC3 and 12471 spiral galaxies with classified T types and . The bar fractions in Figure 4 are slightly higher than those usually estimated from the RC3 because we do not include the low inclination galaxies, which have a higher probability that their bars are not recognized.
Eskridge et al. (2000) obtained an SB fraction of 56% and an SAB fraction of 16% averaged over all of the spiral T types and inclinations in their sample of 186 galaxies taken in the H band. van den Bergh et al. (2002) classified 101 local galaxies according to the DDO system and obtained a local bar fraction (equivalent to SB here) of 28% in optical bands, again averaging over spiral type and inclination. van den Bergh et al. (2002) also blurred their galaxies to resemble galaxies observed with 0.04 arcsec resolution (comparable to the pixel size of the Tadpole field, which is 0.05 arcsec). The SB fraction dropped to 19% with this blurring, suggesting that % of local bars would be unrecognized at .
The distributions of angular size for the barred and inner twist galaxies in the Tadpole field are shown in Figure 5. The scale in arcsec is shown on the bottom axis and the scale in pixels is on the top. The bar fraction increases with angular size because bars with more pixels are easier to recognize. Also, the bars in galaxies with large angular sizes are easily recognized as bars in both the grayscale images and in contour plots. The counts for these clear bars are drawn as dashed lines in the figure. At the largest angular sizes, all of the bars are clear bars. The counts for galaxies whose bars could only be recognized as twisted inner isophotes on contour plots are added to the clear-bar counts in the figure, and this sum is drawn as a solid line. Galaxies with small angular sizes tend to show only the inner twisted isophotes without any clear bar on the grayscale images, so the left-hand part of the figure is dominated by these solid lines.
A histogram of absolute galaxy diameter for the Tadpole field is shown in the top left of Figure 6. The conversion from angular size and galaxy redshift to physical size was made from the equation (Carroll, Press, & Turner 1992)
| (2) |
The diameter is taken to be the major axis of the second isophotal contour, which is above zero for rms noise . The other panels in Figure 6 are for all SB type galaxies in the RC3, using the radial velocities with km s-1 Mpc-1 and the corrected face-on diameters. Figure 6 indicates that most of the galaxies in the Tadpole field are about half the size of the local galaxies with early and intermediate Hubble types. The Tadpole field galaxies have sizes comparable to the latest-type local galaxies, for type SBm. There is a tendency for the clearest bars in the Tadpole field (dotted line) to be in the largest galaxies. Small galaxies in the Tadpole field may also have bars, but they show up in our data only as inner isophotal twists (pure solid lines).
The small sizes of the high-z galaxies could be the result of surface brightness dimming, but the actual values of the surface brightnesses suggest this is not the case. Equations 1 and 2 combine to predict surface brightness dimming varies as in mag arcsec-2, which is the standard result (e.g., Lubin & Sandage 2001). For between 0.5 and 1.2 as in this sample, the dimming is between 1.8 and 3.4 mag arcsec-2. Each magnitude of dimming corresponds to a loss of approximately one exponential scale length from the outer part of a galaxy, and since typical galaxy disks in the local Universe have scale lengths out to 25 mag arcsec-2, a dimming of 2 mag arcsec-2 would cut the galaxy in half. However, Figure 2 shows a galaxy that has more than 4 exponential scale lengths, as do many others in our survey (see next paragraph). In addition, the 2 contour limit used for the galaxy size corresponds to 24.75 mag arcsec-2 in I band, which is comparable to B or V bands for more local galaxies where the radius at 25th mag arcsec-2 is measured. Corrected for dimming, the restframe outer contour at high would be mag arcsec-2 or brighter in most cases, suggesting that the high-z galaxies in our survey are selectively brighter than local galaxies. As this restframe brightening offsets the cosmological dimming, the physical sizes of the Tadpole-field barred galaxies in our study really are small. This is consistent with other studies that show surface brightness evolution for disk galaxies with z-dependent restframe properties (Bouwens & Silk 2002). It differs from studies (Simard et al. 1999; Ravindranath et al. 2004) that do not show surface brightness or size evolution, but in those cases the galaxies are selected to have the same restframe properties. Our sample is too small to make this selection; i.e. we do not see a population of high-z barred galaxies that have restframe surface brightnesses comparable to those of local barred galaxies. There is no way to tell from this survey if such a barred population is present, and, if it is, whether it has the same proportion to non-barred galaxies as the high surface-brightness population studied here.
To check the sizes of high-z barred galaxies another way, we measured the exponential scale lengths for each of the 22 clear bars and 21 inner twist galaxies using ellipse fits in the I band. The scale lengths are independent of dimming. The results are in Table 1 and a histogram is in Figure 7. The average scale length is kpc, comparable to that found in recent simulations of disk galaxy formation (Robertson et al. 2004), but smaller than in the Milky Way and other local galaxies by a factor of . The average ratio of the major axis to the scale length for the Tadpole field barred galaxies is 7.2, and the average ratio for the inner twist galaxies is 5.6. These ratios are normal compared with local galaxies, considering a Freeman central surface brightness of 21.6 mag arcsec-2 in B band and an outer radius at 25 mag arcsec-2 in B band. The local numbers give an average of scale lengths in the disk and a corresponding ratio of major axis to scale length equal to . The similarity between the numbers of scale lengths in the local and Tadpole field disks implies the distant galaxies are not truncated significantly by surface brightness limits. Thus, Figures 6 and 7 both imply the Tadpole field galaxies are intrinsically small.
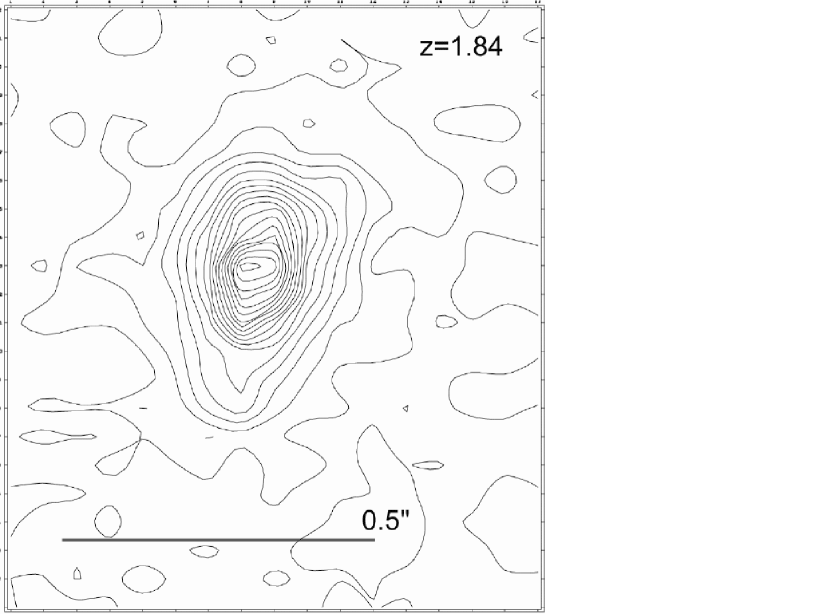
The distributions of the disk galaxy types: non-barred (A), inner twist (T), barred (B), and barred clump-cluster galaxies (Bcc), are shown as a function of redshift in Figure 8. The points on the ordinate are given a random offset to avoid overlaps. The bars seem to stop at , but this is probably because the ability to resolve and recognize distant bars diminishes. For example, the galaxy at in Figure 1 clearly shows a bar even in this restframe blue to uv passband, but the bar is only pixels long and beginning to get lost in the pixel noise. Galaxies with inner isophotal twists continue up to , and this galaxy, which is number 3555 in Benitez et al (2004), is shown in Figure 9. The greater limit for twist galaxies is consistent with Figures 5 and 6, where the smallest angular-size galaxies show only isophotal twists without obvious bars. There is a good correlation between angular size and in our data in the sense that high galaxies have systematically smaller angular sizes (see crosses in Fig. 10).
The bar fraction is shown as a function of redshift in Figure 10. The average major-axis galaxy angular size in arcsec is plotted for each redshift bin as a cross. The numbers above the bins are the total numbers of galaxies. The bar fraction is approximately constant with redshift out to , having values between 0.2 and 0.4. Corrections for inclination could double this fraction (see Fig. 3).
Lookback time is given on the top axis of Figure 10. This is calculated from the equation (Carroll, Press, & Turner 1992)
| (3) |
Lookback time is useful for estimating whether the clumps in these galaxies are old enough to make bulges if they coalesce, and for assessing the epoch of bar formation (see discussion section).
3.2 Clumpy-Bar Galaxies and Barred Clump-Cluster Galaxies
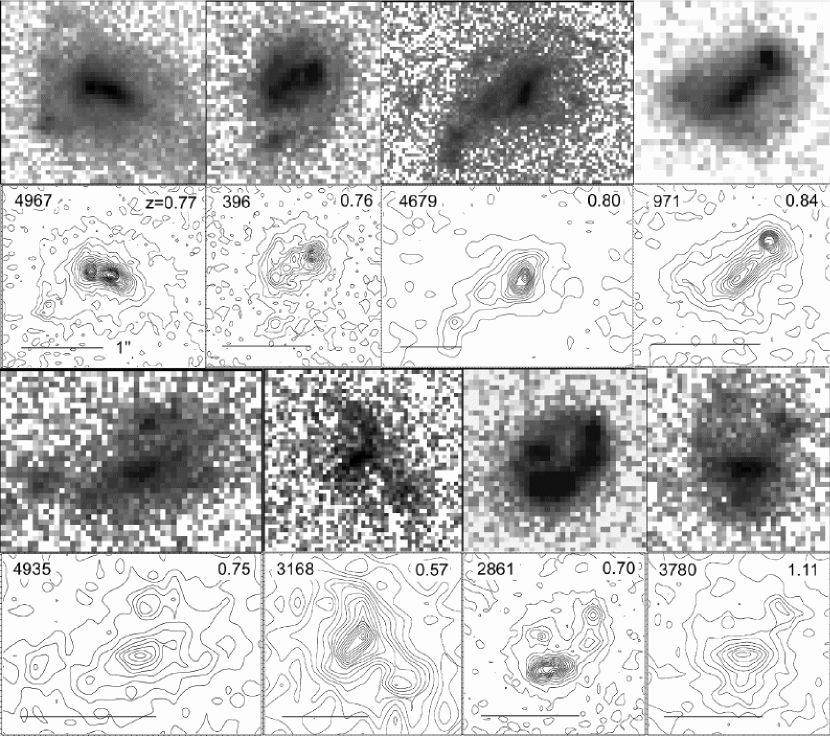
In our survey of barred galaxies in the Tadpole field, we noticed several galaxies with exponential disks and very clumpy bars, and several others with purely clumpy disks (called clump clusters in Paper II) and bar-like objects in those disks. In this paper, we have called these two odd cases clumpy-bar galaxies and barred clump-cluster galaxies, respectively. The clumpy-bar galaxies are from the sample of 186 exponential disk galaxies, whereas the barred clump-cluster galaxies are from the sample of 86 clump-cluster galaxies, which do not have exponential disks, as studied in Paper II.
Figure 11 shows 8 examples of these unusual cases. Table 1 gives the properties of the two clumpy-bar galaxies (numbers 4967 and 396), and Table 2 has the 11 barred clump-cluster galaxies.
Figure 12 shows the relative surface brightness profiles in two of these galaxies using the task pvector in IRAF for a strip 3 pixels wide across the galaxy image. The orientation of each strip was approximately along the major axis. Galaxy 4967 is a clumpy-bar galaxy and is shown at the top left in Figure 11. Galaxy 3168 is a barred clump-cluster galaxy and is shown as the second image from the left on the bottom of Figure 11. The exponential-like profile in galaxy 4967 is evident, as is the lack of a similar profile in galaxy 3168. This lack of an exponential profile defines the clump-cluster and chain galaxy types (Papers I and II).
4 Discussion
The results in the previous section suggest there are normal barred galaxies up to at least a redshift of . There are also bars or bar-like regions in exponential-disk galaxies that are mostly composed of bright clumps, and there are bar-like regions inside completely clumped galaxies, which we have called clump-clusters. Beyond , bars become indistinct because the galaxies have small angular sizes and the rest passband goes into the ultraviolet where bars are not prominent (e.g., Sheth et al. 2003). Nevertheless, we still see galaxies out to that appear to contain bars in the form of isophotal twists in their inner regions (Fig. 9).
The time interval corresponding to the histogram interval in Figure 10, namely , becomes comparable to the formation time of a bar near (i.e., years). Thus the bar fraction should begin to vary with significantly at this point for physical reasons, and the bar morphology should vary too if some bars are only part-way to formation. Galaxies that form disks late push back this epoch of bar irregularity to lower . Our clumpy bars and barred clump-clusters could be in this category.
The bar fraction between and varies between 0.2 and 0.4. The average fraction for clear bars determined from the total number of them (18) divided by the total number of disk galaxies out to (159) is . The average fraction for galaxies whose only evidence for a bar is an inner twisted isophote is the same because the number of these cases is also 18. The average fraction for both together is .
These bar or twist fractions are smaller than the local SB fraction from Figure 4, which ranges from for early type galaxies to for intermediate to late Hubble types. The Tadpole field bar fraction requires upward corrections, however. We suggested on the basis of Figure 5 that the smallest galaxies in our sample could have bars that are not recognized, whereas this is not a problem in the local sample. We also suggested on the basis of Figure 3 that the loss of bars to inclination effects is greater in the Tadpole field than for local galaxies. Thus our recognition fraction for bars in the deep field is less than for local bars, perhaps by a factor of 2. For the least inclined sub-sample in Figure 3, and the largest angle subsample in Figure 5, the bar plus twist fraction is , with most of the bar-like galaxies actually showing their bars clearly in the grayscale images of the big or face-on galaxies. This corrected bar fraction is about the same as the local SB fraction from Figure 4.
The small absolute sizes of the barred galaxies in Figures 6 and 7, combined with the apparently normal bar fractions at high , seem to rule out models in which disk galaxies continue to build up by mergers after . A merger will destroy a disk, so none of the small barred disk galaxies studied here can turn into bigger disk galaxies today after significant mergers. They either remain small, grow by gradual, non-disruptive accretions, or turn into ellipticals after a merger.
The nearly constant bar fraction with combined with the theoretical (Noguchi 1987, Gerin, Combes & Athanassoula 1990; Berentzen et al. 2004) and observational (Elmegreen, Elmegreen, & Bellin 1990) evidence that close interactions (not mergers) form bars, also suggests that most galactic bars have not been destroyed over a Hubble time. If they did dissolve in significantly less than a Hubble time, then the bar fraction should be the result of an equilibrium between formation and destruction rates. As the interaction rate was probably much higher in the past than today, the bar formation rate was probably higher too. Thus the bar fraction should have been higher in the past if interactions were an important bar-formation process and self-destruction followed formation in significantly less than a Hubble time (as it does, for example, in models by Bournaud & Combes 2002). The constant bar fraction over time suggests there has been relatively little bar destruction.
This conclusion differs from that of Block et al. (2002) and Das et al. (2003) who suggest observations support the bar dissolution theory. Block et al. based this conclusion on the lack of local galaxies with smooth stellar disks (the opposite of a lack of bars, as might be expected) and noted that simulations require significant gas accretion to keep stellar spirals present. Then they concluded that such accretion could also rejuvenate bars if they were previously dissolved, but did not offer any evidence, aside from the usual simulation results, that real bars have dissolved. Das et al. found an inverse correlation between ellipticity and relative mass concentration in the centers of barred galaxies, and noted that such a correlation is predicted by simulations which show a progression in this direction during nuclear gas accretion. However, there was no evidence that this progression has gone so far in any real galaxy to have dissolved its bar, as it does in simulations. One wonders if the balance between viscous accretion and star formation in galaxy simulations is a fair representation of the balance in real galaxies, where the interstellar medium is far more complicated with supersonic turbulence and magnetic fields.
The uncertainty of the present observations regarding bar dissolution involves sampling biases. The small sizes and high restframe surface brightnesses of our barred galaxies suggest they may be only a subsample of high-z barred galaxies. If the barred fraction of the missing (i.e., low surface brightness) galaxies is the same as in the sample here, then our conclusion about bar dissolution should hold. But if the missing galaxies have a higher bar fraction than the local value, then some bar dissolution might have occurred over a Hubble time.
Figures 8, 11 and 12 suggest there are a significant number of bar-like structures out to at least that are very clumpy or located at non-central places in very clumpy disks. These morphologies suggest that some bars form in gas-rich disks by dynamical instabilities in the gas (Mayer & Wadsley 2004), and that these instabilities may also trigger a large amount of star formation (the blue colors of the large clumps in chain galaxies and clump-clusters were discussed in Papers I and II). The look-back times in Figure 10 are typically half the Hubble time for these cases, which implies that some bars formed late. If the stars in these bars formed at the same time, then the present day versions of these galaxies should have somewhat young-looking bars ( Gyr old). In addition, if these bars dissolve and form bulges, then the bulges should contain relatively young stars too.
5 Conclusions
I-band images of the deep field of the Tadpole galaxy suggest the fraction of barred galaxies is approximately constant, out to . Beyond this, we cannot observe bars easily because of inadequate angular resolution and rest-frame color shifts, but galaxies with inner twisted isophotes continue out to . The observed bar fraction decreases with increasing galaxy inclination, as it does for local galaxies, and it decreases for smaller angular sizes as the bar lengths become comparable to the resolution. Correcting for these losses, we estimate that the bar fraction in the Tadpole deep field is out to , and we point out that this fraction is comparable to the local bar fraction, depending on Hubble type. If the bar fraction is indeed constant with time, and if a significant fraction of bars form during galaxy interactions (which were more frequent in the past), then most bars do not dissolve in a Hubble time following secular evolution.
The physical sizes and exponential scale lengths in the Tadpole field barred galaxies are comparable to the sizes of local type SBm galaxies. Cosmological dimming is probably not affecting this result because the restframe surface brightnesses of the distant galaxies are larger than for local galaxies, and because the number of scale lengths in a galaxy major axis is about the same as in local galaxies. If the distant galaxies grow into today’s galaxies, then this growth has to be gentle enough to avoid disrupting the disks.
Eleven examples of bar-like structures were found in clump-cluster galaxies, which are probably face-on versions of chain galaxies (Paper II). These systems are not present in the same form in the modern Universe and may represent an early stage in disk galaxy formation and bar formation. If so, then some bars would seem to be able to form by large-scale instabilities in primarily gaseous disks. Other odd cases included very clumpy bars in disk galaxies that have approximately exponential radial profiles. These could also be examples where bars are forming in the presence of a significant amount of gas, producing a few very bright star-formation clumps as an intermediate step.
Acknowledgments: We are very grateful to J. Blakeslee, H. Ford, and J. Mack of the ACS team for providing up-to-date fully reduced combined images in advance of public release. Helpful comments by the referee are appreciated. The contribution by B.G.E. was partially funded by NSF Grant AST-0205097.
References
- (1) Abraham, R. G., Merrifield, M. R., Ellis, R. S., Tanvir, N. R., & Brinchmann, J. 1999, MNRAS, 308, 569
- (2) Debattista, V.P., Carollo, C.M., Mayer, L., & Moore, B. 2004, ApJ, 604, L93
- (3) Benitez, N. et al. 2004, ApJS, 150, 1
- (4) Berentzen, I., Athanassoula, E., Heller, C.H., Fricke, K.J.2004, MNRAS, 347, 220
- (5) Block, D. L., Bournaud, F., Combes, F., Puerari, I., & Buta, R. 2002, A&A, 394, L35
- (6) Bournaud, F., & Combes, F. 2002, A&A, 392, 83
- (7) Bouwens, R., & Silk, J. 2002, ApJ, 568, 522
- (8) Blakeslee, J., Anderson, K., Meurer, G., Benitez, N., & Magee, D. 2003, in Astronomical Data Analysis Software and Systems XII, ASP Conference Series, Vol. 295, H. E. Payne, R. I. Jedrzejewski, and R. N. Hook, eds., p.257
- (9) Carroll, S.M., Press, W.H., & Turner, E.L. 1992, ARAA, 30, 499
- (10) Casertano, S. et al. 2000, AJ, 120, 2747
- (11) Combes, F. & Sanders, R.H., 1981, A&A, 96, 164
- (12) Cowie, L., Hu, E., & Songaila, A. 1995, AJ, 110, 1576
- (13) Das, M., Teuben, P.J., Vogel, S.N., Regan, M.W., Sheth, K., Harris, A.I., & Jefferys, W.H. 2003, ApJ, 582, 190
- (14) Elmegreen, D.M., Elmegreen, B.G., & Bellin, A.D. 1990, ApJ, 364, 415
- (15) Elmegreen, D.M., Elmegreen, B.G., & Sheets, C.M. 2004, ApJ, 603, 74 (Paper I)
- (16) Elmegreen, D.M., Elmegreen, B.G., & Hirst, A.C. 2004, ApJ, 604, L21 (Paper II)
- (17) Eskridge, P.B. et al. 2000, AJ, 119, 536
- (18) Friedli, D., & Martinet, L. 1993, A&A, 277, 27
- (19) Friedli, D., Wozniak, H., Rieke, M., Martinet, L., & Bratschi, P. 1996, A&AS, 118, 461
- (20) Gerin, M., Combes, F., & Athanassoula, E. 1990, A&A, 230, 37
- (21) Hasan, H., & Norman, C. 1990, ApJ, 361, 69
- (22) Immeli, A., Samland, M., Gerhard, O., & Westera, P. 2004a, A&A, 413, 547
- (23) Immeli, A., Samland, M., Gerhard, O., & Westera, P. 2004b, submitted
- (24) Lubin, L.M., & Sandage, A. 2001, AJ, 122, 1084
- (25) Jogee, S. et al. 2003, BAAS, 203, 131.07
- (26) Mayer, L., & Wadsley, J. 2004, MNRAS, 347, 277
- (27) O’Neil, K., Bothun, G.D., & Impey, C.D. 2000, ApJS, 128, 99
- (28) Noguchi, M. 1987, MNRAS, 228, 635
- (29) Noguchi, M. 1996, ApJ, 514, 77
- (30) Pfenniger, D. 1999, in The Formation of Galaxy Bulges, eds. C.M. Carollo, H.C. Ferguson, & R. F.G. Wyse, (Cambridge: Cambridge University Press), 95
- (31) Pfenniger, D., & Norman, C. 1990, ApJ, 363, 391
- (32) Ravindranath, S., et al. 2004, ApJ, 604, L9
- (33) Robertson, B., Yoshida, N., Springel, V., Hernquist, L. 2004, ApJ, 606, 32
- (34) Sandage, A., Freeman, K.C., & Stokes, N.R. 1970, ApJ, 160, 831
- (35) Sellwood, J. A., & Wilkinson, A. 1993, Rep. Prog. Phys., 56, 1
- (36) Sheth, K., Regan, M.W., Scoville, N.Z., & Strubbe, L.E. 2003, ApJ, 592, 13
- (37) Simard, L., Koo, D.C., Faber, S. M., Sarajedini, V. L., Vogt, N. P., Phillips, A. C., Gebhardt, K., Illingworth, G. D., & Wu, K. L. 1999, ApJ, 519, 563
- (38) Spergel, D.N., et al. 2003, ApJS, 148, 175
- (39) Tran, H. et al., 2003, ApJ, 585, 750
- (40) van den Bergh, S., Abraham, R. G., Ellis, R. S., Tanvir, N. R., Santiago, B., & Glazebrook, K. G. 1996, AJ, 112, 359
- (41) van den Bergh, S., Cohen, J., Hogg, D. W., & Blandford, R. 2000, AJ, 120, 2190
- (42) van den Bergh, S., Cohen, J., & Crabb, C. 2001, AJ, 122, 611
- (43) van den Bergh, S., Abraham, R.G., Whyte, L.F., Merrifield, M.R., Eskridge, P.B., Frogel, J.A., & Pogge, R. 2002, AJ, 123, 2913
- (44) de Vaucouleurs, G., de Vaucouleurs, A., Corwin, H., Buta, R., Paturel, G., & Fouque, P. 1991, Third Reference Catalogue of Galaxies, New York: Springer-Verlag
- (45) Williams, R.E. et al. 1996, AJ, 112, 1335
- (46) Windhorst, R.A. 2002, ApJS, 143, 113
| ID | Bar | z | Diam. | Diam. | Scale Length | Scale Length | W/L | ||
|---|---|---|---|---|---|---|---|---|---|
| Type | (arcsec) | (kpc) | (arcsec) | (kpc) | |||||
| 102 | B | 1.22 | 2.45 | 20.6 | 0.49 | 4.1 | 0.81 | 21.8 | -22.9 |
| 127 | T | 0.66 | 2.68 | 18.8 | 0.30 | 2.1 | 0.72 | 21.2 | -21.9 |
| 234 | B | 0.14 | 6.08 | 15.7 | 0.67 | 1.7 | 0.70 | 20.0 | -19.2 |
| 241 | T | 0.38 | 3.97 | 20.9 | 0.44 | 2.3 | 0.53 | 19.7 | -21.9 |
| 278 | B | 0.43 | 7.56 | 42.8 | 0.62 | 3.5 | 0.94 | 18.6 | -23.3 |
| 396 | T | 0.76 | 1.70 | 12.6 | 0.68 | 5.1 | 0.72 | 22.6 | -20.8 |
| 431 | T | 0.19 | 2.24 | 7.3 | 0.79 | 2.6 | 0.60 | 23.0 | -17.0 |
| 432 | B | 0.81 | 1.95 | 14.8 | 0.32 | 2.5 | 0.70 | 22.6 | -21.0 |
| 448 | B | 0.33 | 1.91 | 9.2 | 0.33 | 1.6 | 0.50 | 24.5 | -16.8 |
| 700 | B | 0.44 | 2.83 | 16.3 | 0.30 | 1.8 | 0.58 | 22.4 | -19.6 |
| 770 | B | 1.09 | 1.46 | 12.0 | 0.19 | 1.5 | 0.72 | 22.7 | -21.7 |
| 828 | B | 0.57 | 1.91 | 12.5 | 0.26 | 1.7 | 0.43 | 23.2 | -19.4 |
| 848 | B | 0.28 | 1.84 | 7.9 | 0.37 | 1.6 | 0.90 | 22.6 | -18.3 |
| 1146 | B | 0.78 | 2.33 | 17.5 | 0.42 | 3.2 | 0.64 | 22.4 | -21.0 |
| 1245 | T | 0.35 | 1.29 | 6.5 | 0.18 | 0.9 | 0.79 | 23.5 | -17.9 |
| 1247 | T | 0.92 | 1.42 | 11.2 | 0.27 | 2.1 | 0.38 | 24.4 | -19.5 |
| 1421 | B | 0.83 | 2.55 | 19.5 | 0.51 | 3.9 | 0.84 | 22.6 | -21.1 |
| 1904 | T | 0.88 | 1.30 | 10.2 | 0.24 | 1.9 | 0.48 | 24.3 | -19.5 |
| 2155 | T | 0.88 | 1.81 | 14.1 | 0.24 | 1.9 | 0.68 | 22.4 | -21.4 |
| 2555 | T | 0.25 | .99 | 3.9 | 0.20 | 0.8 | 0.90 | 23.6 | -17.0 |
| 2588 | B | 1.11 | 1.38 | 11.4 | 0.24 | 2.0 | 0.60 | 23.2 | -21.2 |
| 2694 | B | 0.07 | 4.83 | 7.2 | 0.70 | 1.0 | 0.63 | 20.1 | -17.7 |
| 2810 | T | 0.84 | 1.39 | 10.7 | 0.20 | 1.5 | 0.67 | 23.6 | -20.0 |
| 2845 | B | 0.69 | 1.85 | 13.3 | 0.31 | 2.2 | 0.98 | 21.7 | -21.4 |
| 3483 | T | 0.26 | 1.24 | 5.1 | 0.24 | 1.0 | 0.65 | 23.9 | -16.7 |
| 3555 | T | 1.84 | .75 | 6.4 | 0.16 | 1.3 | 0.74 | 24.7 | -21.1 |
| 3983 | T | 0.71 | 1.54 | 11.2 | 0.30 | 2.2 | 0.85 | 23.2 | -20.0 |
| 4129 | B | 0.24 | 3.14 | 12.2 | 0.52 | 2.0 | 0.65 | 21.7 | -18.8 |
| 4227 | B | 0.80 | 3.70 | 28.0 | 0.32 | 2.4 | 0.66 | 21.4 | -22.1 |
| 4286 | B | 0.83 | 2.27 | 17.4 | 0.24 | 1.8 | 0.90 | 22.0 | -21.6 |
| 4451 | T | 0.44 | .60 | 3.4 | 0.25 | 1.4 | 0.70 | 24.8 | -17.2 |
| 4777 | T | 1.15 | 1.19 | 9.9 | 0.19 | 1.6 | 0.66 | 23.7 | -20.9 |
| 4818 | T | 0.75 | .59 | 4.4 | 0.27 | 2.0 | 0.84 | 24.4 | -19.0 |
| 4918 | B | 0.80 | 1.12 | 8.4 | 0.15 | 1.1 | 0.62 | 24.1 | -19.5 |
| 4967 | T | 0.77 | 1.76 | 13.2 | 0.34 | 2.6 | 0.73 | 22.4 | -21.1 |
| 5001 | T | 1.09 | 1.21 | 10.0 | 0.23 | 1.9 | 0.68 | 23.5 | -20.9 |
| 5182 | T | 0.75 | 2.80 | 20.7 | 0.38 | 2.8 | 0.28 | 23.1 | -20.2 |
| 5286 | B | 0.76 | 4.00 | 29.7 | 0.57 | 4.3 | 0.63 | 21.6 | -21.8 |
| S1 | B | x | 3.00 | x | 0.72 | x | 0.74 | 21.8 | x |
| S2 | B | x | 3.95 | x | 0.78 | x | 0.57 | 21.2 | x |
| S3 | B | x | 5.46 | x | 0.45 | x | 0.38 | 20.6 | x |
| S4 | T | x | 3.12 | x | 0.57 | x | 0.38 | 21.3 | x |
| S5 | T | x | 3.25 | x | 0.41 | x | 0.89 | 20.5 | x |
Note. — ID numbers and redshifts are from Benitez et al. (2004). Bar type B is for a clearly barred galaxy, T is for a galaxy without a clear bar but with an inner isophotal twist indicative of a possible bar. Diameters in kpc are from Eq. 2. is the isophotal width to length ratio. is the AB isophotal magnitude in the F814W filter. Galaxies S1-5 are spiral galaxies not cataloged by Benitez et al. because they are close to the Tadpole galaxy or bright stars. The ’s indicate there are no redshifts or redshift-derived properties for these galaxies. Their coordinates (J2000) are: S1 = , S2 = , S3 = , S4 = , S5 = .
| ID | z | Diameter | Diameter | W/L | ||
|---|---|---|---|---|---|---|
| (arcsec) | (kpc) | |||||
| 91 | 0.32 | 1.22 | 5.8 | 0.85 | 22.8 | -18.4 |
| 689 | 0.98 | 3.83 | 30.8 | 0.51 | 21.2 | -22.9 |
| 971 | 0.84 | 1.28 | 9.9 | 0.87 | 23.2 | -20.5 |
| 1253 | 1.14 | 1.42 | 11.8 | 0.84 | 22.9 | -21.6 |
| 2861 | 0.70 | 1.41 | 10.2 | 0.80 | 23.1 | -20.1 |
| 3168 | 0.57 | 1.20 | 7.9 | 0.70 | 24.0 | -18.7 |
| 3429 | 1.30 | 1.69 | 14.3 | 0.53 | 23.3 | -21.6 |
| 3780 | 1.11 | 1.37 | 11.3 | 0.86 | 23.7 | -20.8 |
| 4679 | 0.80 | 2.98 | 22.5 | 0.34 | 22.6 | -20.9 |
| 4903 | 0.08 | 1.34 | 2.2 | 0.82 | 23.1 | -15.0 |
| 4935 | 0.75 | 1.89 | 14.0 | 0.49 | 23.5 | -19.8 |
Note. — ID numbers and redshifts are from Benitez et al. (2004). is the AB isophotal magnitude in the F814W filter.