Candidates of 5.5–7 Galaxies in the HST Ultra Deep Field
Abstract
We report results from our –7 galaxy search in the HST Ultra Deep Field (UDF). Using the 400-orbit of ACS data, we found 108 plausible (or for short) candidates to mag. The contamination to the sample, either due to image artifacts or known types of astronomical objects, is likely negligible. The inferred surface densities of galaxies are consistent with our earlier predictions from to 28.5 mag. After correcting for detection incompleteness, the counts of candidates to mag suggests that the faint-end slope of the galaxy luminosity function (LF) at this redshift is likely between and , which is sufficient to account for the entire Lyman photon budget necessary to complete the reionization of the universe at . We also searched for –7 candidates using the UDF NICMOS data, and have found four candidates to mag. However, the infrared colors of three candidates cannot be easily explained by galaxies in this redshift range. We tentatively derive an upper limit to the cumulative surface density of galaxies at of 0.36 per arcmin2 to mag, which suggest a noticeable drop in the LF amplitude from to .
1 Introduction
Using the Advanced Camera for Surveys (ACS), a public, ultra-deep survey has been carried out by the Hubble Space Telescope (HST). This Ultra Deep Field (UDF; PI. S. Beckwith) campaign observed a single ACS Wide Field Camera (WFC) field within the Chandra Deep Field South in four broad-bands covering 0.4 to nearly . To enhance the value of these ACS data, the Camera 3 (NIC3) of the Near Infrared Camera and Multi Object Spectrometer (NICMOS) has observed the central portion of this field in the F110W () and the F160W () filters (PI. R. Thompson). With a total exposure of 400 orbits in the ACS and 144 orbits in the NICMOS, the UDF will remain the deepest optical/IR survey field in the coming seven years. Here we discuss the –7 candidates found in this field. We adopt the following cosmological parameters: , , and km sMpc-1. All magnitudes are in AB system.
2 Data and Selection of and Candidates
The total UDF ACS/WFC exposure times are 37.5, 37.6, 96.4, and 96.3 hours in the F435W (), F606W (), F775W (), and F850LP () filters, respectively. The final drizzle-combined stacks have a pixel scale of 0.03, and cover an effective area of 10.34 arcmin2 after trimming off the lower S/N edges. We performed matched-aperture photometry independently using SExtractor (Bertin & Arnouts 1996) in double-input mode with the stack as the detection image. We used a Gaussian convolving kernel with a FWHM of 3 pixels, and required a real detection have a minimum of 5 connected pixels 1.5 above background. The NIC3 UDF program observed a grid that covers the center of the UDF, giving an effective coverage of 5.76 arcmin2 with an average exposure time of 5.97 hours in both the and the filters. The final drizzle-combined stacks have a pixel scale of 0.09′′. We used the photometric catalog that comes with the data release, which was generated based on the detections in the co-added stack using SExtractor. The “MAG_AUTO” option was used in both cases.
We selected candidates as drop-outs in the UDF ACS images. Instead of aiming at and using the color criterion of () mag as in our previous work (Yan, Windhorst & Cohen 2003), we here target at and adopt () mag as the first criterion. In total, 108 objects were selected by using this color criterion alone. These objects were visually examined in all the four bands to ensure that there was no obvious reason (e.g., image defects) to exclude them from the candidate list. The second criterion is that a valid candidate should not be detected in and , i.e., it should either have reported magnitude fainter than 29.5 mag, or have its estimated photometric error larger than 0.54 mag (). All of the 108 candidates satisfy this criterion. The coordinates and the photometric properties of all the 108 candidates are listed in Table 1. These objects seem to be strongly clustered, e.g., we identified 6 multiple systems whose members are within (or co-moving kpc) from each other. The significant fraction of multiple systems might indicate that merging was rather common at .
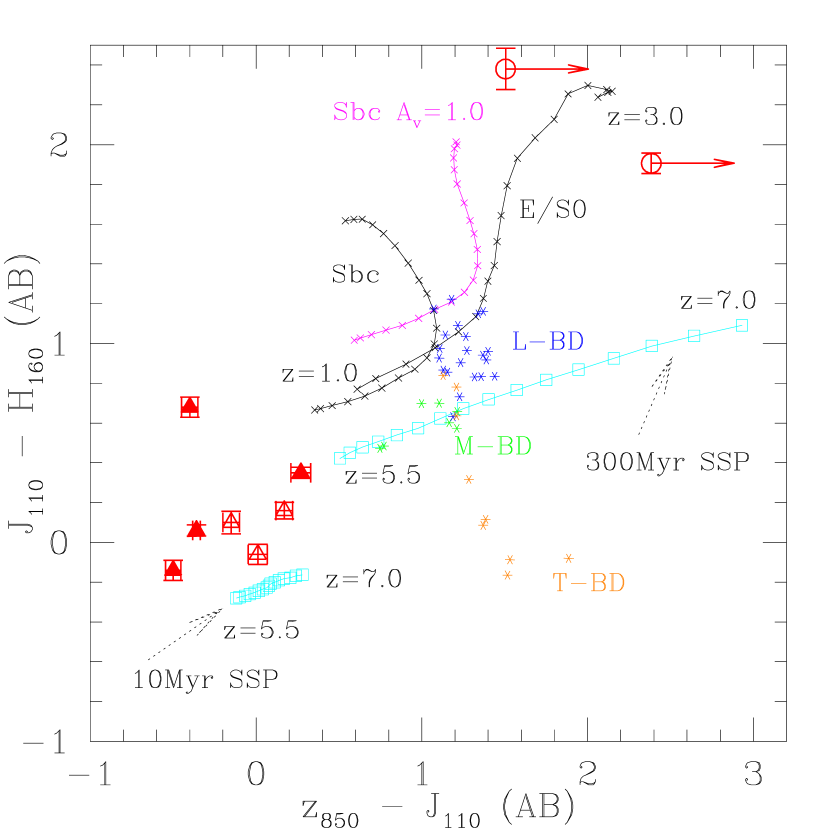
Fifty two of the 108 candidates are within the NIC3 mosaic, among which 12 objects (all at mag) have NIC3 counterparts. Actually, 9 of these 12 objects are in 4 multiple systems, and the coarser pixel resolution of the NIC3 images cannot resolve their individual members and thus identify them as single sources. The colors of these 12 objects (9 sources in 4 multiple systems, and 3 isolated sources) are shown in Fig. 1. The magnitudes of the multiple systems are derived by adding the fluxes of their individual members. The known galaxy (Dickinson et al. 2004) is among these 4 multiple systems (ID 1a in Table 1).
Candidates of objects were selected as -band drop-outs. As the band heavily overlaps with the band, the () color at does not change as dramatically as the () color does at . We adopted the criteria as () mag and () mag, and no detection in ACS , and bands. This search resulted in one source and three drop-outs, all of which were visually inspected and deemed reliable. The coordinates and the photometric properties of the three drop-outs are listed in Table 2. The one source turns out to be the multiple system 7a/7b in Table 1 (i.e., also qualifies as being ), and thus is not listed again.
3 Discussion of the Candidate Sample
3.1 Consistency of the Interpretation
It is known that brown dwarfs can mimic the broad-band colors of a galaxy because of their strong molecular absorption bands. The 4000Å break in elliptical galaxies at –1.5 can also mimic the Lyman-break at (e.g., Yan, Windhorst & Cohen 2003). Lower-z late-type galaxies, even those significantly reddened by dust, generally are not a significant interloper, because their 4000Å breaks are not as strong as those in the early-type galaxies.
The contamination due to brown dwarfs is insignificant in our case, as only 4 of our 108 candidates have SExtractor star/galaxy separation flag larger than 0.90. This flag is 0 for extended sources and 1 for point sources. The colors of typical M-, L-, and T-type brown dwarfs (e.g., Kirkpatrick et al. 1999) are shown in Fig. 1. None of the candidates with NIC3 measurements has IR colors close to the loci of brown dwarfs. The contamination due to elliptical galaxies at 1.0–1.5 is likely also small. While the major color criterion is () 1.3 mag, most of the candidates have () 1.5 mag (90 out of 108), and thus the chance for a low-z elliptical galaxy to be selected as candidate is greatly reduced, since the latter usually have () mag. Further evidence comes from the candidates also detected in NIC3 images. Fig. 1 shows the “color track” of a typical E/S0 galaxy in space, together with the tracks of a Sbc galaxy with and without dust reddening (all templates are from Coleman, Wu & Weedman 1980, and the extinction law is from Calzetti et al. 2000). None of the NIC3 detected candidates has colors close to these low-z tracks. On the other hand, the colors of our candidates are consistent with being , if we consider the systematic photometric errors due to the aperture mismatching between the ACS and the NIC3 photometry, and, more importantly, the variation in the SED of galaxies. While a detailed stellar population synthesis approach is beyond the scope of this Letter, we point out that most of the candidates in Fig. 1 can be well explained by the models of Bruzual & Charlot (2003). For simplicity, Fig. 1 shows the color tracks of the Simple Stellar Population (SSP) models with ages of 10 Myr and 300 Myr, which bracket most of the candidates.
3.2 Photometric Contamination and Correction for Incompleteness
When the search is pushed to very faint levels, contamination due to noise spikes could become severe. To assess the effect due to spurious detections, we performed the “negative source” check as described by Dickinson et al. (2004). The UDF ACS mosaics were inverted, and SExtractor was run on these inverted images using the same parameter settings as in §2. We find only 10 “negative objects” that have , and none of them satisfy our color selection criterion of mag. This is not surprising, because the UDF ACS mosaics were created by stacking a very large number of dithered images (the band mosaic has 288 ditherings), so that the image artifacts are minimal. Therefore, we conclude that spurious detection has a negligible impact to our candidate sample.
Another effect that should be considered is sample incompleteness, which starts to be significant at mag. We note that the -band count histogram peaks at 28.5 mag (), and drops to 50% of this peak value at 29.2 mag (). For our purpose below, it is sufficient to discuss only the incompleteness of the candidates in the intermediate brightness range of 28.529.2 mag. We estimated the incompleteness as following. For each of the 28 candidates in this regime, a pixel image “stamp” centering on the object was copied from the -band mosaic. Each “stamp” was then added to the -band mosaic at randomly distributed positions. Source detection was performed on these simulated images to recover the artificially added objects. We find that the median recovering rate is 28.5%, corresponding to an incompleteness correction factor of 3.51.
3.3 LF of galaxies at and Reionization
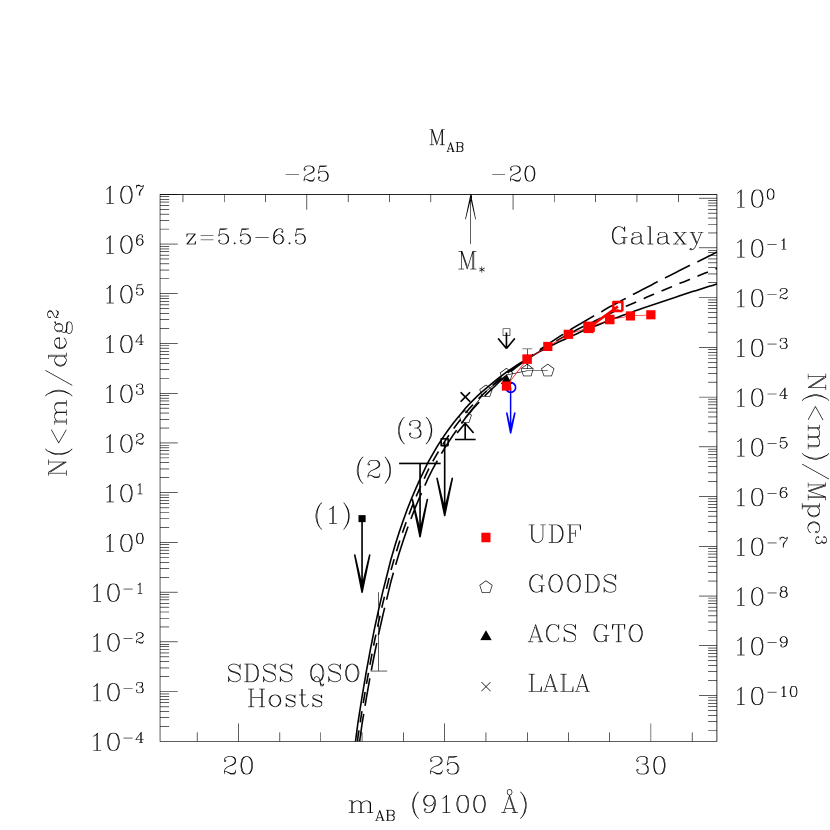
In Yan et al. (2002), we made a prediction of the LF of galaxies at based on the measured galaxy LF at . As summarized in Yan & Windhorst (2004; YW04), this LF estimate agrees well with all available observations (e.g., Rhoads et al. (2003); Yan, Windhorst & Cohen (2003); Stanway, Bunker & McMahon (2003); Bouwens et al. (2003); Dickinson et al. (2004)). Based on this LF, it was also suggested in that paper that “normal” galaxies can account for the entire ionizing photon budget necessary to finish the reionization of the universe by , as long as the faint-end slope of the LF is sufficiently steep. This LF, with slopes of , and , is reproduced in Fig. 2. YW04 predicted that the UDF data would reveal 50–80 objects to mag. Among the 108 candidates reported here, 55 objects are brighter than this level, and this agrees with our earlier prediction.
As discussed in YW04, if the nominal clumping factor value ( at ) is adopted, normal galaxies can account for the entire reionizing photon budget at as long as the faint-end slope of the LF at this redshift is somewhat steeper than and the normalization of the LF is close to what we estimated. If the faint-end slope is shallower than , galaxies cannot meet the reionization requirement unless the clumping factor is significantly lower, or the LF normalization is much higher, or the Lyman photon escaping fraction is larger. Since every evidence indicates that the LF normalization is about right, the important issue is the faint-end slope of the LF. No other data set is better than the UDF candidate sample for this purpose. The cumulative number densities inferred from our sample, without incompleteness correction, are plotted as solid red boxes in Fig. 2. Again, these numbers agree well with our LF prediction to 28.5 mag, where the candidate selection does not suffer from severe incompleteness. However, as Fig. 2 also shows, we have to measure the counts to significantly fainter than 28.5 mag in order to constrain the possible range of faint-end slopes. While our data points beyond 28.5 mag seem to suggest a faint-end slope of or even shallower, this is rather biased by the incompleteness at the faint levels. If we apply the correction as mentioned in §3.2, a steeper slope is indicated. The open red box in Fig. 2 shows the corrected cumulative surface density to 29.2 mag, if a factor of 3.51 is applied to the density of the intermediate brightness group (28.5–29.2 mag), which suggests a faint-end slope between and . For comparison, if the incompleteness correction were only a factor of 2 for the intermediate brightness group — contrary to what our simulation indicates — a faint-end slope of would still be required. Therefore, we conclude that the major sources of the reionization at are indeed normal galaxies with dwarf-like luminosities. It is interesting to note that Stiavelli et al. (2004) have also reached the similar conclusion, although from a different approach, that regular galaxies at are sufficient for reionization.
4 Constraint to the LF at
While our candidate sample has four objects, further investigation show that a interpretation is not straightforward. First of all, the three drop-outs have (-) mag, which makes them also drop-outs. As a object should have similar fluxes in both and bands, they are unlikely to be at this redshift. We also explored a large variety of dust-reddened young galaxy templates, and found that none of them could have such a large break across the band. We note that the first two objects in Table 2 are similar to the J-band drop-out object (but slightly brighter) found by Dickinson et al. (2000) in the HDF-N, whose nature is yet unclear. Secondly, the remaining candidate in the sample is likely at the border of the bin and the bin, as this candidate is actually the multiple system 7a/7b in the sample. Therefore, whether this system should be counted as or is very uncertain at this stage.
Nevertheless, we can still derive a useful upper limit of the cumulative surface density of galaxies based on objects 7a/7b, assuming that both members are at . This limit is 0.36 per arcmin2 to mag. While there are a number of reported Ly emitters at , a direct comparison against these results is difficult, because these Ly emitters either are gravitationally lensed by foreground clusters (Hu et al. 2002; Kneib et al. 2004) or do not have continuum magnitudes available (Kodaira et al. 2003; Rhoads et al. 2004). However, none of these results seems to be in conflict with our derived upper limit.
Assuming no evolution from to 7, our LF predicts that the cumulative surface density of galaxies to 26.6 mag is 0.51 per arcmin2, which is somewhat higher than the observed upper limit. Thus our data suggest a noticeable drop of the LF amplitude over the 0.16 Gyr from to 7, which we tentatively identified with the onset of galaxy formation and the onset of the first regular IMF of Pop II stars, the low-mass end of which we still see in galaxy halos today, and the high mass end of which finished reionization at , when those hot stars resided in dwarf galaxies at –6.
5 Summary
We searched for –7 galaxy candidates in the UDF, using the UDF WFC and NIC3 data. We have found 108 candidates to a limit of mag, which is consistent with the prediction in YW04. The cumulative surface densities after the correction of incompleteness suggests a slope of to , which means galaxies can account for the reionizing photon budget at . We also searched for galaxy candidates, but only found one such object whose redshift might be at the lower end of the redshift range under question. The search also resulted in three drop-outs, whose colors shown that they are not likely at . The paucity of candidates suggests the LF-amplitude drops significantly beyond , which can be identified with the dawn of galaxy formation.
References
- (1) Bertin, E. & Arnouts, S. 1996, A&AS, 117, 393
- (2) Bouwens, R. J., et al. 2003, ApJ, 595, 589
- (3) Bruzual, A. G. & Charlot, S. 1993, ApJ, 405, 538
- (4) Calzetti, D., et al. 2000, ApJ, 533, 682
- (5) Coleman, G. D., Wu, C.-C., Weedman, D. W. 1980, ApJS, 43, 393
- (6) Dickinson, M., et al. 2000, ApJ, 531, 624
- (7) Dickinson, M., et al. 2004, ApJ, 600, L99
- (8) Hu, E. M., Cowie, L. L., McMahon, R. J., Capak, P., Iwamuro, F., Kneib, J.-P., Maihara, T., and Motohara, K. 2002, ApJ, 568, L75
- (9) Kirkpatrick, J. D., et al. 1999, ApJ, 519, 802
- (10) Kneib, J.-P., Ellis, R. S., Santoas, M. R., and Richard, J. 2004, accepted by AJ
- (11) Kodaira, K., et al. 2003, PASJ, 55, L17
- (12) Rhoads, J. E., et al. 2003, AJ, 125, 1006
- (13) Rhoads, J. E., et al. 2004, astro-ph/0403161 (accepted by ApJ)
- (14) Stanway, E. R., Bunker, A. J., & McMahon, R. G. 2003, MNRAS 342,439
- (15) Stiavelli, M., Fall, S. M. & Panagia, N. 2004, to be published in ApJL
- (16) Yan, H., Windhorst, R. A., Odewahn, S. C., Cohen, S. H., Röttgering, H. J. A., & William, C. K. 2002, ApJ, 580, 725
- (17) Yan, H., Windhorst, R. & Cohen, S. 2003, ApJ, 585, L93
- (18) Yan, H. & Windhorst, R., 2004, ApJ, 600, L1 (YW04)
| ID | RA & DEC(J2000) | S/G | FWHM | |||||
|---|---|---|---|---|---|---|---|---|
| 1a | 3:32:40.01 -27:48:15.01 | 0.04 | 5.0 | 26.880.03 | 25.250.01 | 1.62 | 25.470.02 | 25.410.02 |
| 1b | 3:32:40.04 -27:48:14.54 | 0.00 | 12.6 | 29.030.18 | 27.410.07 | 1.62 | ||
| 2a | 3:32:36.47 -27:46:41.45 | 0.02 | 9.6 | 29.000.16 | 26.490.03 | 2.51 | 26.600.04 | 25.920.03 |
| 2b | 3:32:36.49 -27:46:41.38 | 0.02 | 6.1 | 29.580.22 | 27.760.07 | 1.82 | ||
| 3 | 3:32:38.28 -27:46:17.22 | 0.06 | 6.0 | 29.770.29 | 26.680.03 | 3.09 | 26.830.04 | 26.730.04 |
| 4 | 3:32:34.55 -27:47:55.97 | 0.02 | 6.6 | 28.620.10 | 26.930.04 | 1.70 | 26.760.03 | 26.600.03 |
| 5a | 3:32:34.29 -27:47:52.80 | 0.00 | 14.3 | 29.070.21 | 26.970.05 | 2.10 | 26.560.03 | 26.700.04 |
| 5b | 3:32:34.28 -27:47:52.26 | 0.00 | 14.9 | 28.980.19 | 27.170.06 | 1.80 | ||
| 5c | 3:32:34.31 -27:47:53.56 | 0.00 | 15.3 | 29.420.22 | 27.760.08 | 1.66 | ||
| 6 | 3:32:33.43 -27:47:44.88 | 0.00 | 7.5 | 29.310.18 | 27.230.05 | 2.09 | 27.220.03 | 27.280.04 |
| 7a | 3:32:37.46 -27:46:32.81 | 0.00 | 13.0 | 32.494.00 | 27.500.07 | 4.99 | 26.610.02 | 26.260.02 |
| 7b | 3:32:37.48 -27:46:32.45 | 0.00 | 11.7 | 29.700.30 | 27.780.09 | 1.92 | ||
| 8 | 3:32:38.02 -27:49:08.36 | 0.93 | 3.2 | 26.92 0.02 | 25.41 0.01 | 1.50 | ||
| 9 | 3:32:38.80 -27:49:53.65 | 0.23 | 3.4 | 29.08 0.46 | 25.43 0.03 | 3.65 | ||
| 10 | 3:32:34.09 -27:46:47.21 | 0.02 | 5.9 | 28.81 0.11 | 26.64 0.03 | 2.16 | ||
| 11 | 3:32:32.61 -27:47:53.99 | 0.01 | 12.3 | 28.03 0.07 | 26.68 0.03 | 1.35 | ||
| 12 | 3:32:29.98 -27:47:02.87 | 0.23 | 6.8 | 28.12 0.12 | 26.80 0.06 | 1.32 | ||
| 13 | 3:32:47.85 -27:47:46.36 | 0.00 | 17.6 | 30.39 0.71 | 26.97 0.05 | 3.43 | ||
| 14 | 3:32:41.57 -27:47:44.23 | 0.00 | 12.5 | 29.54 0.31 | 26.97 0.05 | 2.58 | ||
| 15 | 3:32:41.18 -27:49:14.84 | 0.00 | 12.6 | 28.99 0.15 | 26.99 0.04 | 1.99 | ||
| 16 | 3:32:39.06 -27:45:38.77 | 0.21 | 5.2 | 28.38 0.08 | 27.00 0.04 | 1.38 | ||
| 17 | 3:32:36.45 -27:48:34.24 | 0.00 | 14.5 | 28.56 0.12 | 27.12 0.06 | 1.44 | ||
| 18 | 3:32:37.28 -27:48:54.58 | 0.16 | 6.8 | 30.36 0.56 | 27.25 0.06 | 3.12 | ||
| 19 | 3:32:31.30 -27:48:08.28 | 0.00 | 12.8 | 28.74 0.14 | 27.31 0.06 | 1.44 | ||
| 20 | 3:32:33.78 -27:48:07.60 | 0.07 | 6.1 | 29.07 0.10 | 27.35 0.04 | 1.72 | ||
| 21 | 3:32:29.45 -27:47:40.52 | 0.00 | 17.2 | 29.34 0.24 | 27.37 0.07 | 1.97 | ||
| 22 | 3:32:33.21 -27:46:43.28 | 0.00 | 14.5 | 28.93 0.14 | 27.39 0.06 | 1.54 | ||
| 23 | 3:32:38.28 -27:47:51.29 | 0.00 | 11.9 | 28.94 0.14 | 27.50 0.06 | 1.44 | ||
| 24 | 3:32:39.86 -27:46:19.09 | 0.00 | 9.9 | 31.31 1.27 | 27.61 0.07 | 3.70 | ||
| 25 | 3:32:38.50 -27:48:57.82 | 0.00 | 10.7 | 29.22 0.18 | 27.63 0.08 | 1.58 | ||
| 26 | 3:32:44.70 -27:47:11.58 | 0.01 | 9.3 | 29.48 0.23 | 27.65 0.08 | 1.83 | ||
| 27 | 3:32:36.62 -27:47:50.03 | 0.00 | 11.4 | 31.89 2.27 | 27.65 0.08 | 4.24 | ||
| 28 | 3:32:36.97 -27:45:57.60 | 0.00 | 11.8 | — | 27.72 0.08 | — | ||
| 29 | 3:32:40.92 -27:48:44.75 | 0.11 | 6.8 | 29.24 0.15 | 27.75 0.07 | 1.49 | ||
| 30 | 3:32:33.55 -27:46:44.04 | 0.00 | 13.2 | 29.30 0.20 | 27.78 0.09 | 1.53 | ||
| 31 | 3:32:45.16 -27:48:05.11 | 0.00 | 10.2 | 29.21 0.18 | 27.83 0.09 | 1.38 | ||
| 32 | 3:32:35.05 -27:47:40.16 | 0.04 | 8.1 | 30.81 0.64 | 27.84 0.07 | 2.97 | ||
| 33 | 3:32:42.60 -27:48:08.82 | 0.01 | 7.7 | 29.77 0.23 | 27.86 0.07 | 1.91 | ||
| 34 | 3:32:39.45 -27:45:43.42 | 0.45 | 6.2 | 30.98 0.76 | 27.89 0.08 | 3.10 | ||
| 35 | 3:32:34.00 -27:48:25.02 | 0.00 | 9.5 | 29.37 0.20 | 27.94 0.09 | 1.43 | ||
| 36 | 3:32:38.55 -27:46:17.54 | 0.02 | 7.3 | 29.48 0.16 | 27.97 0.07 | 1.51 | ||
| 37 | 3:32:32.36 -27:47:02.83 | 0.00 | 9.6 | 30.03 0.34 | 27.99 0.09 | 2.05 | ||
| 38 | 3:32:43.02 -27:46:23.66 | 0.08 | 5.7 | — | 28.00 0.08 | — | ||
| 39a | 3:32:41.43 -27:46:01.16 | 0.22 | 5.9 | — | 28.00 0.09 | — | ||
| 39b | 3:32:41.44 -27:46:01.31 | 0.00 | 9.1 | — | 28.14 0.10 | — | ||
| 40 | 3:32:42.80 -27:48:03.24 | 0.00 | 8.2 | — | 28.06 0.08 | — | ||
| 41 | 3:32:30.69 -27:46:54.84 | 0.92 | 4.0 | 29.72 0.33 | 28.10 0.13 | 1.62 | ||
| 42 | 3:32:35.08 -27:48:06.80 | 0.09 | 6.8 | 29.98 0.29 | 28.13 0.09 | 1.85 | ||
| 43 | 3:32:37.23 -27:45:38.38 | 0.00 | 10.9 | — | 28.14 0.09 | — | ||
| 44 | 3:32:38.79 -27:47:10.86 | 0.00 | 9.8 | 29.48 0.19 | 28.16 0.10 | 1.32 | ||
| 45 | 3:32:40.06 -27:49:07.50 | 0.94 | 4.0 | 29.97 0.16 | 28.20 0.05 | 1.77 | ||
| 46 | 3:32:44.70 -27:46:45.44 | 0.47 | 4.5 | 30.06 0.24 | 28.27 0.08 | 1.79 | ||
| 47 | 3:32:44.14 -27:48:27.07 | 0.61 | 4.6 | 30.17 0.29 | 28.30 0.09 | 1.86 | ||
| 48 | 3:32:34.14 -27:48:24.37 | 0.60 | 5.3 | 30.54 0.44 | 28.38 0.11 | 2.16 | ||
| 49 | 3:32:42.20 -27:49:12.00 | 0.52 | 7.8 | 31.48 1.21 | 28.39 0.12 | 3.09 | ||
| 50 | 3:32:43.16 -27:48:29.56 | 0.58 | 7.1 | 29.75 0.21 | 28.43 0.11 | 1.32 | ||
| 51 | 3:32:34.58 -27:46:58.01 | 0.13 | 5.7 | 31.49 1.00 | 28.44 0.11 | 3.05 | ||
| 52 | 3:32:40.25 -27:46:05.12 | 0.74 | 5.0 | 31.30 0.88 | 28.44 0.11 | 2.86 | ||
| 53 | 3:32:39.48 -27:48:40.10 | 0.48 | 7.9 | 31.55 1.10 | 28.46 0.11 | 3.10 | ||
| 54 | 3:32:39.52 -27:45:13.39 | 0.90 | 5.0 | — | 28.49 0.15 | — | ||
| 55 | 3:32:33.33 -27:48:24.16 | 0.00 | 7.4 | 30.82 0.54 | 28.50 0.11 | 2.32 | ||
| 56a | 3:32:34.52 -27:47:34.84 | 0.10 | 5.5 | 31.16 0.70 | 28.52 0.11 | 2.65 | ||
| 56b | 3:32:34.47 -27:47:35.05 | 0.25 | 6.4 | 30.44 0.37 | 28.65 0.12 | 1.79 | ||
| 57 | 3:32:40.56 -27:48:02.59 | 0.00 | 7.9 | — | 28.54 0.12 | — | ||
| 58 | 3:32:39.41 -27:47:59.42 | 0.01 | 7.9 | 30.29 0.31 | 28.58 0.11 | 1.71 | ||
| 59 | 3:32:38.86 -27:47:13.16 | 0.88 | 3.9 | 30.10 0.20 | 28.61 0.09 | 1.49 | ||
| 60 | 3:32:47.56 -27:47:11.33 | 0.73 | 4.2 | 30.18 0.29 | 28.62 0.12 | 1.56 | ||
| 61 | 3:32:32.72 -27:46:37.24 | 0.49 | 5.1 | 30.24 0.30 | 28.63 0.12 | 1.61 | ||
| 62 | 3:32:47.97 -27:47:05.14 | 0.22 | 5.0 | — | 28.65 0.14 | — | ||
| 63 | 3:32:35.10 -27:48:09.14 | 0.00 | 9.6 | 30.04 0.22 | 28.68 0.11 | 1.36 | ||
| 64 | 3:32:40.82 -27:47:48.77 | 0.75 | 6.4 | 30.62 0.36 | 28.81 0.12 | 1.81 | ||
| 65 | 3:32:40.26 -27:48:08.10 | 0.86 | 3.7 | — | 28.82 0.09 | — | ||
| 66 | 3:32:40.53 -27:45:46.48 | 0.66 | 4.7 | 30.43 0.28 | 28.83 0.11 | 1.60 | ||
| 67 | 3:32:46.17 -27:47:45.31 | 0.18 | 5.2 | 31.28 0.64 | 28.84 0.12 | 2.44 | ||
| 68 | 3:32:38.05 -27:45:48.82 | 0.10 | 7.1 | — | 28.85 0.14 | — | ||
| 69 | 3:32:37.69 -27:46:21.54 | 0.71 | 6.9 | 33.74 7.51 | 28.86 0.15 | 4.88 | ||
| 70 | 3:32:36.77 -27:48:56.95 | 0.77 | 7.5 | 30.24 0.30 | 28.86 0.15 | 1.38 | ||
| 71 | 3:32:42.71 -27:48:11.81 | 0.31 | 6.2 | 30.91 0.49 | 28.87 0.13 | 2.04 | ||
| 72 | 3:32:39.13 -27:48:18.47 | 0.58 | 5.4 | 31.83 1.16 | 28.90 0.14 | 2.94 | ||
| 73 | 3:32:38.16 -27:47:33.36 | 0.11 | 6.3 | 31.07 0.68 | 28.91 0.16 | 2.16 | ||
| 74 | 3:32:45.33 -27:47:03.52 | 0.71 | 4.0 | 31.78 1.09 | 28.94 0.14 | 2.84 | ||
| 75 | 3:32:36.77 -27:47:53.59 | 0.65 | 6.1 | — | 28.96 0.16 | — | ||
| 76 | 3:32:42.78 -27:46:37.96 | 0.82 | 4.0 | 30.33 0.28 | 28.97 0.14 | 1.36 | ||
| 77 | 3:32:40.13 -27:49:36.98 | 0.08 | 5.8 | 32.41 2.11 | 28.97 0.16 | 3.43 | ||
| 78 | 3:32:34.09 -27:47:57.55 | 0.11 | 6.6 | 30.34 0.26 | 28.99 0.13 | 1.35 | ||
| 79 | 3:32:30.55 -27:47:16.69 | 0.81 | 4.5 | — | 29.00 0.14 | — | ||
| 80 | 3:32:44.98 -27:46:40.69 | 0.02 | 6.7 | — | 29.00 0.15 | — | ||
| 81 | 3:32:37.83 -27:49:05.84 | 0.75 | 5.3 | 31.34 0.63 | 29.01 0.13 | 2.33 | ||
| 82 | 3:32:39.79 -27:46:33.74 | 0.02 | 7.4 | 31.27 0.47 | 29.03 0.11 | 2.24 | ||
| 83 | 3:32:38.27 -27:46:18.44 | 0.39 | 2.1 | 31.22 0.49 | 29.22 0.14 | 2.00 | ||
| 84 | 3:32:44.49 -27:47:13.74 | 0.61 | 3.0 | 32.28 1.39 | 29.22 0.15 | 3.06 | ||
| 85 | 3:32:42.19 -27:46:27.88 | 0.78 | 6.1 | — | 29.23 0.16 | — | ||
| 86 | 3:32:41.18 -27:46:55.24 | 0.75 | 3.5 | 31.03 0.47 | 29.25 0.16 | 1.78 | ||
| 87 | 3:32:31.55 -27:48:13.97 | 0.29 | 4.3 | 32.88 2.38 | 29.31 0.15 | 3.58 | ||
| 88 | 3:32:40.44 -27:46:32.12 | 0.59 | 4.5 | 31.92 1.02 | 29.32 0.16 | 2.59 | ||
| 89 | 3:32:39.50 -27:46:49.44 | 0.70 | 4.1 | 32.28 1.35 | 29.33 0.16 | 2.95 | ||
| 90 | 3:32:40.83 -27:48:31.64 | 0.50 | 5.3 | 31.07 0.44 | 29.36 0.16 | 1.72 | ||
| 91 | 3:32:35.04 -27:47:25.76 | 0.73 | 5.7 | 30.94 0.41 | 29.36 0.17 | 1.58 | ||
| 92 | 3:32:47.72 -27:47:02.58 | 0.53 | 3.5 | 30.86 0.39 | 29.37 0.17 | 1.48 | ||
| 93 | 3:32:35.90 -27:49:02.75 | 0.79 | 5.2 | 30.97 0.40 | 29.40 0.17 | 1.57 | ||
| 94 | 3:32:39.24 -27:49:23.74 | 0.47 | 3.9 | 30.91 0.34 | 29.41 0.15 | 1.51 | ||
| 95 | 3:32:43.79 -27:46:33.71 | 0.41 | 6.1 | 30.85 0.34 | 29.42 0.16 | 1.43 | ||
| 96 | 3:32:38.68 -27:49:12.86 | 0.63 | 2.4 | 31.38 0.53 | 29.49 0.16 | 1.89 | ||
| 97 | 3:32:41.33 -27:49:20.46 | 0.63 | 4.1 | 31.19 0.50 | 29.52 0.19 | 1.66 | ||
| 98 | 3:32:39.42 -27:47:02.58 | 0.53 | 3.4 | 31.82 0.74 | 29.62 0.17 | 2.20 | ||
| 99 | 3:32:47.81 -27:47:20.54 | 0.69 | 4.1 | 31.29 0.47 | 29.62 0.17 | 1.68 | ||
| 100 | 3:32:31.75 -27:46:50.48 | 0.67 | 4.3 | — | 29.65 0.20 | — | ||
| 101 | 3:32:34.19 -27:46:39.07 | 0.57 | 3.7 | — | 29.97 0.20 | — |
| ID | RA& DEC(J2000) | (limit)1 | ||
|---|---|---|---|---|
| 1 | 3:32:38.74 -27:48:39.97 | 28.967 | 26.5830.050 | 24.6770.012 |
| 2 | 3:32:42.88 -27:48:09.52 | 28.517 | 27.0120.103 | 24.6320.015 |
| 3 | 3:32:42.56 -27:46:56.69 | 28.449 | 27.2970.056 | 26.1060.024 |