eurm10 \checkfontmsam10
STScI May Symposium, 3–6 May, 2004, Baltimore, MD, USA Planets To Cosmology: Essential Science In Hubble’s Final Years M. Livio (ed.) Hot Baryons in Supercluster Filaments
Abstract
Most of the baryons in the local universe are “missing” in that they are not in galaxies or in the previously detected gaseous phases. These missing baryons are predicted to be in a moderately hot phase, 105–107 K, largely in the form of giant cosmic filaments that connect the denser virialized clusters and groups of galaxies. Models show that the highest covering fraction of such filaments occurs in superclusters. To determine whether such filaments exist, we have begun a project to search for UV absorption against AGNs projected behind possible supercluster filaments. Using data from the HST and FUSE archives along with new observations, we have detected UV absorption within about 1300 km/s of seven supercluster sightlines out of a sample of eight. The likelihood of such detections being generated by chance is less than 10-4.
1 Introduction
A census of baryons in the local universe indicates that the majority of this normal matter is undetected, or “missing”. At high redshifts (), big-bang nucleosynthesis models and QSO absorption line observations indicate a baryon mass fraction of (e.g., Fukugita, Hogan & Peebles 1998). The stars and gas detected in local galaxies account for only 20% of this (). The absence of a local Ly forest indicates that these baryons are likely in a hot ( K), diffuse medium which has heretofore remained undetectable (e.g., Fukugita, Hogan & Peebles 1998; Cen & Ostriker 1999a; Davé et al. 2001).
A reservoir of hot gas would be organized similarly to the collapsed structure, i.e. into a web of filaments like those seen in structure formation simulations (e.g. Evrard et al. 2002). Gas is shock-heated as it collapses into structures, and at the nodes of this web are found the rich clusters of galaxy, which contain large concentrations of hot gas seen in X-ray emission (–). Galaxy groups are found along the filaments connecting nodes, and while several groups are detected in diffuse X-ray emission ( K), the extent of this gaseous component is not well-constrained. The filaments themselves contain most of the volume of collapsed structure, and the temperature in these regions is thought to be lower than that of the denser clusters and groups, or – K (e.g., Cen et al. 1995).
Recent results have shown possible absorption by this hot cosmic web of baryons against background point sources (Tripp & Savage 2000; Savage et al. 2002; Richter et al. 2004). We have begun a project to (1) identify lines connecting clusters within superclusters and (2) search for absorption against AGNs projected behind these likely filament locations. Results from three AGNs probing four superclusters have been given in detail by Bregman, Dupke & Miller (2004). Here we summarize that study and present preliminary results for four additional AGN/supercluster sightlines. This project makes use of both archival and proprietary HST data, using all generations of spectrographs, from FOS to GHRS to STIS. As we primarily search for Ly 1216 absorption at low redshift, this project requires space-based UV spectroscopy and would be impossible without the sensitivity and wavelength coverage of HST.
2 Identifying Filaments and Background AGNs
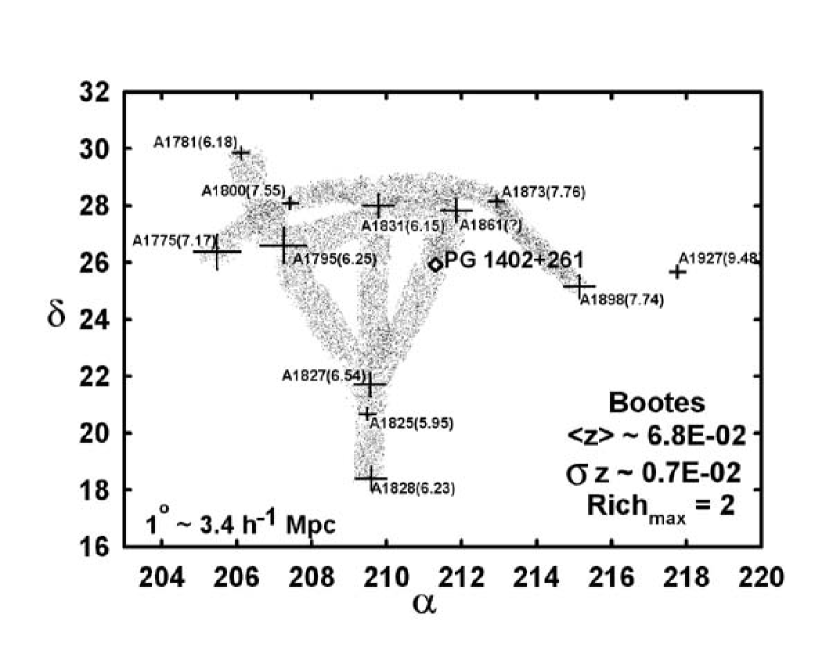
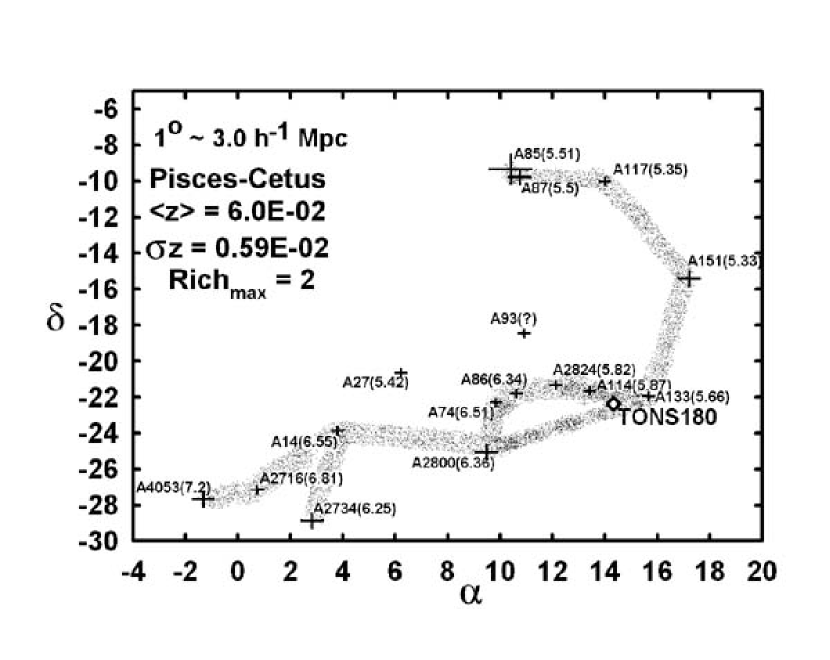
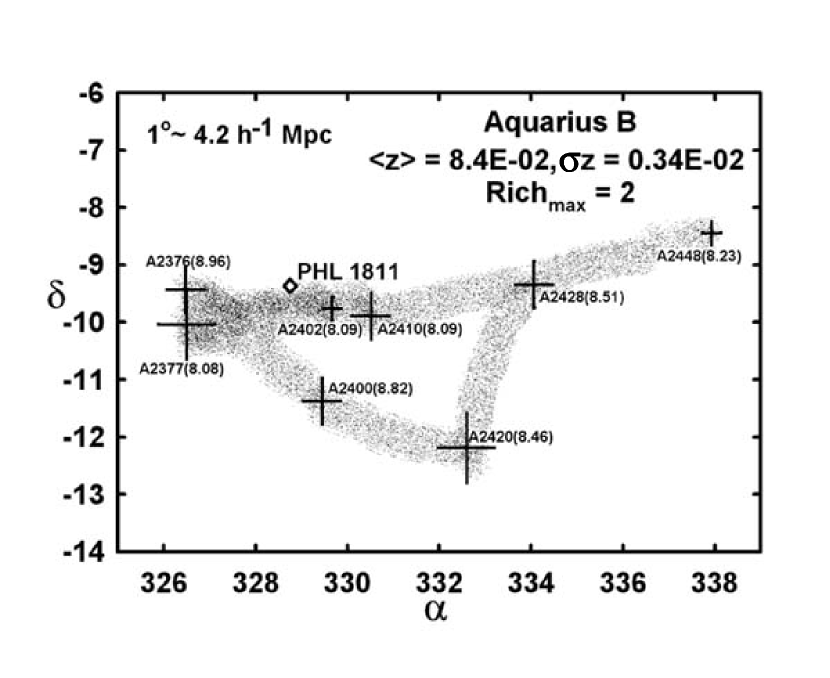
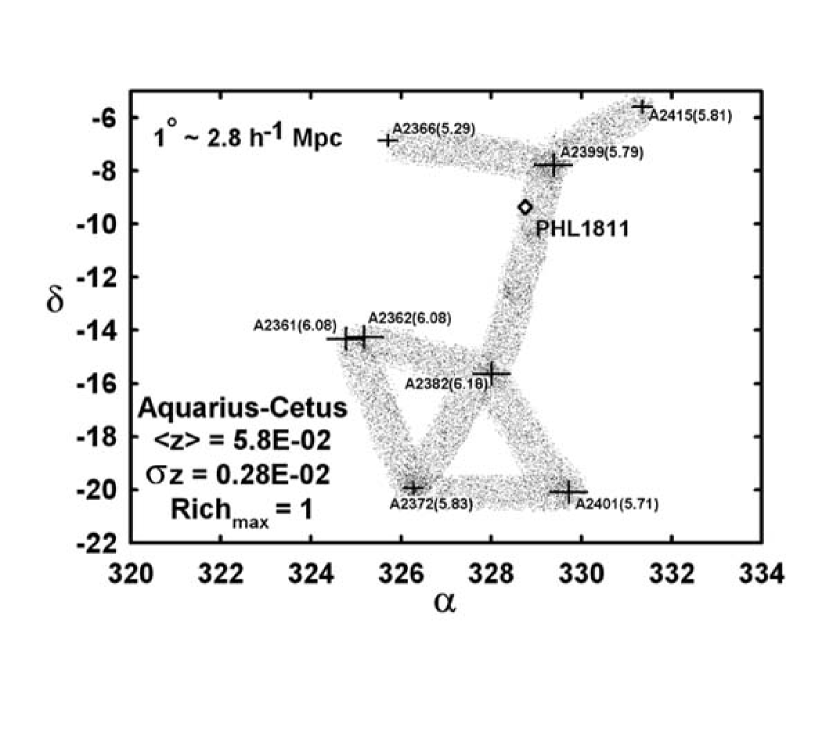
Filaments themselves are not visible in emission to current instruments, so knowing where to look requires predicting their locations. Structure formation simulations indicate that filaments should connect clusters in approximately straight lines (e.g. Evrard et al. 2002), with the width of the filaments on the order of the virial radius of a typical cluster ( Mpc; Cen & Ostriker 1999b). The supercluster catalog of Einasto et al. (1997), which contains 220 superclusters at , allows us to visually identify filaments connecting clusters in space and redshift and cross-correlate these locations with AGNs from the Véron-Cetty & Véron (2001) catalog. Observation with HST and FUSE necessitates selection of bright () AGNs, which are typically nearby Seyfert galaxies at , and it requires low Galactic extinction (from Schlegel, Finkbeiner & Davis 1998). The background AGNs must be well-separated in redshift from the intervening superclusters (), and these combined requirements preferentially select nearby superclusters. The larger solid angle subtended by these nearer systems also increases the likelihood of finding a suitable background AGN within 3 Mpc of the predicted filament line.
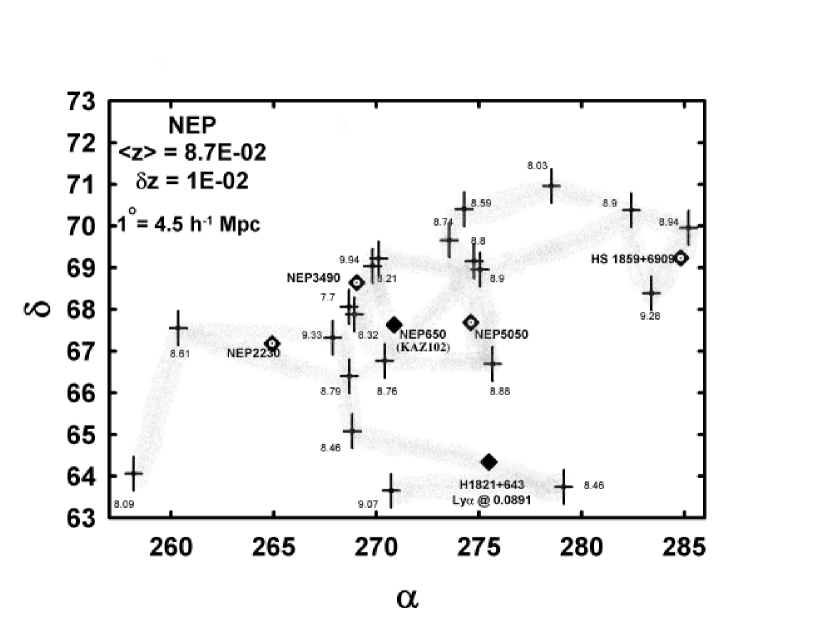
We have identified 11 supercluster sightlines probed by 10 AGNs (PHL 1811 lies behind two distinct superclusters), and these are listed in Table 1. Maps of four superclusters are shown in Figure 1 to demonstrate the predicted filament structure and projected locations of background AGNs. At publication time, seven AGNs (probing eight supercluster sightlines) have been observed by HST, and four AGNs (probing five superclusters) have been observed by FUSE; these results include a combination of archived and proprietary data. The object Ton S180 fails our criterion, and we treat it as a special case in the following discussion. Data for four of the AGNs have been discussed in the literature: PHL 1811, studied extensively by Jenkins et al. (2003); PG 1402+261, studied by Bechtold et al. (2002) and Wakker et al. (2003); H1821+643, observed by Tripp, Lu & Savage (1998) and Oegerle et al. (2000); and Ton S180, reported on by a number of authors (Shull et al. 2000; Turner et al. 2002; Wakker et al. 2003; Penton, Stocke & Shull 2004). We have incorporated their results and our own analysis of the data here. The remainder of the AGNs were observed by us for this project with the exception of KAZ 102, which was obtained from the HST archive.
| AGN | supercluster(s) | HST | FUSE | |||||
| (mÅ) | (mÅ) | ( K) | ||||||
| PHL1811 | Aquarius B | 0.192 | 0.084 | 300 | 50 | 0.2 | ||
| Aquarius-Cetus | 0.192 | 0.056 | 600 | 250 | 1.0 | |||
| PG1402+261 | Bootes | 0.164 | 0.068 | 300 | 100 | 1.6 | ||
| Ton S180 | Pisces-Cetus | 0.062 | 0.060 | 100 | 150 | 0.1 | ||
| KAZ102 | North Ecliptic Pole | 0.136 | 0.087 | 400 | 6.4 | |||
| H1821+643 | North Ecliptic Pole | 0.297 | 0.087 | 50 | 150 | 0.4 | ||
| WGAJ2153 | Aquarius-Cetus | 0.078 | 0.056 | 400 | 3.6 | |||
| RXSJ01004-5113 | Phoenix | 0.062 | 0.027 | 150 | ||||
| RXSJ01149-4224 | Phoenix | 0.124 | 0.027 | |||||
| HE0348-5353 | Horologium-Reticulum | 0.130 | 0.064 | |||||
| TEX1601+160 | Hercules | 0.109 | 0.035 | |||||
| Ton 730 | Bootes | 0.087 | 0.065 |
3 Absorption Line Results
The HST and FUSE spectra together probe a number of high- and low-ionization species, including the strong lines of Ly 1216, Ly 1026, O VI 1032,1038, C II 1335, and C III 977. At the expected filament temperatures of about 3 K, the low-ionization metal lines will be absent, but the Ly series of H I will still be present. The relative strengths of the Ly and O VI absorption depend strongly on such parameters as temperature and metalicity. We expect individual filaments to have a velocity dispersion no greater than that of a typical cluster ( ), centered on the redshift of the nearest clusters, so we have searched for absorption from all available species within of this average velocity.
Absorption from Ly is detected in seven of the eight superclusters observed with HST, and O VI absorption is seen in two of the five sightlines probed with FUSE. The Ly and O VI 1032 line strengths (or upper limits) are listed in Table 1. Line widths were measured by fitting a Gaussian to the line profile, and from this we obtained a maximum temperature corresponding to the maximum allowed thermal line broadening. As is shown in Table 1, these temperatures range from – K, however it must be stressed that these are upper limits and it is possible the lines are composed of multiple, blended components. Two sample spectra are presented in Figures 3 and 3, showing Ly absorption near the redshift of the Bootes supercluster (against PG 1402+261) and multiple Ly systems near the redshift of the Aquarius B supercluster (against PHL 1811).


4 Galaxy Halo Absorption?
It has been been suggested that low- Ly absorbers are associated with galaxies, and specifically that all strong Ly systems (with mÅ) arise from absorption within extended gaseous halos of galaxies near the line of sight (Lanzetta et al. 1995; Chen et al. 1998; Chen et al. 2001). Under this model, and given the measurements shown in Table 1, it is possible some of the observed absorption is due to intervening galaxies and not filaments.
One questionable case is the absorption against PHL 1811 near the redshift of the Aquarius B supercluster. Four Ly systems are seen by Jenkins et al. (2003) at redshifts of 0.0735, 0.0778, 0.0790 and 0.0809 (see Figure 3), with O VI observed at two of these redshifts, 0.0778 and 0.0809. Jenkins et al. (2003) identify an galaxy at the redshift of the 0.0809 system (a Lyman limit system), projected 34 kpc away. The other three systems are shifted 580–2250 in velocity and unlikely to be associated with gravitationally bound material in this galaxy. The authors suggest this material is due to tidal interactions, but the lack of tidal features in the LLS galaxy make this unlikely. The lack of galaxies at the redshifts of these systems leads us to suggest they are associated with the supercluster filament (in which the galaxy is embedded).
A second case is that of Ton S180, a Sy 1.2 galaxy at a similar redshift to (and possibly probing) the Pisces-Cetus supercluster. Three previously-unreported Ly systems are seen and matched with O VI absorption at similar redshifts. However, it is impossible to determine the site of absorption, since it may be produced by the filament or by the AGN itself.
The remaining five absorption systems are not associated with halos of known galaxies. They have no apparent galaxies within kpc, although this analysis is preliminary and based on shallow Digitized Sky Survey images. Further deep imaging around these sightlines is needed. Recent statistical studies suggest that the proposed absorber-galaxy link is valid only for strong Ly absorbers ( mÅ), and that most local absorption systems are associated with filaments (Penton, Stocke & Shull 2002, 2004).
5 Random, Unassociated Ly Clouds?
It is possible that these absorbers are associated with neither filaments nor intervening galaxies, and by chance appear at the redshifts where we search. Without worrying about their physical nature, only that they are part of the ensemble of low- Ly systems well-studied in the literature, we can derive the probably of detecting the number we have in the regions we have searched.
For a velocity range , the expected number of absorbers is , where is the frequency of absorbers with redshift. This number has been estimated to be for mÅ and for mÅ (e.g., Dobrzycki et al. 2002). If we assume the absorbers are Poisson distributed in redshift, and use for a mean occurence of per supercluster redshift range, then there is a 21% chance of finding at least one absorber within a given 2600 section of a pencil-beam spectrum. Excluding Ton S180 completely, and calling the mÅ system toward H 1821+643 a non-detection, this leads to a 0.6% probability of detecting Ly absorption in five of seven trials (i.e., five of seven supercluster sightlines). If we include Ton S180 and H 1821+643, the probability drops to 0.01%.
The probability that these are unassociated clouds is likely much lower than this. We see three distinct absorption systems in both the Aquarius B and Pisces-Cetus superclusters, and as the studies would count these as separate absorbers in their calculation, a more accurate figure is found by including these as separate components. This adds three additional absorbers (since the LLS is likely associated with a galaxy) and results in a probability of less than that these are chance detections.
6 Conclusions and Future Work
We have detected absorption due to possible filaments along seven of eight supercluster sightlines. From a statistical analysis, it is likely that these absorbers are associated with the supercluster filaments, although it is unclear at this point whether they are produced by hot diffuse material in the filament or by some other mechanism. Galaxies should trace the filaments, and while we have argued against absorption due to galaxy halos, it is possible we are seeing absorption from galactic winds or ejecta. It can be argued that such material is really part of the diffuse filament gas, as it is gravitationally unbound from the galaxy and should eventually thermalize with a hot ambient medium, if present. Deep imaging of these sightlines will shed light on the presence of nearby galaxies, and datasets such as the Sloan Digital Sky Survey will provide redshifts for such systems and the clusters that lack redshifts.
The temperature of the absorbing gas is unknown at this time. The linewidths for most of the systems are consistent with temperatures up to – K, although if multiple velocity components are blended to produce the lines we see, this value will be much lower. The lack of O VI absorption remains puzzling, as it should be quite strong at the expected temperatures. Perhaps we are seeing cooler, denser streams of gas within a more diffuse hot medium; modeling of the ionization state and metallicity is needed before the observed line ratios can be explained.
For the (uncertain) future of HST, there are several additional observations that would enhance this study. The North Ecliptic Pole supercluster, shown as a map in Figure 4, lies in front of six background AGNs. Two of those have been previously observed and presented here (H 1821+643 and KAZ 102), and both show Ly absorption. Observations of the other four would not only increase our target sample, but they would provide an unprecedented study of the absorption properties across a single supercluster. Sightlines through other superclusters undoubtedly exist in the HST archive as well, but with no comparable missions planned for the foreseeable future, time is running out for new work in far-UV spectroscopy.
Acknowledgements.
We would like to thank the symposium organizing committee, especially Mario Livio, for assembling such an interesting and valuable meeting. Also, we would like to thank B-G Andersson, Ken Sembach, Bart Wakker, Jimmy Irwin, Chris Mullis, and Edward Lloyd-Davies for their advice and encouragement. This work is supported by NASA grants NAG5-10765 and NAG5-10806.References
- [Bechtold et al.(2002)] Bechtold, J., Dobrzycki, A., Wilden, B., Morita, M., Scott, J., Dobrzycka, D., Tran, K.-V, & Aldcroft, T.L. 2002, ApJS, 140, 143
- [Bregman, Dupke & Miller(2004] Bregman, J.N., Dupke, R.A., & Miller, E.D. 2004, ApJ, in press
- [Cen et al.(1995)] Cen, R., Kang, H., Ostriker, J.P., & Ryu, D. 1995, ApJ, 451, 436
- [Cen & Ostriker(1999a)] Cen, R., & Ostriker, J.P. 1999a, ApJ, 514, 1
- [Cen & Ostriker(1999b)] Cen, R., & Ostriker, J.P. 1999b, ApJ, 519, L109
- [] Chen, H.-W., Lanzetta, K.M., Webb, J.K., & Barcons, X. 1998, ApJ, 498, 77
- [] Chen, H.-W., Lanzetta, K.M., Webb, J.K., & Barcons, X. 2001, ApJ, 559, 654
- [Davé et al.(2001)] Davé, R., Cen, R., Ostriker, J.P., Bryan, G.L., Hernquist, L., Katz, N., Weinberg, D.H., Norman, M.L., & O’Shea, B. 2001, ApJ, 552, 473
- [Dobrzycki et al.(2002)] Dobrzycki, A., Bechtold, J., Scott, J., & Morita, M. 2002, ApJ, 571, 654
- [Einasto et al.(1997)] Einasto, M., Tago, E., Jaaniste, J., Einasto. J., & Andernach, H. 1997, A&AS, 123, 119
- [Evrard et al.(2002)] Evrard, A.E., et al. 2002, ApJ, 573, 7
- [Fukugita, Hogan & Peebles(1998)] Fukugita, M, Hogan, C.J., & Peebles, P.J.E. 1998, ApJ, 503, 518
- [Jenkins et al.(2003)] Jenkins, E.B., Bowen, D.V., Tripp, T.M., Sembach, K.R., Leighly, K.M., Halpern, J.P., & Lauroesch, J.T. 2003, AJ, 125, 2824
- [] Lanzetta, K.M., Bowen, D.V., Tytler, D., & Webb, J.K. 1995, ApJ, 442, 538
- [Oegerle et al.(2000)] Oegerle, W.R. et al. 2000, ApJ, 538, L23
- [Penton, Stocke & Shull(2002)] Penton, S.V., Stocke, J.T., & Shull, J.M. 2002, ApJ, 565, 720
- [Penton, Stocke & Shull(2004)] Penton, S.V., Stocke, J.T., & Shull, J.M. 2004, ApJS, 152, 29
- [Richter et al.(2004)] Richter, P., Savage, B.D., Tripp, T.M., & Sembach, K.R. 2004, ApJS, 153, 165
- [Savage et al.(2002)] Savage, B.D., Sembach, K.R., Tripp, T.M., & Richter, P. 2002 ApJ, 564, 631
- [Schlegel, Finkbeiner & Davis(1998)] Schlegel, D.J., Finkbeiner, D.P., & Davis, M 1998, ApJ, 500, 525
- [Shull et al.(2000)] Shull, J.M., et al. 2000, ApJ, 538, L13
- [Tripp, Lu & Savage(1998)] Tripp, T.M., Lu, L. , & Savage, B.D. 1998, ApJ, 508, 200
- [Tripp & Savage(2000)] Tripp, T.M., & Savage, B.D. 2000, ApJ, 542, 42
- [Turner et al.(2002)] Turner, T.J., et al. 2002, ApJ, 568, 120
- [Véron-Cetty & Véron(2001)] Véron-Cetty, M.-P., & Véron, P. 2001, Catalogue of Quasars and Active Nuclei (10th ed.; Garching: ESO)
- [Wakker et al.(2003)] Wakker, B.P., et al. 2003, ApJS, 146, 1