The nature of premaximum halts of classical nova
outbursts:
V723 Cassiopeiae and V463 Scuti
Abstract
We present a new interpretation of long premaximum halts of nova outbursts. For V723 Cas (Nova Cas 1995) and V463 Sct (Nova Sct 2000), we have reproduced light curves, excluding the brightness maxima, starting from the long premaximum halt through the late decay phase of the outbursts using a steady-state optically thick wind model. When the hydrogen-rich envelope of the white dwarf (WD) is massive enough, the star expands to or over and its surface temperature decreases to below 7000 K. At this supergiant mimicry stage, the changes in both the photospheric radius and the temperature are small against the large increase in the envelope mass. These changes cause a saturation in visual magnitude that lasts a long time before it begins to decline. This saturation is known as the premaximum halt of a classical nova outburst. The visual magnitude during the saturation is close to the bolometric magnitude, which is an upper limit for a given WD mass. Since the WD masses are estimated to be for V723 Cas and for V463 Sct by fitting the decline rate of nova light curves, we can determine the absolute magnitude of premaximum halts. It is a refined Eddington luminosity. Thus, the premaximum halt of a nova works as a standard candle.
1 INTRODUCTION
Some classical novae have a flat part or stagnation of the optical light curve before it reaches the maximum. Such a part of the optical light curve is called “premaximum halt” (e.g., Fig. 1.8 of Payne-Gaposchkin 1957; see also Fig. 5.1 of Warner 1995). The physical origin of the premaximum halt has not been fully understood yet, although a few ideas have been proposed. The duration of a premaximum halt is closely related to the nova speed class: the typical duration is a few hours in fast novae (e.g., Warner, 1989) while it is up to several months in some slow novae (HR Del, V1548 Aql, V723 Cas, and DO Aql).
Friedjung (1992) studied the past spectroscopic observations of HR Del during its long premaximum stage. He showed the presence of an almost stationary photosphere with very low velocities, unlike for the majority of classical novae. He then suggested that the conditions of thermonuclear runaway were just marginally satisfied (marginally unstable) in HR Del. This interpretation is compatible with the estimated white dwarf (WD) mass of (Bruch, 1982) or (Kürster & Barwig, 1988) in HR Del because the development of nova outbursts is very slow in these relatively low mass WDs (e.g., Prialnik & Kovetz, 1995). On the other hand, Orio & Shaviv (1993) proposed another idea of the premaximum halt, that is, a local (or partial) thermonuclear runaway on a white dwarf surface.
Recently, Kato et al. (2002) have revealed that the fast nova V463 Sct (Nova Sct 2000) has a long, at least, 24 day premaximum halt. The decline rate of the visual magnitude is estimated to be day, indicating a WD much more massive than . This seems not to be consistent with Friedjung’s (1992) interpretation. This long premaximum halt also seems to go against the idea given by Orio & Shaviv (1993) because the propagation timescale of burning fronts is a few to several days on WDs.
Kato et al.’s (2002) result stimulated us to interpret the premaximum halt purely from the theoretical side. It is well known that the visual magnitude, , attains its peak value when a nova photosphere expands greatly with the total luminosity being kept at the Eddington luminosity, because the photospheric temperature decreases to below K while passing the visual band pass. This makes a wide flat peak in the optical luminosity corresponding to the premaximum halt, although it occurs only when the envelope mass is very massive. In this Letter, based on an optically thick wind model of nova outbursts, we try to model the premaximum halt for two recent objects, V723 Cas (Nova Cas 1995) and V463 Sct (Nova Sct 2000), because V723 Cas is the slowest nova and V463 Sct is the fastest nova with a long premaximum halt. In §2, our optically thick wind model is briefly introduced and modeling the premaximum halt is given for V723 Cas. In §3 modeling the premaximum halt of V463 Sct is also given. Discussion and conclusions follow in §4.
2 Modeling of V723 Cas Premaximum Halt
2.1 Optically thick wind model
Photospheres of novae expand greatly up to or larger. In such a supergiant mimicry configuration of the WD envelope, the structure of the envelope can be approximated by a steady-state wind (e.g., Kato & Hachisu, 1994). Here we assume spherical symmetry. Using the same method and numerical techniques as in Kato & Hachisu (1994), we have obtained a sequence of steady-state wind solutions that mimics a time evolution of the decay phase of nova outbursts. This sequence is characterized by a decreasing envelope mass, because the hydrogen-rich envelope mass decreases in time as a result of wind mass loss and nuclear burning.
In order to calculate steady state wind solutions, we solve a set of equations, i.e., the continuity, equation of motion, radiative diffusion, and conservation of energy, from the bottom of the hydrogen-rich envelope through the photosphere, under the condition that the solution goes through a critical point of the steady state wind. OPAL opacity is adopted. Details of the computations have been published in Kato & Hachisu (1994). The physical properties of these wind solutions have also been published in many papers (e.g., Hachisu & Kato, 2001b; Hachisu et al., 2000, 1996, 1999a, 1999b; Kato, 1983, 1997, 1999). It should be noticed that a large number of meshes, i.e., more than 10,000 grids, are adopted for the wind solutions with an expanded photosphere of .
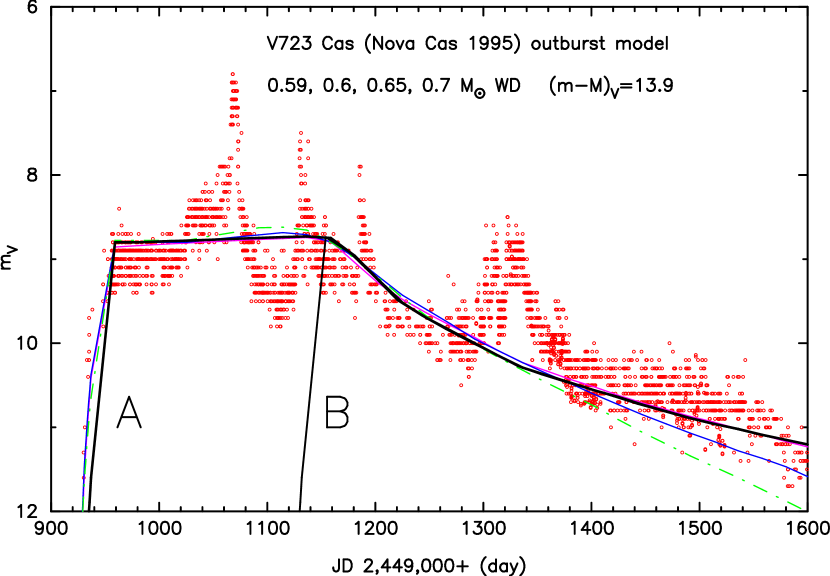
Figure 1 shows such a sequence for a WD with hydrogen-rich envelopes of the solar composition. When the envelope expands greatly after the onset of unstable hydrogen burning, the nova reaches somewhere on the sequence in the HR diagram, which depends on the envelope mass at the ignition. Here, two very early stages are marked by A and B. The envelope mass at epoch A is and that of epoch B is . The wind mass loss rates are yr-1 and yr-1, respectively.
In a large part of the decay phase of novae the luminosity is fairly constant as shown in Figure 1 even in the wind phase. However, the visual luminosity attains its maximum value at the photospheric temperature of K. Such a low surface temperature is reached only when the envelope mass is as massive as for the WD. The visual magnitude hardly varies between epoch A and epoch B so that the visual light curve becomes flat during the time when the nova moves from epoch A to epoch B. We have easily estimated the duration of such a flat part of the visual light curve by
| (1) |
because the envelope mass is decreasing mainly by the wind mass-loss (), where is the nuclear (hydrogen) burning rate and is the wind mass loss rate and we use . If the ignition mass is less massive than , the nova does not have a flat peak.
2.2 Premaximum Halt of V723 Cas
Figure 2 shows the light curve fitted with the V723 Cas observation. Assuming the solar abundance of the envelope composition, we have calculated 12 cases of the WD mass, i.e., 0.56, 0.58, 0.59, 0.60, 0.65, 0.70, 0.80, 0.90, 1.0, 1.1, 1.2, and and found that the WD model is the best-fit one for V723 Cas.
The main difference between our model and the observation is an oscillatory behavior that shows a strong (maximum) peak followed by a few other sharp peaks, which are a bit darker than the maximum one. We interpret these peaks as pulsations of the nova envelope as discussed by Schenker (1999). It should be noted here that our steady state wind model cannot describe pulsations of the nova envelope because pulsations are not in a steady state. Our sequence in Figures 1 and 2 based on the steady state model corresponds to the zeroth-order solutions when the pulsational instability is suppressed.
Comparing our theoretical magnitude with the observation, we have estimated the apparent distance modulus as for V723 Cas. The interstellar extinction toward V723 Cas have been estimated by many authors but the values are scattered; that is, (Rudy et al., 2002), calculated from (Iijima, Rosino, & della Valle, 1998), (Munari et al., 1996), (Chochol & Pribulla, 1997), (Gonzalez-Riestra et al., 1996; Ohsima, Akazawa, & Ohkura, 1996), and (Evans et al., 2003), in increasing order. The distance to V723 Cas is kpc if we adopt while it is kpc for .
2.3 Light curve fitting in late phase
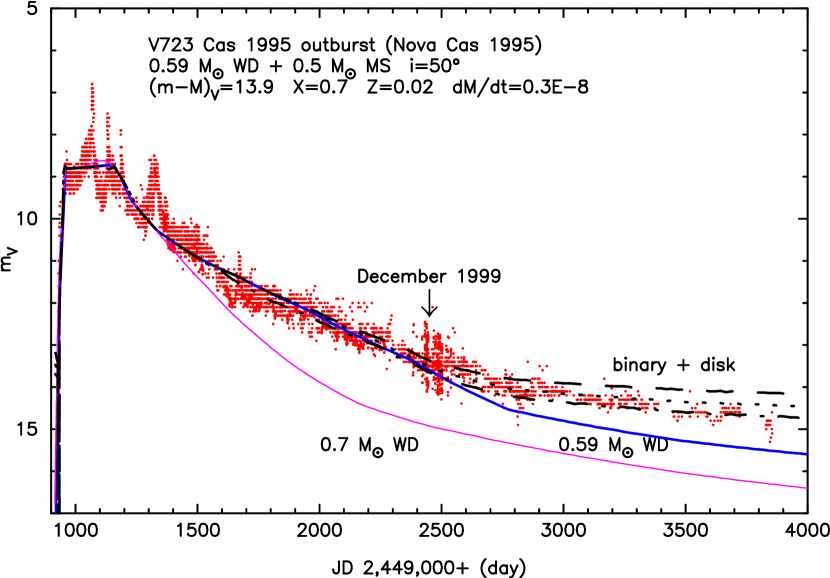
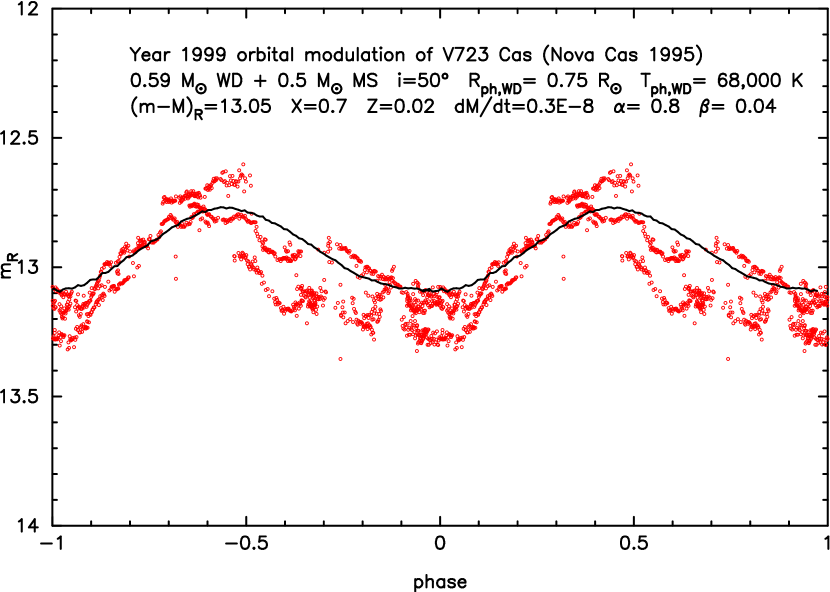
Figure 3 shows the entire phase of the light curve of V723 Cas. Our WD model consistently follows the observation until JD 2,451,500 but gradually deviates more than a magnitude after that. In order to fit the light curve, we must consider the irradiation effects of the accretion disk and the companion star, supported by the orbital modulation that has gradually grown up to a magnitude in the visual band (e.g., Goranskij et al., 2000; Chochol et al., 2003). Including the irradiation effects, we have calculated the orbital light curves. Here, we adopt a binary model consisting of a lobe-filling companion of with the original surface temperature of 4000 K, a WD, and an accretion disk around the WD. The important parameters that determine the shape of the orbital light curve are the size () and thickness () of the accretion disk and the inclination angle () of the orbit, where is the effective radius of the Roche lobe, is the disk radius, and is the height of the disk (see, e.g., Hachisu et al., 2000; Hachisu & Kato, 2001b; Hachisu et al., 2004, for more detail). Here, we adopt , , and . We adopt the ephemeris of
| (2) |
at brightness minima (Goranskij et al., 2000). As shown in Figure 4, the orbital light curve is successfully reproduced. With this binary model, we are able to roughly follow the entire phase of the light curve as shown in Figure 3.
3 Premaximum halt of V463 Sct
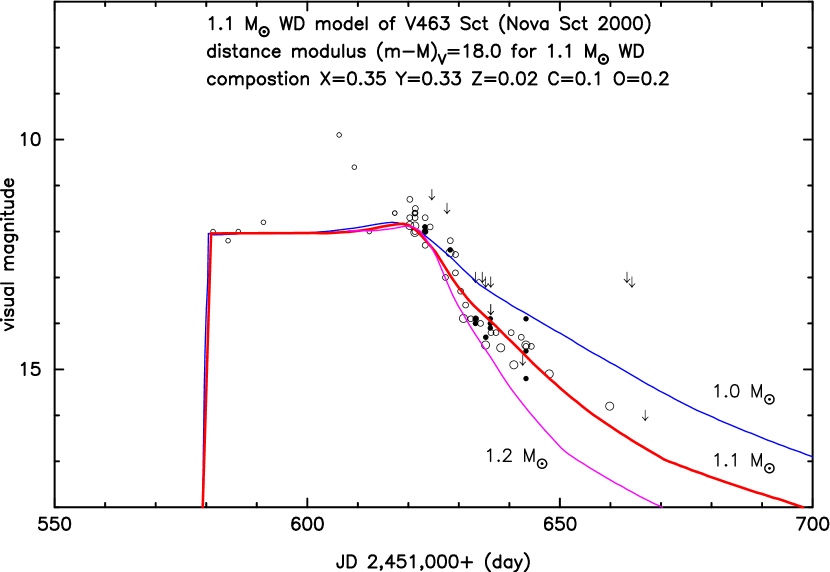
V463 Sct (Nova Sct 2000) is a fast nova with day (Kato et al., 2002). We adopt a carbon-oxygen rich envelope of , , , and . Among seven sequences calculated for 0.6, 0.7, 0.8, 0.9, 1.0, 1.1, and WDs, three are plotted in Figure 5. The best fit one is that for the WD. The envelope mass at the start of the premaximum halt is for our WD model. The apparent distance modulus is estimated to be , so that the distance to V463 Sct is kpc if we adopt the interstellar extinction of (Kato et al., 2002).
4 Discussion
The premaximum halt works as a standard candle of the Eddington luminosity. Strictly speaking, the Eddington luminosity, , is a local variable because the opacity is a local variable. Although the opacity varies largely, the photospheric luminosity, , is almost constant as shown in Figures 1. Therefore, we regard that in the almost flat part of the H-R diagram plays the role of the Eddington luminosity. The corresponding flat peak (fp) absolute visual magnitude, , depends on the WD mass, which is approximately given by
| (3) |
for the solar composition of WD envelopes, or by
| (4) |
for carbon and oxygen enrichments of , where these two relations are valid for . These flat peak absolute magnitudes give a standard candle instead of the Eddington luminosity. Comparing the above flat peak visual magnitude with the maximum visual magnitude (see Figs. 2 and 5), we may conclude that the nova outburst was 1.8 mag super Eddington for V723 Cas (see also Chochol & Pribulla, 1998) and, at least, 2.0 mag super Eddington for V463 Sct. Our analysis can be extended to symbiotic novae. For example, we have preliminary analyzed the well-observed symbiotic nova PU Vul (Nova Vul 1979; see e.g., Chochol et al., 1997) and found that its very long (3000 days) flat peak is reproduced with a less massive WD, the details of which will be published elsewhere.
Our steady state wind models show the photospheric velocity km s-1 of the WD and km s-1 of the WD at the very early phase of the flat peak. The wind velocity gradually increases up to km s-1 ( WD) and km s-1 ( WD) in the late phases of the nova outbursts. This is roughly consistent with FWHM km s-1 of the V723 Cas 1995 outburst (Rudy et al., 2002) and FWHM km s-1 of the V463 Sct 2000 outburst (Kato et al., 2002).
The ejected mass by winds is estimated to be for the WD. This is roughly consistent with the observational estimate of (Evans et al., 2003). Kato et al. (2002) suggest, from the presence of [O I] lines, that a large amount of mass has already been ejected before the optical maximum (2000 March 2) of V463 Sct. This is also consistent with our estimations of before the optical maximum and before the spectroscopic observation.
Our main conclusions are summarized as follows:
1. The visual magnitude of a nova attains its maximum and has a flat peak when the envelope mass is massive enough. The duration of a flat peak depends on the initial envelope mass at the ignition. This flat peak can be interpreted as a premaximum halt.
2. The WD mass can be determined by the decline rate in the decay phase if the composition of a nova envelope is known.
3. The premaximum halt works as a standard candle of the Eddington luminosity. Thus we are able to calibrate the absolute magnitude of nova light curves by fitting our calculated light curve.
4. The degree of the super-Eddington luminosity reached by a nova in the visual maximum is estimated by the premaximum halt: 1.8 mag for V723 Cas and 2.0 mag for V463 Sct.
References
- Bruch (1982) Bruch, A. 1982, PASP, 94, 916
- Chochol & Pribulla (1997) Chochol, D., & Pribulla, T. 1997, Contributions of the Astronomical Observatory Skalnate Pleso, 27, 53
- Chochol et al. (1997) Chochol, D., Pribulla, T., Tamura, S., Tajitsu, A., & Kanamitsu, O. 1997, Physical Processes in Symbiotic Binaries, ed. J. Mikołajewska, (Warsaw, Copernicus Foundation for Polish Astronomy), 127.
- Chochol & Pribulla (1998) Chochol, D., & Pribulla, T. 1998, Contributions of the Astronomical Observatory Skalnate Pleso, 28, 121
- Chochol et al. (2003) Chochol, D., Pribulla, T., Parimucha, Š., & Vaňko, M. 2003, Baltic Astronomy, 12, 610
- Evans et al. (2003) Evans, A. et al. 2003, AJ, 126, 1981
- Friedjung (1992) Friedjung, M. 1992, A&A, 262, 487
- Goranskij et al. (2000) Goranskij, V. P., Shugarov, S. Y., Katysheva, N. A., Shemmer, O., Retter, A., Chochol, D., & Pribulla, T. 2000, Inf. Bull. Variable Stars, 4852
- Gonzalez-Riestra et al. (1996) Gonzalez-Riestra, R., Shore, S. N., Starrfield, S., & Krautter, J. 1996, IAU Circ., 6295
- Hachisu & Kato (2001b) Hachisu, I., & Kato, M. 2001b, ApJ, 558, 323
- Hachisu et al. (2004) Hachisu, I., Kato, M., & Kato, T. 2004, ApJ, 606, L139
- Hachisu et al. (2000) Hachisu, I., Kato, M., Kato, T., & Matsumoto, K. 2000, ApJ, 528, L97
- Hachisu et al. (1996) Hachisu, I., Kato, M., & Nomoto, K. 1996, ApJ, 470, L97
- Hachisu et al. (1999a) Hachisu, I., Kato, M., & Nomoto, K. 1999a, ApJ, 522, 487
- Hachisu et al. (1999b) Hachisu, I., Kato, M., Nomoto, K., & Umeda, H. 1999b, ApJ, 519, 314
- Iijima et al. (1998) Iijima, T., Rosino, L., & della Valle, M. 1998, A&A, 338, 1006
- Kato (1983) Kato, M. 1983, PASJ, 35, 507
- Kato (1997) Kato, M. 1997, ApJS, 113, 121
- Kato (1999) Kato, M. 1999, PASJ, 51, 525
- Kato & Hachisu (1994) Kato, M., & Hachisu, I., 1994, ApJ, 437, 802
- Kato et al. (2002) Kato, T., Uemura, M., Haseda, K., Yamaoka, H., Takamizawa, K., Fujii, M., & Kiyota, S. 2002, PASJ, 54, 1009
- Kiyota et al. (2004) Kiyota, S., Kato, T., & Yamaoka, H. 2004, PASJ, 56, S193
- Kürster & Barwig (1988) Kürster, M., & Barwig, H. 1988, A&A, 199, 201
- Munari et al. (1996) Munari, U., et al. 1996, A&A, 315, 166
- Ohsima et al. (1996) Ohsima, O., Akazawa, H., & Ohkura, N. 1996, Inf. Bull. Variable Stars, 4295
- Orio & Shaviv (1993) Orio, M., & Shaviv, G. 1993, Ap&SS, 203, 273
- Payne-Gaposchkin (1957) Payne-Gaposchkin, C. 1957, The Galactic Novae (Amsterdam: North-Holland)
- Prialnik & Kovetz (1995) Prialnik, D., & Kovetz, A. 1995, ApJ, 445, 789
- Rudy et al. (2002) Rudy, R. J., Venturini, C. C., Lynch, D. K., Mazuk, S., Puetter, R. C. 2002, ApJ, 573, 794
- Schenker (1999) Schenker, K. 1999, PhD thesis, Basel University
- Warner (1989) Warner, B. 1989, Classical Novae, eds. M. F. Bode & A. Evans (Chichester: John Wiley & Sons Ltd.), p.1
- Warner (1995) Warner, B. 1995, Cataclysmic variable stars, Cambridge, Cambridge University Press