Shot cutoff timescales in different spectral states of Cygnus X-1
Abstract
We investigate the shot cutoff timescale evolutions during different spectral states in the black hole binary Cygnus X-1 with the recently proposed spectral analysis technique. For low energy shots, their cutoff timescale decreases from the low state to intermediate state, and to high state monotonically. However in the high energy range, where shots are believed to be reprocessed in the hot corona, timescales are almost the same for different spectral states. A linear correlation is found between the energy spectrum photon index and the shot cutoff timescale at low energies. Both narrow and broad iron K lines are distinguished from timing analysis, providing dynamical evidence that broad and narrow iron lines originate respectively at small and large radii of the accretion disk. Possible mechanisms for state transitions and accretion flow geometry in accreting stellar mass black holes are discussed.
1 Introduction
The Galactic X-ray source Cyg X-1 is one of the brightest stellar mass black holes and is the first object classified as a black hole X-ray binary (BHXB) (for reviews of BHXBs see e.g. Tanaka & Lewin, 1995; McClintock & Remillard, 2004). BHXBs are known to exhibit five different X-ray spectral states, i.e., the quiescent, low/hard, intermediate, high/soft and very high state. In the canonical black hole system Cyg X-1, only three of them have been seen, i.e., the common low/hard state with a power-law spectrum of photon index 1.4–1.9 with a characteristic cutoff around 100 keV (Done et al., 1992; Dove et al., 1998; Pottschmidt et al., 2003a), and the high/soft state with a power-law index 2.2–2.7 which often extends up to 500 keV without a cutoff (Zhang et al., 1997; Cui et al., 1997; Cui, Feng & Ertmer, 2002; Pottschmidt et al., 2003b), and the intermediate state with properties between the low and high states (Belloni et al., 1996).
The understanding of state transitions is usually associated with different properties of the accretion flow. Most models relate states with different accretion rate , e.g., the advection-dominated accretion flow (ADAF) model (Esin, McClintock & Narayan, 1997; Esin et al., 1998). In the ADAF models of Esin et al. (1998), different states are described by different and transition radii, i.e., (Schwarzschild Radius) for the low state and for the high state. However, recently Lu, Lin & Gu (2004) have shown that for a smoothly matched Shakura-Sunyaev disk and ADAF. Alternatively, Zhang, Cui & Chen (1997) proposed that the high and low states might correspond to either a prograde or a retrograde disk around a Kerr black hole; a temporary disk reversal leads to transitions in a wind accretion system such as Cyg X-1. In this model, the ratio between the inner accretion disk radii in low and high states is 2–3. Young et al. (2001) suggested that a surface ionization change would cause the state transition; the ratio of the accretion power dissipated in the corona to that dissipated in the disk determines the spectral state; in this model the inner accretion disk radius remains unchanged. Homan et al. (2001) argued that the other parameter must exist to trigger state changes apart from and might be a relative size of a Comptonizing region. Therefore, the state transitions are not yet understood completely.
The iron K emission has been used as an effective probe to study relativistic effects around black hole systems, because it is one of the most prominent spectral features generated very close to the innermost stable circular orbit (ISCO) of the black hole (Reynolds & Begelman, 1997; Wang et al., 2000; Wilms et al., 2001; Fabian et al., 2002; Reynolds & Nowak, 2003). Among all Galactic BHXBs, Cyg X-1 produces one of the brightest iron K line emissions, with both narrow and broad lines discovered by a variety of instruments (for ASCA see Ebisawa et al. 1996; for BeppoSAX see Frontera et al. 2001; for Chandra see Miller et al. 2002 and Schulz et al. 2002). Current understanding of Fe lines is provided mainly from energy spectral analysis; limited dynamical evidence has been available.
Recently Feng, Li & Zhang (2004, hereafter Paper I) proposed a new statistics to detect shot timescales very sensitively, which is defined as the differential coefficient of the mean absolute difference of the time series , with being the index and being the time resolution:
where the averaging process is on the index . By selecting different time resolution through binning on the original time series, a spectrum of is obtained. In practice it is necessary to eliminate the digital phase effect of binning and subtract the background component; please refer to Paper I for details. From simulations we know the spectrum is very sensitive to shot width, but insensitive to shot profile, amplitude and periodicity; the timescale in spectrum refers to the width of a pulse signal rather than the 1/frequency in the Fourier concept.
With this technique black hole binaries and neutron star binaries are well distinguished depending upon if there is a cutoff at small timescales in the spectrum. For a black hole binary such as Cyg X-1, its spectrum presents a sharp cutoff at the small timescale, which can be measured accurately and is thus defined as the “shot cutoff timescale”. A brief introduction of this technique for energy dependent analysis of shot cutoff timescale is presented in § 3. In this paper, we make further analysis on Cyg X-1 data with the spectrum, by presenting its shot timescales at different energies in its three spectral states, as well as its shot timescale evolution within each state when its flux and energy spectral index change. We also report the discovery of both broad and narrow Fe line features from Cyg X-1’s shot timescale analysis, providing dynamical evidence for the origin of the Fe lines.
2 Observations and data analysis
We use observations from the Proportional Counter Array (PCA) onboard the Rossi X-ray Timing Explorer (RXTE). Data sets used in this paper include observations of two low states, two intermediate states, and two high states (for details see Table 1). The data were screened with pointing offset 0.02° and elevation angle 10°. The light curves were recorded with a time resolution of 1 ms for 1998-Dec-25 and 4 ms for others, divided into 8 energy channels in binned data mode at low energies and event encoded mode at high energies. Energy spectra are extracted from Standard-2 files including only top layer events, and fitted in the XSPEC 11.3 (Arnaud, 1996). When calculating the spectra, every segment contains 50,000 bins.
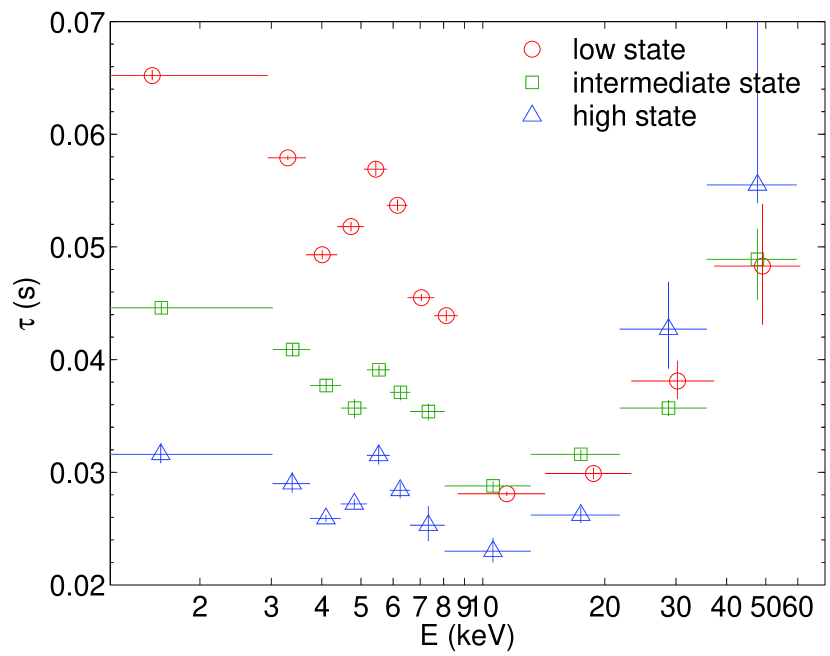
In Figure 1, the energy dependent shot cutoff timescales in the low, intermediate and high states of Cyg X-1 are presented respectively. The profile contains two parts, a descending part at low energies and an ascending part at high energies, separated by a “turning point” located around 10 keV (for details see Paper I). It is shown clearly that below the “turning point” (the descending part), cutoff timescales decrease when the spectral state becomes high/soft. However above the “turning point”, timescales in three states are almost the same.
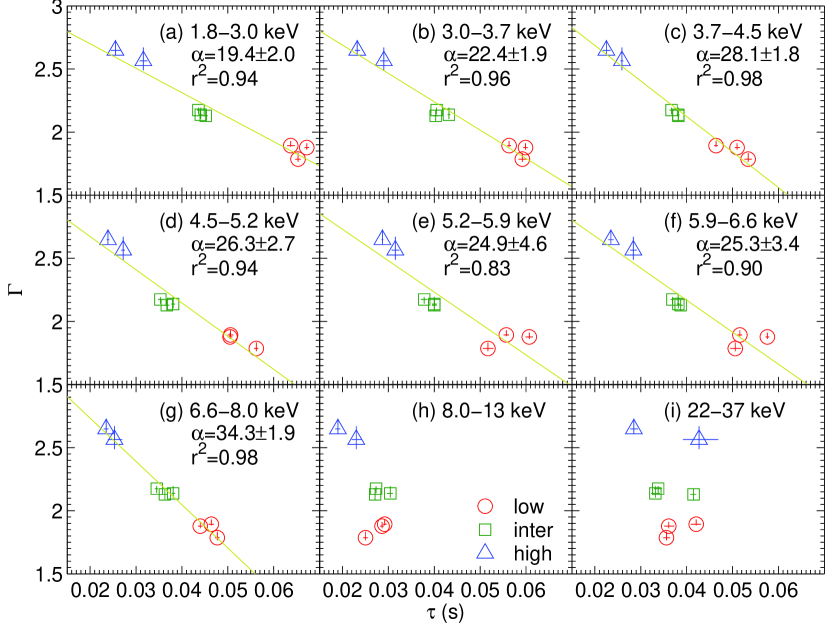
To study the inner-state shot timescale evolution as well as the state transitions, power-law spectrum photon indices and shot cutoff timescales at different states and different energy bands are shown in Figure 2. Every energy spectrum is fitted by a multi-color disk model (Mitsuda et al., 1984; Makishima et al., 1986) plus a power-law model with a reflection component (Magdziarz & Zdziarski, 1995), i.e., diskbbpexrav, in the energy range from 3 to 30 keV. It is obviously shown that at low energy bands from panels (a) to (g), is inversely proportional to , with a solid line indicating the best-fitted line with slope, standard error and correlation coefficient labelled. While at energies larger than the “turning point” in panels (h) and (i), there is no correlation between and . Also in the Fe K band in panels (e) and (f), the correlation at low state is somewhat weak. The best-fitted line slope at the low energy bands seems to increase with energy increasing except in the Fe line band.
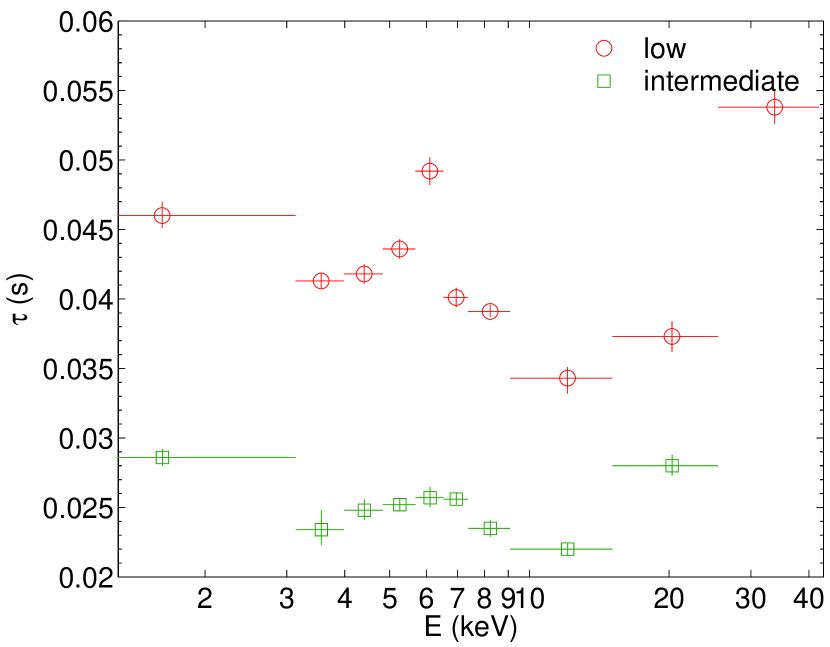
From a large number of shot cutoff timescales versus energy, two typical instances, one in the intermediate state (due to its intermediate counting rates and photon index) and the other in a low state, are selected and shown in Figure 3. The one in the intermediate state has a broad Fe peak and the other in the low state contains both broad and narrow Fe lines.
3 Discussion
With the help of the spectrum, shot cutoff timescales can be sensitively detected. An energy dependent analysis may be used to constrain the different spatial scales of the accreting system (see Paper I). In this work, we study the evolutions of the shot timescales at different energies: a long-term evolution corresponding to state transitions and a short-term evolution corresponding to the inner-state variations.
In the scope of our discussion, we only consider the shot model as Poutanen & Fabian (1999), in which the shot timescale is related to the Keplerian timescale, and therefore corresponds to the spatial scale of the accretion flow .
It is useful to explain clearly the meaning of the “shot cutoff timescale”. For a monochromatic shot, the spectrum may be used to detect its width distribution. A complete study of shot behaviors should be carried out in a three dimensional space including timescale distributions at different energies. The cutoff timescale is thus a kind of characteristic timescale in this distribution, corresponding to roughly the shortest shot width of all shots at the given energy. For instance, in our consideration of shots modeled by Poutanen & Fabian (1999), the shot cutoff timescale at a certain energy means the smallest radius of the disk or the corona where the energy shot is generated. Please refer to Paper I for further explanations and discussions on the meaning and significance of the “shot cutoff timescale”.
The shot cutoff timescale versus energy for an accreting black hole system contains three components, the descending and ascending components separated by a “turning point”, and a broad peak component about 6 keV. The descending part is possibly originated from emissions in the disk, with higher energy shot located at inner radius causing a decreasing of timescale with increasing energy. The ascending part is related to emissions (properly speaking, reprocessed emissions) from the corona; shots are Compton up-scattered to increase energy as well as timescale. In this scenario, the “turning point” is thought to correspond to the innermost region of the accretion disk, where radiations are most variable. The broad peak around 6 keV is caused by the Fe K fluorescence deduced from the relevant energy spectral analysis.
We also want to make it explicit that the measured timescale at the Fe emission line energy only indicates the behavior of the line shot rather than the continuum shot. The time lag of a shot in Cyg X-1 is much smaller than the shot timescale (Negoro, Kitamoto & Mineshige, 2001). Therefore, the measured light curve profiles are overlapped for line shot and continuum shot, with the overlapped width approximately equal to the line shot width. Since the spectrum is only sensitive to shot width rather than shot profile, the detected timescale at Fe line energy only reflects the width of the Fe line shot.
Based on these understandings, we interpret the results in the following parts separately.
3.1 Disk truncation radius in different states
From the descending part in Figure 1, the difference between timescales in the low state with that in the high state decreases with the energy until the “turning point”, at which, s and s for these two observations respectively. Emissions from the “turning point” are thought being generated from the innermost region of the disk. If the shot timescale is related to the Keplerian timescale (e.g., in the magnetic flare model by Poutanen & Fabian, 1999), i.e., , the innermost radius ratio for low and high states is . However this result is significantly different from the ADAF estimate of Esin et al. (1998), in which the ratio between the transition radii for the low and high states is larger than 10. This ratio is marginally consistent with the ADAF model of Lu, Lin & Gu (2004), or the reversal disk model of Zhang, Cui & Chen (1997). The ionization model proposed by Young et al. (2001) seems to explain the result more naturally, in which the disk will always extend to the ISCO; different states correspond to different ionization parameters and surface densities determined by the ratio of energy dissipated in the corona to the disk.
3.2 Corona
It is reasonable to assume that the ascending part in Figure 1 is dominated by corona (reprocessed) emissions due to the high photon energies, and partially affected by the disk reflection component. The Comptonization in the corona will naturally show a positive correlation between energy and timescale, with multiple scattering expanding shot width and increasing shot energy simultaneously (e.g., Sunyaev & Titarchuk, 1980; Titarchuk, 1994). The extended corona model (Kazanas, Hua & Titarchuk, 1997) with a radial density distribution predicts shot width grows with energy. However the auto-correlation function (ACF) analysis gives an opposite result, with ACF width decreasing with energy from 2 to 40 keV (Maccarone et al., 2000). Our spectrum is sensitive to real shot pulse rather than the variability of the thermal emissions (see detailed comparisons in Paper I), and is thus more suitable for shot analysis. In fact, the predicted width-energy correlation from the extended corona model is verified in the shot cutoff timescale versus energy at energies above 10 keV for Cyg X-1, as shown in Figure 1.
We make Monte-Carlo simulations of the extended corona model to compare with our results. In this model, the corona consists of an uniform-density inner core and a -density outer shell, with the same density at the boundary between the inner core and outer shell. The electron temperature and optical depth are fixed in simulation from energy spectral fitting, as of 46, 21 and 26 keV, of 2.87, 1.53 and 0.61 for the low, intermediate and high state, respectively (the low state values are fitted from the HEXTE data; the intermediate and high state values are taken from Maccarone & Coppi 2002). Therefore, the best-fitted inner core radius is 11, 7 and 30 , and the inner core density is 2.0, 1.9 and 0.3 cm-3 for the low, intermediate and high state, respectively; we adopt the mass as 10 (Herrero et al., 1995; Kubota et al., 1998) and the inclination angle as 35° (Gies & Bolton, 1986) for Cyg X-1.
Our results indicate that in the low state, the corona is smaller and denser than the high state; the corona configuration in the low and intermediate state is similar. This conclusion contradicts the unified accretion model of Esin, McClintock & Narayan (1997). We would like to mention that the uniform-density corona model (e.g. Payne, 1980; Titarchuk, 1994) provides a much worse fit to our results compared to the extended corona model.
3.3 Evolutions of the accretion disk within and between states
From Figure 2, a tight linear correlation is found between photon index and shot cutoff timescale at low energies, in particular at energy bands without Fe K contamination. This correlation exists between the three states as well as within every individual state. Because the tightest correlations appear at low energy bands outside of the Fe line region, of which emissions are thought to originate from the disk without reflection, this might suggest that the accretion disk evolves in the same way from the low/hard state to the high/soft state: for shots with the same energy, a steeper power-law corresponds linearly to a shorter cutoff timescale, and thus a smaller accretion disk radius at which the shots are generated. Therefore this linear correlation may place tight constraints to any theoretical model for state transitions in black hole binaries.
3.4 Fe K behavior
Timescale-broadening of both broad line (Case I) and narrow line (Case II) is revealed in our results (Figure 3), with Case I in an intermediate state, and both Case I and Case II in a low state. Case I is possibly caused by light bending (Fabian & Vaughan, 2003; Miniutti et al., 2004). For Case II, the increased timescale possibly due to light travelling time can be inferred from the irradiating region scale and the disk inclination as , denoting the crossing time between the center and the far side of the irradiated disk by a point source located in the center. From Figure 3, due to the minimum timescale from corona is the “turning point”, s, thus corresponding to the irradiated region . If considering the corona with a scale covering the disk, the irradiated region will be larger, as evidence that the narrow Fe line is produced at large radii from the central black hole.
References
- Belloni et al. (1996) Belloni, T. et al. 1996, ApJ, 472, L107
- Chen et al. (2000a) Chen, L. et al. 2000a, Chinese J. Astron. Astrophys., 24, 297
- Chen et al. (2000b) Chen, L. et al. 2000b, Chinese J. Astron. Astrophys., 24, 159
- Cui et al. (1997) Cui, W. et al. 1997, ApJ, 474, L57
- Cui, Feng & Ertmer (2002) Cui, W., Feng, Y. X, & Ertmer, M. 2002, ApJ, 564, L77
- Arnaud (1996) Arnaud, K. A., 1996, Astronomical Data Analysis Software and Systems V, eds. G. Jacoby and J. Barnes, ASP Conf. Series, 101, 17
- Done et al. (1992) Done, C. et al. 1992, ApJ, 395, 275
- Dove et al. (1998) Dove, J. B. et al. 1998, MNRAS, 298, 729
- Ebisawa et al. (1996) Ebisawa, K. et al. 1996, ApJ, 467, 419
- Esin, McClintock & Narayan (1997) Esin, A. A., McClintock, J. E., & Narayan, R. 1997, ApJ, 489, 865
- Esin et al. (1998) Esin, A. A. et al. 1998, ApJ, 505, 854
- Fabian & Vaughan (2003) Fabian, A. C., & Vaughan, S. 2003, MNRAS, 340, L28
- Fabian et al. (2002) Fabian, A. C. et al. 2002, MNRAS, 335, L1
- Feng, Li & Zhang (2004) Feng, H., Li, T. P. & Zhang, S. N. 2004, ApJ, 606, 424 (Paper I)
- Frontera et al. (2001) Frontera, F. et al. 2001, ApJ, 546, 1027
- Gies & Bolton (1986) Gies, D. R., & Bolton, C. T. 1986, ApJ, 304, 371
- Herrero et al. (1995) Herrero, A. et al. 1995, A&A, 297, 556
- Homan et al. (2001) Homan, J. et al. 2000, ApJS, 132, 377
- Kazanas, Hua & Titarchuk (1997) Kazanas, D., Hua, X. M., Titarchuk, L. 1997, ApJ, 480, 735
- Kubota et al. (1998) Kubota et al. 1998, IAU, 388
- Liu & Li (2004) Liu, C. Z., & Li, T. P. 2004, ApJ, in press
- Lu, Lin & Gu (2004) Lu, J. F., Lin, Y. Q., & Gu, W. M. 2004, ApJ, 602, L37
- Maccarone & Coppi (2002) Maccarone, T. J., & Coppi, P. S. 2002, MNRAS, 335, 465
- Maccarone et al. (2000) Maccarone, T. J. et al. 2000, ApJ, 537, L107
- Magdziarz & Zdziarski (1995) Magdziarz, P., & Zdziarski, A. A. 1995, MNRAS, 273, 837
- Makishima et al. (1986) Makishima et al. 1986, ApJ, 308, 635
- McClintock & Remillard (2004) McClintock, J. E., & Remillard, R. A. 2004, Black Hole Binaries, eds. W. H. G. Lewin and M. van der Klis, Cambridge Univ. Press
- Miller et al. (2002) Miller, J. M. et al. 2002, ApJ, 578, 348
- Miniutti et al. (2004) Miniutti, G. et al. 2004, MNRAS, 344, L22
- Mitsuda et al. (1984) Mitsuda et al. 1984, PASJ, 36, 741
- Negoro, Kitamoto & Mineshige (2001) Negoro, H., Kitamoto, S., & Mineshige, S. 2001, ApJ, 554, 528
- Payne (1980) Payne, D. G. 1980, ApJ, 237, 951
- Pottschmidt et al. (2003a) Pottschmidt, K. et al. 2003a, A&A, 407, 1039
- Pottschmidt et al. (2003b) Pottschmidt, K. et al. 2003b, A&A, 411, L383
- Poutanen & Fabian (1999) Poutanen, J., & Fabian, A. C. 1999, MNRAS, 306, L31
- Reynolds & Begelman (1997) Reynolds, C. S., & Begelman, M. C. 1997, ApJ, 488, 109
- Reynolds & Nowak (2003) Reynolds, C. S., & Nowak, M. A. 2003, Phys. Rep., 377, 389
- Schulz et al. (2002) Schulz, N. S. et al. 2002, ApJ, 565, 1141
- Sunyaev & Titarchuk (1980) Sunyaev, R. A., & Titarchuk, L. G. 1980, A&A, 86, 121
- Tanaka & Lewin (1995) Tanaka, Y., & Lewin, W. H. G. 1995, X-ray Binaries, ed. W. H. G. Lewin et al. (Cambridge: Cambridge Univ. Press), 126
- Titarchuk (1994) Titarchuk, L. 1994, ApJ, 434, 570
- Wang et al. (2000) Wang, J. M. et al. 2000, ApJ, 544, 381
- Wilms et al. (2001) Wilms, J. et al. 2001, MNRAS, 328, L27
- Young et al. (2001) Young, A. J. et al. 2001, MNRAS, 325, 1045
- Zhang, Cui & Chen (1997) Zhang, S. N., Cui, W., & Chen, W. 1997, ApJ, 482, L155
- Zhang et al. (1997) Zhang, S. N. et al. 1997, ApJ, 477, L95