Evolution of Massive Stars
Up to the End of Central Oxygen Burning
Abstract
We present a detailed study of the evolution of massive stars of masses 15, 20, 25 and 30 assuming solar-like initial chemical composition. The stellar sequences were evolved through the advanced burning phases up to the end of core oxygen burning. We present a careful analysis of the physical characteristics of the stellar models. In particular, we investigate the effect of the still unsettled reaction 12C(,)16O on the advanced evolution by using recent compilations of this rate. We find that this rate has a significant impact on the evolution not only during the core helium burning phase, but also during the late burning phases, especially the shell carbon-burning. We have also considered the effect of different treatment of convective instability based on the Ledoux criterion in regions of varying molecular weight gradient during the hydrogen and helium burning phases. We compare our results with other investigations whenever available. Finally, our present study constitutes the basis of analyzing the nucleosynthesis processes in massive stars. In particular we will present a detail analysis of the s-process in a forthcoming paper.
1 INTRODUCTION
Study of the evolution of massive stars through the advanced burning phases up to the collapse of the iron core is an active and complex field of research in stellar astrophysics. However, this does not mean that the early hydrogen and helium burning phases are less important. Modeling stars is an initial value problem, and as we shall see in this paper, these early phases determine in a crucial way the initial conditions for the following burning phases, and the resulting stellar nucleosynthesis. Therefore, despite several recent works dealing with the late evolution of massive stars (e.g. Chieffi et al., 1998; Limongi et al., 2000; Woosley et al., 2002; Imbriani et al., 2001) an up-to-date, systematic study that also emphasizes the effect of the early stellar phases on the later ones seems useful as well as a discussion of uncertainties in key assumptions in the models.
The main emphasis of this paper, then, is an exploration of the physical conditions during the later burning phases of massive stars, how they are set by earlier burning stages, and how they are affected by uncertainties that remain in the input to the models. A proper understanding of these issues is important not only for clarifying the evolution of massive stars but also for an accurate accounting of the stellar nucleosynthesis.
In this work, we present a systematic discussion of the evolution of massive stars through the H, He, C, Ne, and O burning phases. We have made some effort to study the influence of uncertain physical assumptions on the evolution. In §2, we give a brief description of the stellar evolution code we have used in the present calculations. Section 3 and its subsections contain a detailed discussion of the characteristics of the burning phases mentioned above. In §4, we compare our results with those of other works. Section 5 contains our conclusions.
2 STELLAR EVOLUTION CODE
The stellar evolution code used in this work is generally described in The et al. (2000). As in our previous work, the nuclear reaction network in the code contains 632 nuclear species, which allows us to follow most stellar nucleosynthesis processes, including the s-process nucleosynthesis, in detail. For the present version of the code, we have updated the nuclear data. We now use nuclear masses from compilation of Audi & Wapstra (1995) and thermonuclear reaction rates from the compilation of the “NACRE” European collaboration (Angulo et al., 1999), and the “Non-Smoker” compilation of Rauscher & Thielemann (2000).
In various stellar sequences described in §3, we have used different reaction rates for the reaction , which is still unsettled. The latest compilation is due to Kunz et al. (2002). As stated in that work, the cross section of this reaction is extremely small (10-17 barn) at the energies relevant to core helium burning; therefore, one has to rely on measurements at higher energies to obtain the S-factor at the relevant stellar energies by extrapolation.
Kunz et al. (2002). seem to have succeeded in reducing the uncertainties in the evaluation of the cross section at stellar temperatures. Fig. 1 shows clearly a different temperature dependence of the rate obtained by Kunz et al. (2002) compared to other compilations. Normalized to the rate of Caughlan & Fowler (1988) (hereafter CF88), we see that we are dealing with a different rate in the range of helium burning (1.3-3.7108 K) and of carbon burning in the vicinity of T9 = 1. The implication of this new rate will be discussed in §3 and 4.
3 CHARACTERISTICS OF THE BURNING PHASES
We present evolutionary sequences for stars of masses 15, 20, 25, and 30 M☉ having solar-like initial chemical composition (Anders & Grevesse, 1989). All the evolutionary sequences have been evolved up to the end of central oxygen burning. Most models included mass loss by stellar wind according to the semiempirical relation by de Jager et al. (1988) and used the Schwarzschild criterion for convection throughout the star. In order to study the effects of mass loss, the treatment of convective mixing in chemically inhomogeneous layers, and the uncertainty in the 12C(,)16O reaction rate, we calculated several evolutionary sequences with different input physics as summarized in Table 1. The only sequence calculated without mass loss is for the 25 star (referred to as 25NM) in Table 1. The case 25N is the same as 25NM, but mass loss is included here. The case 25L is identical to 25N except that the Ledoux criterion for convection was adopted in the region of the H-burning shell (see §3.1 for details). In the sequence 25K, the rate for the reaction 12C(,)16O was used according to Kunz et al. (2002), instead of the NACRE rate used in 25N.
Fig. 2a shows the HR diagram for our four evolutionary sequences 15, 20, 25N, and 30 M☉. Physical characteristics of these tracks are described in §3.1 with help of Figs. 2b and 3.
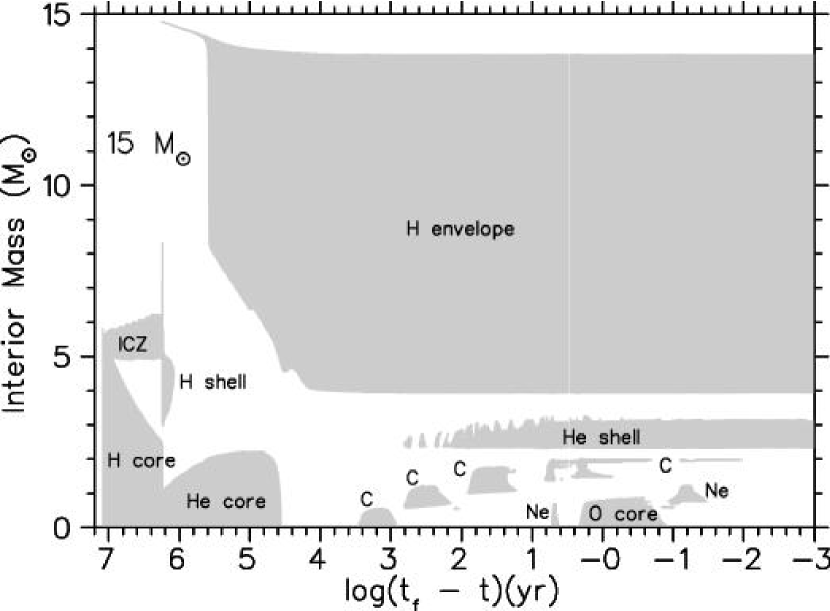
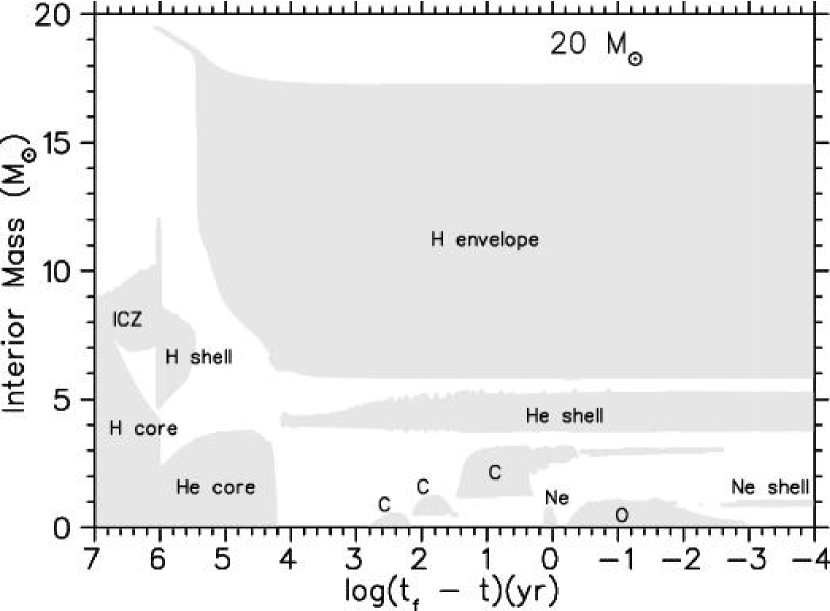
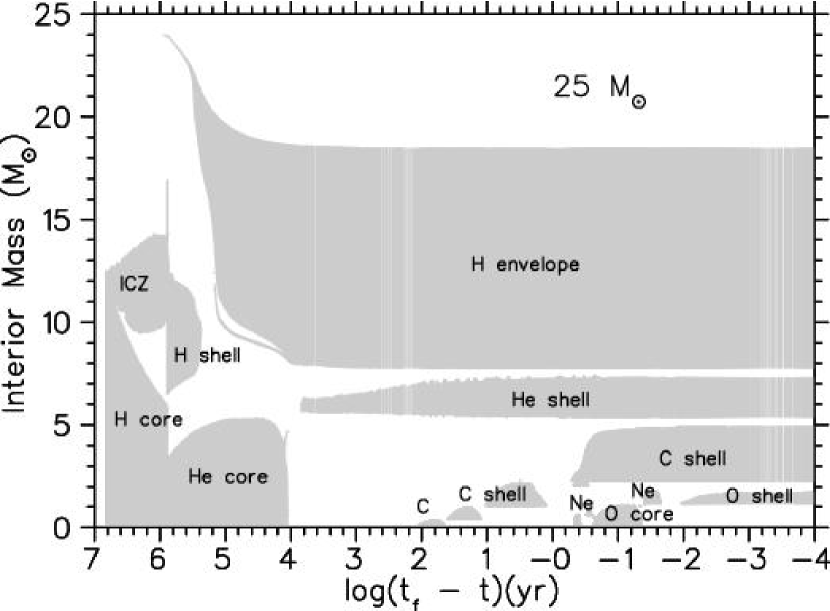
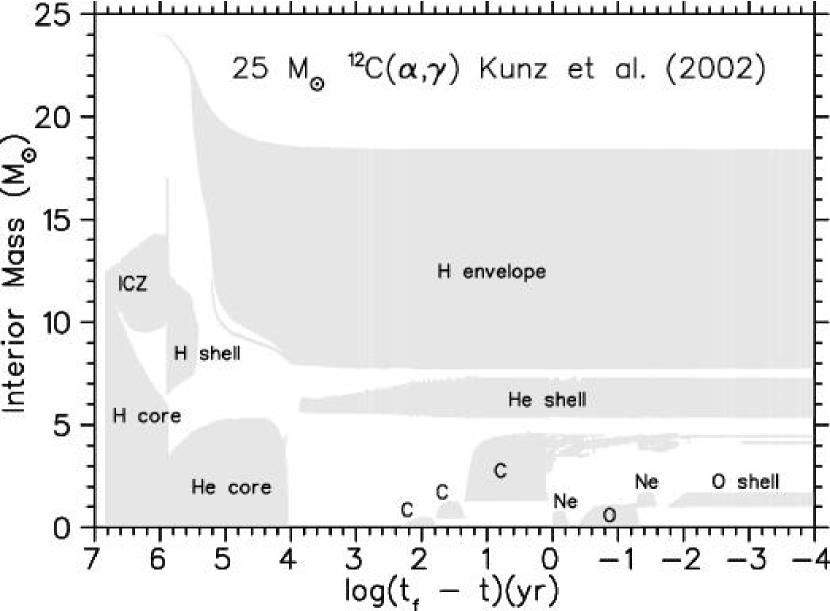
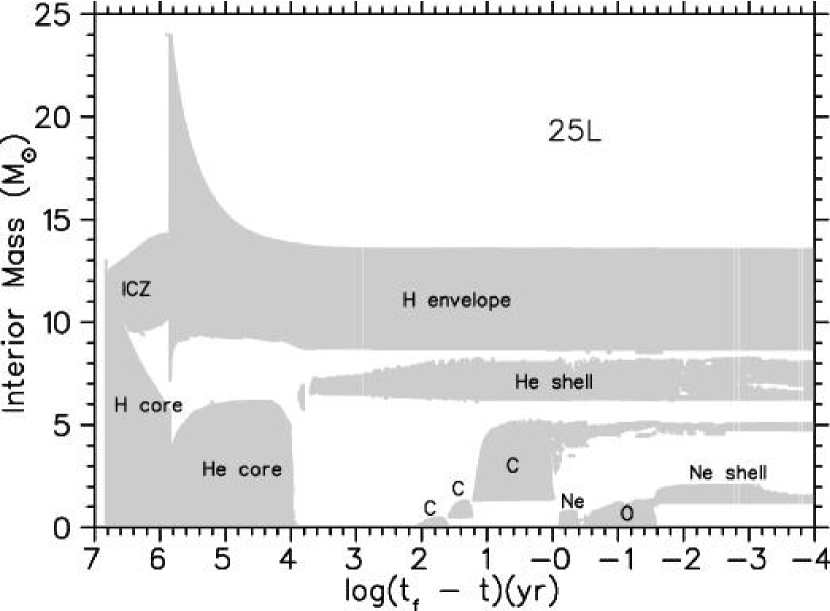
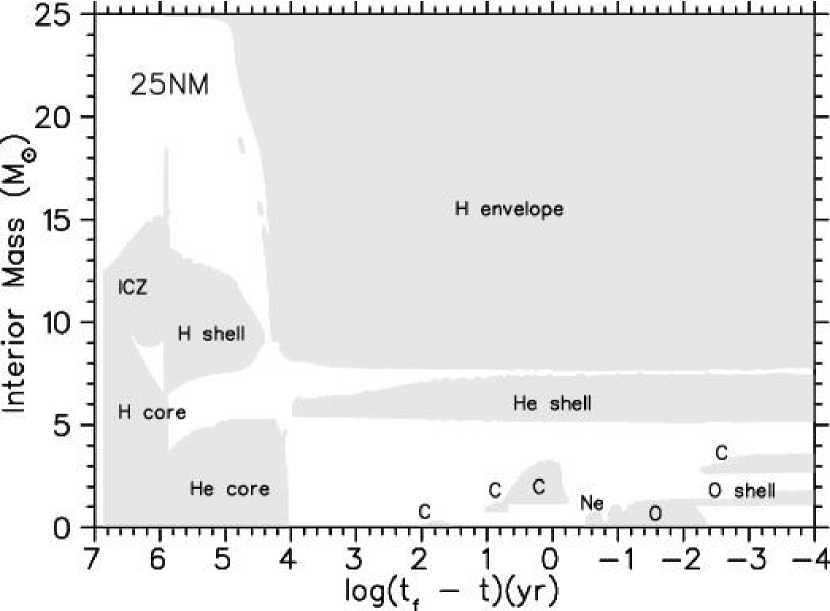
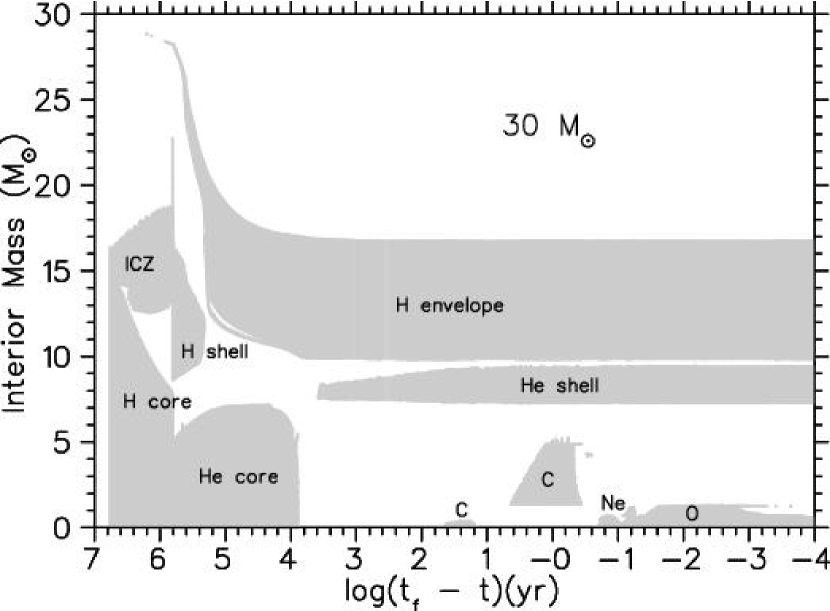
Figs. 4-10 show the change of the internal structure of the stellar models at a given time for all sequences listed in Table 1. In these figures we have labeled all convective zones according to their physical origin, whether due to nuclear burning in a core or in shell region, or in a star’s envelope, or in an intermediate convection zone (referred to as ICZ) formed in the outer stellar layers above the receding convective core during core H-burning. We will use these figures to describe the global characteristics of successive burning phases as they occur in our evolutionary models. Note that the ICZ in Figs. 4-10 contain the semiconvective and convective regions that move in time due to the gradient in hydrogen mass fraction and opacities. In our calculations we do not include semiconvective mixing but apply the Ledoux criterion in order to avoid introducing another parameter in our calculations which is so far needed for describing semiconvective mixing.
3.1 Hydrogen and Helium Burning Phases
It is well known that significant changes of the evolutionary tracks occur during the hydrogen and helium burning phases of massive stars; therefore, we show in Fig. 2a the evolutionary tracks in the HR-diagram for the stars under consideration. In all models, we adopt the Schwarzchild criterion for convection to determine the convective regions in a stellar model at a given time, except case 25L described below. The evolutionary tracks in Fig. 2a evolve nearly at constant luminosity after the main sequence phase until they finally reach the red giant branch (RGB). However, this evolution at constant luminosity and, more importantly, the timing to reach the RGB depend crucially on mass loss and on how convective mixing is treated in the stellar layers of variable molecular weight gradient (or simply -gradient) left behind the shrinking hydrogen convective core during the main sequence evolution.
To understand these issues, we may compare different evolutionary sequences as shown in Figs. 2b and 3. Fig. 2b shows the evolutionary tracks when mass loss is neglected as in our case 25NM, or when the convection treatment is different as in case 25L. These cases are discussed below. Fig. 3 shows the effective temperature as a function of the central helium mass fraction X(4He) and demonstrates clearly how the evolution of the star to the RGB is influenced by mass loss. In the case of no mass loss, the star remains in the blue region of the HR diagram during most of its core He-burning. If mass loss is included, then the more massive the star, the stronger is the mass loss and the earlier is the transition to the RGB. In other words, this transition occurs at higher central helium mass fraction X(4He) (see Fig. 3)
To explain the behavior of the evolutionary tracks further, we compare in detail the evolution of the 25 star with and without mass loss. As Fig. 2b shows, the sequence 25NM (without mass loss) has higher luminosity during core hydrogen burning. This is simply a consequence of the higher mass in this case. During core helium burning, however, the explanation is more complicated since now two energy sources are available in the star that contribute to the luminosity: a central source and shell source. Why is the luminosity of the sequence with mass loss lower?. We answer this question with the help of Figs. 6 and 9 showing the change of internal structure in the course of evolution for the sequences 25N and 25NM, respectively. In the early evolution through the hydrogen and helium burning phases, these figures show a remarkably different behavior of the convective zones that forms above the hydrogen-burning shell. In the sequence 25NM, this convective zone is more extended in mass and lasts throughout the whole core helium burning phase. In contrast, in sequence 25N, calculated with mass loss, the convective zone is narrower in mass and disappears before helium exhaustion in the core (at X(4He) 0.1). The implication of this is that the H-burning shell in case 25NM is stronger because it is supplied by more fuel.
The stronger H-burning shell has several consequences on the ensuing evolution:
-
1.
It leads to a higher luminosity of the star during core helium burning (see the tracks for the 25 M☉ star in Fig. 2b.
-
2.
It delays the evolution to the RGB. The star remains as a blue supergiant during most of its core helium burning phase (case 25NM in Fig. 3).
-
3.
It prolongs the duration of the core helium burning owing to the slightly lower central temperature in the case without mass loss (see Table 3).
-
4.
It leads to a larger mass of the hydrogen exhausted core (or simply helium core) = 7.62 M☉ in case 25NM compared to = 7.51 M☉ in case 25N (see Table 3).
We point out that all these features have been recognized by several authors (see Chiosi & Maeder (1986), for a review). We refresh this issue, because it is relevant to our present discussion.
A more pronounced change of the structure of the convective zone formed above the H-burning shell is found when the effect of the mean molecular weight (or simply -gradient) is taken into account to determine the extent of this convective zone. It is well known (for a basic discussion see Kippenhahn & Weigert, 1990, §6) that the -gradient acts to inhibit convection. In this case, convection is no longer a dynamical instability, rather one deals with semiconvection, which is a consequence of thermal instability. The criterion for convection that should be applied in this case is the “Ledoux criterion”:
| (1) |
where the ’s are logarithmic gradients and the quantities and are derivatives obtained from the equation of state (see Kippenhahn & Weigert, 1990). The second term is always positive and consequently inhibits convection. We will describe in the following the results we have obtained for an evolutionary sequence of the 25 star (labeled 25L in Table 1), where we have applied the Ledoux criterion only in the region of varying -gradient, in which the H-burning shell is is effective. Elsewhere in the stellar model, we have used the Schwarzschild criterion for convection. We emphasize that our treatment maximizes the choking effect of the -gradient on convection.
As mentioned above, layers of varying -gradient are semiconvective. There is no general theory that describes the efficiency of this process. When semiconvection is treated as a diffusion process (e.g., Langer et al., 1983, 1985; El Eid, 1995; Woosley et al., 2002 for a recent discussion), then a parameterization of the diffusion coefficient for semiconvection is used. For our present investigation, we avoided using this kind of parameterization by including the whole effect of the -gradient. We adopt the Ledoux criterion in regions of varying -gradient in case 25L and otherwise use the Schwarzschild criterion. A similar approach has been done by Stothers & Chin (1992).
In the following, we summarize the different features in the evolution of the sequence 25L as compared to the case 25K during core helium burning. The choking effect of the -gradient on convection inhibits the formation of a convection zone above the H-burning shell (compare Figs. 8 and 6). There are two key consequences of this. First the H-shell source is weaker in 25L than in 25K, which explains the immediate evolution to the RGB as seen in Fig. 2b. Secondly, owing to the weaker H-burning shell, the mass of the convective core during core helium burning becomes larger in order to supply the luminosity of the star. In 25K, the maximum convective helium core mass is 5.32 while in the case of 25L it is 6.16 . Therefore the H-shell is located farther out in mass in 25L. The helium core mass is Mα = 7.54 for 25K, but 8.33 for 25L.
In addition to the above effects, there are two other consequences of the weaker H-shell. First, the larger mass of the convective core leads to a shorter duration of core helium burning due to the higher central temperature: 6.88105 yrs for 25L compared to 7.49105 yrs for 25K. Second, in the case of a weaker H-shell, the He-shell burning occurs in a region Mr = 6.184 - 8.108 , while in case 25K this region comprises Mr = 5.393 - 7.290 . In other words, when the Ledoux criterion is used in the H-shell region, the He-burning shell migrates farther out by about 0.8 compared to the case with Schwarzschild criterion everywhere in the stellar model.
It is interesting to note that our sequence 25L has many similarities with the sequence of the 25 star calculated by Woosley et al. (2002) (hereafter WHW). We obtain close agreement with these authors concerning the depth of the outer convective envelope and the He-burning shell. We achieve good agreement concerning the higher total mass lost from this star, because in both calculations the stellar sequences evolve directly to the RGB, after the main sequence phase, where mass loss increases significantly. Finally, we also find agreement for the mass of the helium core (see Table 6 for more details).
Summing up this discussion, then, the treatment of convective mixing in the region of varying -gradient where the H-burning shell is active affects many physical quantities relevant to the evolution past core helium burning.
In connection with the early evolution phases, we may also comment on the effects of mass loss and envelope convection on the surface abundances, which are modified when the stellar sequences reach the RGB and develop convective envelopes, such that the processed material is mixed to the surface (the well-known ”first dredge up”). Table 2 shows the surface abundances as they result after the first dredge up for the stars under consideration. The ratio of 12C/13C decreases with increasing stellar mass (15, 20, 25N, and 30) owing to the larger production of 13C by the CNO cycle in more massive stars. When mass loss is neglected as in case 25NM, this ratio becomes larger.
The ratio 14N/15N increases strongly with the stellar mass mainly due to the destruction of 15N by the (p,) reaction in the CNO cycle. At constant mass, 15N is strongly reduced because convective mixing extends over a larger mass of the envelope. Eventually, the ratio 14N/15N may be used as indicator of mass loss.
The ratio 16O/18O is an increasing function of the stellar mass. Its behavior is similar to 14N/15N, although its variation is not so strong.
In contrast to the behavior discussed above, the ratio 16O/17O does not have a monotonic dependence on the stellar mass. This is because the production and destruction of 17O is rather sensitive to temperature variations influencing the reaction 17O(p,)14N in particular. The effect of mass loss leads to a slight decrease of this ratio. The enrichment of sodium compared to solar ([Na/Fe] in Table 2) is an increasing function of the stellar mass owing to the more efficient Ne-Mg cycle in more massive stars.
It may be also interesting to compare the surface isotopic ratios of the the sequence 25L with those of 25N. As shown in Table 2, a significant difference is found for the ratios 14N/15N, 16O/18O and [Na/Fe]. The isotopic ratios of the sequence 25N represent the products of shell hydrogen-burning which was operating at higher temperatures (by a factor of about two at the bottom of the shell) than in case 25L. This is clearly seen by the higher enrichment of Na, and the high destruction of 15N and 18O. These products are mixed to the surface from deeper stellar layers in case of 25N, where the convective envelope penetrates down to 7.6 compared to 8.7 in case 25L. We observe that the surface isotopic ratio in massive stars may depend on how convection is treated in the layer where shell hydrogen burning proceeds.
Table 3 presents a few more details about the stellar sequences listed in Table 1. As may be seen, the final masses of the helium cores, of the stars under consideration are 3.85 for the 15 , 5.70 for the 20 , 7.53 for the 25 with mass loss, and 9.54 for the 30 . As Table 3, indicates, Mα ceases to change at the end of core carbon burning. Our values above are in close agreement with the results by Nomoto & Hashimoto (1988) and Arnett (1996). However, we think that our results are more accurate because those authors followed the evolution of helium cores only, that is without including the H-burning shell in their calculations. We make another comparison with other authors in Table 6 (see §4).
We conclude this section by discussing a very important physical quantity determined at the end of of core He-burning, namely, the central mass fraction of carbon , X(12C). Table 4 shows that using the Kunz et al. (2002) reaction rate for 12C(,)16O leaves a larger X(12C) than using the NACRE rate. As Fig. 1 shows, the Kunz et al. (2002) rate is lower than the NACRE rate for , which explains why the former rate allows for less destruction of 12C during the late stages of core helium burning. Interestingly, among the 25 models, the lowest value of X(12C)–0.193–is obtained for the 25NM. This is due to the higher central temperature encountered in this case which leads to more efficient destruction of 12C. The central X(12C) strongly affects the subsequent evolution of the star (Woosley et al., 1993; Imbriani et al., 2001).
3.2 Carbon Burning Phase
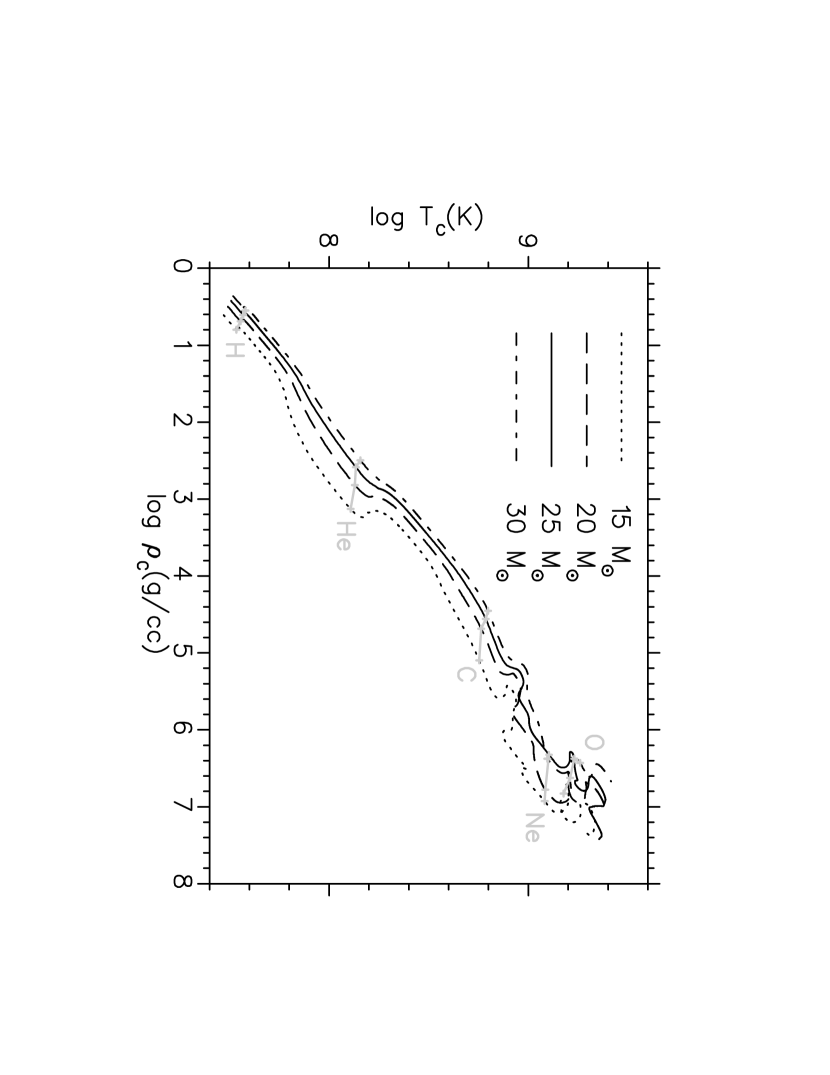
In this section, we present some details about core and shell carbon burning. The evolution of the centers of the stars of masses 15 to 30 in a diagram is shown in Fig. 11 where the ignition temperatures of the calculated burning phases are indicated by the dashed lines (see entry 5 in Table 3). Core carbon burning occurs in the temperature range (0.32 - 1.2)109 K where the lowest value belongs to the 15 star while the highest value belongs to the 30 star.
Core carbon burning in the 15 star occurs in a convective core whose mass reaches a maximum value of 0.55 . The duration of core carbon burning is 6760 yrs. When the carbon is exhausted in the core, shell-carbon burning mediates the evolution toward neon burning; in contrast to the helium-burning shell that has its location in mass radius fixed at all times (see Figs. 4 - 10), carbon burning in a shell exhibits complicated behavior. In the 15 model, two episodes of convective shell C-burning occurs before Ne-ignition where the shell advances in mass (see Fig. 4).
Core carbon burning in the 20 star occurs in a convective core whose mass reaches a maximum of 0.49 . The duration of this phase is 3300 yrs. The shell C-burning proceeds here also in two convective episodes. We note that during the second episode, a broader convective zone is formed than in the 15 model (see Fig. 5).
In the 25 model (case 25N), core carbon burning occurs in a convective core whose mass reaches a maximum of 0.35 . In this case, there are three subsequent carbon shells. The last of these has a range of (2.26 - 4.54) and persists to the end of the calculation. How the shell C-burning proceeds depend crucially on the carbon profile created in the star after core C-burning. Fig. 12a and 12b show clear difference in such profile.
It is interesting to compare the effect of different rates for the reaction 12C(,)16O on carbon burning in the 25 models. Comparison of Figs. 6 and 7 shows the structural evolution of the stellar sequences 25N and 25K as obtained from the Schwarzschild criterion for convection and the different rates of 12C(,)16O as in Table 1. As we saw previously in Table 4, X(12C)=0.236 is left at the end of core helium burning when the rate of 12C(,)16O according to NACRE is used, but X(12C) = 0.280 according to Kunz et al. (2002). The larger X(12C) at the end of core helium burning allows 25K to develop a convective core with a maximum mass of 0.47 in contrast to 0.36 for 25N.
It seems that the higher the value of 12C, the larger is the mass of the convective core during core C-burning. This is due to the well-known interplay between the energy generation rate and neutrino loss rate (Arnett, 1972; Woosley & Weaver, 1986; Chieffi et al., 1998; Limongi et al., 2000). A convective core forms only when the effective energy generation rate (nuclear minus neutrino) is positive. The difference in the mass of the convective core has a consequence on the duration of core C-burning: it lasts 3500 yrs in case 25K, but 1600 yrs in case 25N.
It is also interesting to compare 25N to our sequence without mass loss designated as 25NM in Table 1 and Fig. 9. At the end of core He-burning, X(12C) = 0.193. The low value of X(12C) leads to a maximum mass of 0.23 for the convective core during core C-burning in 25NM, but a duration for this phase of 1860 yrs, longer than in 25N. While the mass of the convective core during core C-burning is correlated to X(12C) at the beginning of this burning phase, the lifetime of this phase has no simple relation to X(12C), because it depends also sensitively on how the center of the stars evolve in a - plane. Fig. 13a shows this kind of evolution is rather complicated, which affects the nuclear energy generation rates and the neutrino loss rates leading to the variation of the lifetime found above.
From Fig. 10 and Table 3, we see that the 30 model has a maximum carbon-convective core mass of 0.39 . This mass is somewhat larger than that in 25N, even though the mass fraction of 12C is larger in 25N than the 30 model, an exception to the general rule that more carbon gives a larger convective carbon core. On the other hand, we note that at the time of core carbon burning, the 30 star has in fact a lower mass than that of 25N. This and the complicated interplay between energy generation and neutrino energy loss obscure a direct relation between the convective core mass and X(12C).
We now focus in more detail on shell C-burning, and consider in particular the 25 sequences. As seen in Figs. 6 and 7, the shell C-burning starts in a first phase near the edge of the former convective core with a convective zone formed above the shell. A second convective phase of this shell burning comprises more mass in the sequence 25K than in 25N. How C-shell burning proceeds depends crucially on the carbon profile left in the star after core C-burning.
Fig. 12a and 12b help to illustrate this point. They show the composition profile of major elements at the end of core Ne burning. The profile of carbon at this stage is clearly different. In the sequence 25K, the second convective phase of C-shell burning comprises more mass compared to that of the sequence 25N. Consequently, C-shell burning in 25K is stronger and leads to a significantly reduced carbon abundance in the mass range 1.5 - 4.0 (see Fig. 12a as compared to Fig. 12b. Clearly, the rate of 12C(,)16O has a significant effect on the properties of the shell C-burning.
To complete the discussion, we point out that a convective core of 0.55 is formed (see Fig. 12b) in the 15 sequence during core C-burning and that shell C-burning proceeds in two convective episodes prior to Ne ignition. By contrast, in the 30 sequence, the mass of the convective core is 0.39 (see Fig. 10) and C-shell burning constitutes only one single convective episode.
When the core C-burning ends and the stars contract toward core Ne-ignition, a third convective C-shell episode starts in all our cases except in the 30 sequence. This third convective C-shell lasts all the time as far as we have carried out calculations beyond core O-burning. Indeed this last phase of C-shell burning seems to survive till core collapse as it is seen in the calculations carried to the collapse phase (Chieffi et al., 1998; Limongi et al., 2000; Woosley et al., 2002).
3.3 Neon Burning Phase
For the stars under consideration, core Ne-burning occurs in the temperature range (1.2 - 1.9)109K (see entry 7 in Table 3). A characteristic of this burning phase is that a convective core is always formed in the mass range of 0.6 - 0.75 , but it exists only during a short time interval during which the effective energy generation rate (nuclear - neutrino) is positive; thus, core Ne-burning is partially radiative and of short duration (3.13 yrs for the 15 , 1.21 yrs for the 20 , 0.33 yrs for the 30 ).
The effect of the rate for the reaction 12C(,)16O is also encountered during this phase. Comparing the sequences 25K and 25N, we find that the convective core attains a maximum mass of 0.61 for 25N, but 0.75 for 25K. The lifetime of core Ne-burning is rather different: 0.294 yrs for 25N, but 3.28 yrs for 25K.
The shorter lifetime of the sequence 25N is not only a consequence of the relatively smaller mass of its convective core, but it can also be traced back to the effect of 12C(,)16O. Sequence 25K achieves a larger central mass fraction of Ne at the end of core carbon burning (0.384, see Table 4). As Figs. 13a and 13b show, this larger Ne mass fraction allows the sequence 25K to evolve at relatively lower central temperatures but higher densities during core Ne-burning than the sequence 25N. It also results in a pronounced expansion phase during core Ne burning, as seen in Fig. 13a, The longer lifetime of core Ne-burning in 25K than in 25N is thus due to fact that 25K has more Ne to burn and does so at relatively lower temperatures.
In the 25 models, the third convective phase of C-shell burning occurs during core Ne-burning. A significant difference exists in this phase between 25K and 25N. In 25K, the convective zone above the C-shell is quite narrow in mass. This is due to the fact that the mass fraction of 12C is relatively high throughout the helium exhausted core; therefore, when carbon burning occurs during the second convective phase of the C-shell, the burning is vigorous, which gives an extended second carbon convective shell and largely depletes the 12C. This makes less carbon available for the third convective carbon shell, which, consequently weaker and narrower. It is interesting to see that the effect of the rate for 12C(,)16O propagates so effectively into the advanced burning phases of massive stars.
3.4 Oxygen Burning Phase
For our stars, core oxygen burning (or O-burning) starts in the temperature range of (1.5 - 2.6)109 K (see entry 9 in Table 3). One common characteristic of our stars when they evolve to this stage is that they develop convective cores of mass in the range of (0.77 - 1.20) as can be seen in Table 3. These relatively high masses result from the fact that all our sequences have high central mass fractions of 16O after completing core Ne burning. Consequently the effective energy generation rate (nuclear - neutrino) is strongly positive throughout this burning phase and proceeds in a convective core (see Figs. 4 to 10).
We observe from Table 3 (entry 10) that the lifetime of core oxygen burning generally decreases monotonically with stellar mass. Higher mass stars typically burn at higher central temperatures for which the + reaction is faster. This also explains the difference in lifetimes of core oxygen burning in 25K and 25N. We see from Table 3 that the former model has a longer core oxygen burning lifetime. This is because it evolves at lower central temperature during the early phase of core oxygen burning (see Fig. 13a ). Again, we trace back the effect of different rates for 12C(,)16O in these cases.
After core oxygen burning, our models typically show a brief shell neon burning phase followed by a shell oxygen phase. Both of these shells are relatively narrow in extent. Our calculations were not carried beyond shell oxygen-burning.
Finally, we show in Fig. 14 the density and temperature profiles inside our stars as far as we have evolved them, mainly beyond core oxygen burning. The jumps in density seen in Fig. 14a indicate clearly the different cores of the star, where the main fuel of a burning phase is exhausted. Our Fig. 14a is rather similar to Fig. 12 obtained by Limongi et al. (2000).
4 COMPARISON WITH OTHER INVESTIGATIONS
It is worthwhile to compare our results with those obtained by other groups with the aim to find out where a close agreement can be achieved and under which physical conditions. This will help in understanding the complex nature of the advanced burning phases of massive stars and the role of key physical assumptions in the stellar models. Such a comparison, which we present in Tables 5 and 6, is laborious owing to the many parameters involved. Nevertheless, it allows us to consider in detail the three important parameters we have investigated: mass loss, treatment of convection in layers of varying -gradient, and the rate of 12C(,)16O.
The mass fraction of 12C left over at the end of core helium burning depends on the 12C(,)16O rate and the treatment of the convection. When comparing our results to those obtained by Limongi et al. (2000) (hereafter LSC) in Table 5 & 6, we note that they have evolved their stars at constant mass, used the rate of Caughlan et al. (1985) (hereafter CFHZ85) for 12C(,)16O, and treated convection on the basis of the Schwarzschild criterion. For the 15 star, Table 5 shows that our results are generally in reasonable agreement with theirs where both models apply the same criterion for convection. There is a difference in the central mass fraction of carbon X(12C) in Table 5 & 6) left over at the end of core helium burning: 0.285 in our case compared to 0.195 according to LSC. The reason for our higher values is due to the lower rate of 12C(,)16O we have used (NACRE’s compilation, see Fig. 1). The higher value of X(12C) in our case is also responsible for the difference in the lifetime of core C-burning and to the higher mass of the convective core we find. Also the difference in the location and extension of the C-burning shell in our case is also attributable to the higher value of X(12C) which determines the carbon profile in the region of the C-shell. A close agreement is found for the Ne-burning phase. For the core O-burning we find a slightly longer lifetime for our 15 sequence.
Our comparison with the results of WHW in Table 5 & 6 reveals that we can present a similar comparison to what we have done for LSC. We note, however, that WHW have used the rate of 12C(,)16O obtained by Buchmann (1996) but multiplied by a factor of 1.2 in their calculations. In Fig. 1, we see that this is comparable to the rate due to Kunz et al. (2002), which is lower than the NACRE rate we have used in the 15 star for T 0.4. WHW also use a relatively large semiconvective diffusion coefficient implying overshooting, semiconvection, and rotation-induced mixing. Therefore, we think that the relatively low value X(12C) = 0.219 obtained by WHW for the 15 at the end of core He-burning is due to the combined effect of both the 12C(,)16O and the treatment of convection. We may also relate the differences for the location and extent of the C-burning shell compared with WHW to the low value of X(12C) in their model. This also explains the differences during core Ne-burning. Close agreement is found for the core O-burning.
In the case of the 25 sequence, our comparison is presented in Table 6 including four of our sequences (25K, 25N, 25NM, 25L). In this case, mass loss by stellar wind is much higher than in the case of the 15 sequence, as may be seen in the second column of Table 3. Our comparison with the results by LSC will be done with 25NM, which, like the LSC model, was evolved at constant mass. On the other hand, our sequence 25N evolved with the same input physics but included mass loss should reveal the effect of that parameter on the evolution.
We find close agreement between our sequence 25NM and that by LSC during the H-burning and He-burning phases. A slight difference is found for the mass of the helium core and the depth of the convective envelope. The quantities listed in Table 6 for core He-burning are in good agreement with those by LSC, including the X(12C). As expected, the differences are more significant when we compare with our sequence with mass loss (25N). Significantly, the value of X(12C) = 0.193 in 25NM is lower than 0.236 in 25N. The reason for this is that, toward the end of core He-burning, or, more precisely, when X(4He) 0.10, the star has evolved to the red giant branch where mass loss increases significantly, as seen in Fig. 15). As a consequence, the star evolves at lower central temperature because it is now a lower mass star. The net result is the high value of X(12C) mentioned above.
Imbriani et al. (2001) have studied the influence of different rates of 12C(,)16O reaction in massive stars. They used the rate of CF88 and that of CFHZ85, which is higher by a factor of 2.7. The CF88 rate led to a central mass fraction of carbon X(12C) = 0.424 at the end of core He-burning, while the second rate led to X(12C) = 0.20. As we have seen, however, when we compare our results for our sequence 25NM with those of LSC, we find close agreement in X(12C) (0.19 in our case to 0.18 in their case). The slight difference is mainly due to the fact that the rate of CFHZ85 for 12C(,)16O used by LSC is about a factor of 1.4 larger than the NACRE rate we have used in 25NM.
We obtain a longer lifetime for the carbon core phase in 25NM than in LSC’s 25 model because in 25NM it occurs partly in a convective core of 0.23 , which is not present in the case of LSC. During core carbon burning phase, it is known that the neutrino energy losses influences significantly the evolution of the central temperature and density of massive stars. Perhaps the difference in the neutrino loss prescription is partly the cause of the difference in the carbon core evolution. Our neutrino energy losses due to pair, photo, plasma, bremsstrahlung, and recombination processes are taken from the analytical approximation of Itoh et al. (1996). LSC adopted the photo, pair, and plasma neutrino energy losses of Munakata et al. (1985) and Munakata et al. (1986), while their bremsstrahlung neutrino energy loss is taken following Dicus et al. (1976) and Richardson et al. (1982) and their recombination neutrino energy loss follows the prescription of Beaudet et al. (1967). Another contributing factor is the larger value of X(12C) at the end of core helium burning in 25NM than of LSC’s 25 model which is due to the smaller rate for O used in 25NM. The presence of a convective core in our case influences strongly the characteristics of the ensuing shell carbon-burning. In the case of 25NM, our first convective carbon-burning shell is located deeper in the star as compared with LSC (see Table 6). The reason is that the presence of a convective core in our case leads to to the formation of a steep carbon gradient near to its edge, such that the high carbon abundances drives convection. Note that we have close agreement with LSC concerning the locations of the convective carbon-burning shell in the case of the 15 star where a convective core is found in both calculations.
Among our 25 models, it is most useful to compare 25K to the 25 model of WHW. This is because WHW include mass loss and because we have used the rate for 12C(,)16O for this sequence that is closest to the rate used by WHW (based on Buchmann’s compilation as mentioned above) in the temperature range of core helium burning (see Fig. 1).
The remarkable differences are: the lifetime of core H-burning and the mass of the He-core are larger in WHW’s sequence. The first indicates a certain degree of overshooting in the prescription of convection and the second is due to semiconvection being used in the region of the H-burning shell. In §3.1, we have described this issue and found close agreement between the calculations by WHW and our results for the sequence 25L. We recall that in this sequence the inhibiting effect of the -gradient on convection was taken into account in the region of H-burning shell.
We emphasize that the convective He-burning shell in our sequence 25L (see Fig. 8) has a similar location to that in the calculations of WHW for their 25 star. Compared to our sequence 25K, this zone is shifted by 0.8 outward. This is a consequence of the larger convective core during helium burning. We note that we still have a higher value of X(12C) at the end of core helium burning than obtained by WHW for similar reasons as explained in the case of the 15 above.
During the core C-burning, our calculations show that a convective core is formed with maximum mass that increases with increasing value of X(12C). There is no convective core formed in the calculations by WHW, and this explains the shorter lifetime of C-burning they have obtained as compared with ours. Whether a convective core is formed or not during core C-burning is crucially dependent on the balance between the nuclear energy generation rate and the neutrino loss rate. It is clear that the former is very sensitive to the value of X(12C) retained at the end of core He-burning. The manner in which core C-burning proceeds will of course determine how carbon-shell burning proceeds later. This explains the different locations and extension of the C-burning shell in our calculations. Indeed, if we go back to the 15 sequence in Table 5 and compare our results for the C-shell burning, we find reasonable agreement with others, because all the calculations presented in Table 5 have a convective core during core C-burning. The fact that the more massive star such as 25 which has higher values of temperature and density, and lower degeneracy than the 15 star make the effect of neutrino energy losses more pronounce. Therefore, the different prescription of the neutrino energy losses makes the carbon core evolution differences of the 25 models more evident.
The existence or absence of a convective core during core C-burning will also influence the properties of the Ne-burning phase. It is interesting that the oxygen-burning phase is more robust, such that a reasonable agreement is achieved among different calculations as seen in Table 5 and 6. This is likely due to the dominance of the nuclear energy production over the neutrino losses during the core O-burning phase.
Summing up this discussion, it is clear that the evolution of massive stars through the advanced burning phases (core C-burning and beyond) is quite sensitive to the earlier evolution. This, in turn, means that the nature of the burning in the models in the advanced phases depends strongly on the the effects of mass loss, on the treatment of convection in inhomogeneous stellar layers, and on the central carbon mass fraction retained at the end of core He-burning.
5 CONCLUSIONS
In this work, we have evolved models of stars of mass 15 - 30 through most of their burning phases. We have analyzed the effects of three important physical ingredients on the structures of the stellar models, viz., mass loss by stellar wind, the recently suggested rates for the 12C(,)16O reaction, and the treatment of convection in inhomogeneous stellar layers on the basis of the Ledoux criterion in contrast to the Schwarzschild criterion. We summarize the main results as follows:
-
•
Mass loss has a strong effect on stellar evolution through advanced phases. The larger the star is initially, the more mass loss will decrease the stellar mass. Then the star, having lower mass, will evolve at lower central temperatures and densities, such that less carbon would be destroyed by 12C(,)16O during core He burning. On the other hand, Figs. 3 and 15 show that mass loss increases strongly when the star reaches the red giant branch (RGB).
-
•
Our discussion of the sequence 25L in §3.1 has emphasized that mass loss depends sensitively on the behavior of the hydrogen-burning shell during core He-burning. When convection is inhibited in the hydrogen shell region by including the chocking effecdt of the -gradient, then the star evolves directly to the RGB, such that it looses more mass. The effect of this convection treatment was also that the helium burning shell and the hydrogen-burning shell migrate outward in mass and burn at relatively lower temperatures.
-
•
Our evolutionary sequences 25K, 25N, and 25NM indicate that the central mass fraction of carbon, X(12C) left after core helium burning determines the physical characteristics of the ensuing core carbon burning and shell carbon burning. The larger X(12C) is, the larger is the mass of the convective core during core carbon burning. The formation of such a core in our calculations leads to a steep gradient of carbon at the edge of the core such that shell carbon-burning occurs first in a convective zone located deeper in the star compared to other calculation in which no convective core is formed (see Table 6).
-
•
Core Ne-burning is also influenced by the characteristics of the preceding burning phases as described in §3.3.
-
•
Core oxygen burning is found to be less sensitive to the preceding burning phases, because the oxygen central mass fraction at the end of core neon-burning is always high. This leads to the dominance of the nuclear energy production over neutrino energy losses, such that a general agreement is found among different calculations (see Table 5 and 6)
From this work, we see the complex sensitivity of the structure and evolution of massive stars to mass loss, convection, and the O rate. An exact treatment of these three key ingredients to the models is not yet available; therefore, one must remain aware of their effects on stellar models. This becomes especially important when one considers the resulting nucleosynthesis, as we will do in subsequent work.
References
- Anders & Grevesse (1989) Anders, E. & Grevesse, N. 1989, Geochim. Cosmochim. Acta, 53, 197
- Angulo et al. (1999) Angulo, C., Arnould, M., Rayet, M., Descouvemont, P., Baye, D., Leclercq-Willain, C., Coc, A., Barhoumi, S., Aguer, P., Rolfs, C., Kunz, R., Hammer, J. W., Mayer, A., Paradellis, T., Kossionides, S., Chronidou, C., Spyrou, K., degl’Innocenti, S., Fiorentini, G., Ricci, B., Zavatarelli, S., Providencia, C., Wolters, H., Soares, J., Grama, C., Rahighi, J., Shotter, A., & Lamehi Rachti, M. 1999, Nuclear Physics A, 656, 3
- Arnett (1996) Arnett, D. 1996, Supernovae and nucleosynthesis. an investigation of the history of matter, from the Big Bang to the present (Princeton series in astrophysics, Princeton, NJ: Princeton University Press, —c1996)
- Arnett (1972) Arnett, W. D. 1972, ApJ, 176, 699
- Audi & Wapstra (1995) Audi, G. & Wapstra, A. H. 1995, Nuclear Physics A, 595, 409
- Beaudet et al. (1967) Beaudet, G., Petrosian, V., & Salpeter, E. E. 1967, ApJ, 150, 979
- Buchmann (1996) Buchmann, L. 1996, ApJ, 468, L127
- Caughlan & Fowler (1988) Caughlan, G. R. & Fowler, W. A. 1988, Atomic Data and Nuclear Data Tables, 40, 283
- Caughlan et al. (1985) Caughlan, G. R., Fowler, W. A., Harris, M. J., & Zimmerman, B. A. 1985, Atomic Data and Nuclear Data Tables, 32, 197
- Chieffi et al. (1998) Chieffi, A., Limongi, M., & Straniero, O. 1998, ApJ, 502, 737
- Chiosi & Maeder (1986) Chiosi, C. & Maeder, A. 1986, ARA&A, 24, 329
- de Jager et al. (1988) de Jager, C., Nieuwenhuijzen, H., & van der Hucht, K. A. 1988, A&AS, 72, 259
- Dicus et al. (1976) Dicus, D. A., Kolb, E. W., Schramm, D. N., & Tubbs, D. L. 1976, ApJ, 210, 481
- El Eid (1995) El Eid, M. F. 1995, MNRAS, 275, 983
- Imbriani et al. (2001) Imbriani, G., Limongi, M., Gialanella, L., Terrasi, F., Straniero, O., & Chieffi, A. 2001, ApJ, 558, 903
- Itoh et al. (1996) Itoh, N., Hayashi, H., Nishikawa, A., & Kohyama, Y. 1996, ApJS, 102, 411
- Kippenhahn & Weigert (1990) Kippenhahn, R. & Weigert, A. 1990, Stellar Structure and Evolution (Stellar Structure and Evolution, XVI, 468 pp. 192 figs.. Springer-Verlag Berlin Heidelberg New York. Also Astronomy and Astrophysics Library)
- Kunz et al. (2002) Kunz, R., Fey, M., Jaeger, M., Mayer, A., Hammer, J. W., Staudt, G., Harissopulos, S., & Paradellis, T. 2002, ApJ, 567, 643
- Langer et al. (1985) Langer, N., El Eid, M. F., & Fricke, K. J. 1985, A&A, 145, 179
- Langer et al. (1983) Langer, N., Fricke, K. J., & Sugimoto, D. 1983, A&A, 126, 207
- Limongi et al. (2000) Limongi, M., Straniero, O., & Chieffi, A. 2000, ApJS, 129, 625
- Munakata et al. (1985) Munakata, H., Kohyama, Y., & Itoh, N. 1985, ApJ, 296, 197
- Munakata et al. (1986) —. 1986, ApJ, 304, 580
- Nomoto & Hashimoto (1988) Nomoto, K. & Hashimoto, M. 1988, Phys. Rep., 163, 11
- Rauscher & Thielemann (2000) Rauscher, T. & Thielemann, F. 2000, Atomic Data and Nuclear Data Tables, 75, 1
- Richardson et al. (1982) Richardson, M. B., van Horn, H. M., Ratcliff, K. F., & Malone, R. C. 1982, ApJ, 255, 624
- Stothers & Chin (1992) Stothers, R. B. & Chin, C. 1992, ApJ, 390, 136
- The et al. (2000) The, L.-S., El Eid, M. F., & Meyer, B. S. 2000, ApJ, 533, 998
- Woosley et al. (2002) Woosley, S. E., Heger, A., & Weaver, T. A. 2002, Reviews of Modern Physics, 74, 1015
- Woosley et al. (1993) Woosley, S. E., Langer, N., & Weaver, T. A. 1993, ApJ, 411, 823
- Woosley & Weaver (1986) Woosley, S. E. & Weaver, T. A. 1986, ARA&A, 24, 205
| Star Mass (M☉) | Massloss | 12C(,)16O | 22Ne(,n)25Mg |
|---|---|---|---|
| 15 | yes | NACREa | NACRE |
| 20 | yes | NACRE | NACRE |
| 25K | yes | Kunzb | NACRE |
| 25Lc | yes | Kunz | NACRE |
| 25N | yes | NACRE | NACRE |
| 25NM | no | NACRE | NACRE |
| 30 | yes | NACRE | NACRE |
| 15 | 20 | 25N | 25NM | 25L | 30 | Initial Value | |
|---|---|---|---|---|---|---|---|
| 12C/13C | 18.2 | 17.8 | 15.6 | 28.9 | 17.49 | 7.94 | 90.0 |
| 18.4 | 16.4 | 8.63 | |||||
| 93 | 91 | 90 | |||||
| 14N/15N | 2489 | 3416 | 7140 | 3334 | 2469 | 20681 | 271 |
| 2132 | 2702 | 2977 | |||||
| 16O/17O | 930 | 1054 | 1022 | 1366 | 1309 | 699 | 2622 |
| 1231 | 1433 | 1159 | |||||
| 881 | 919 | 1052 | |||||
| 16O/18O | 686 | 705 | 846 | 691 | 614 | 1976 | 498 |
| 579 | 650 | 1227 | |||||
| 565 | 574 | 572 | |||||
| Na/Fe | 0.271 | 0.361 | 0.494 | 0.451 | 0.302 | 0.617 | 0 |
| Mbottom/M☉ | 3.8 | 5.8 | 7.6 | 7.8 | 8.7 | 9.9 | |
| 4.28 | 6.15 | 8.27 |
| stage | Mass | Evol. Time | log(L/L☉) | log(Teff) | T | M | M | M | M | |
|---|---|---|---|---|---|---|---|---|---|---|
| (M☉) | (yrs) | (K) | ( K) | (g cm-3) | (M☉) | (M☉) | (M☉) | (M☉) | ||
| 15 M☉ | ||||||||||
| 1 | 15.00 | 0.00 | 4.277 | 4.487 | 0.342 | 6.28100 | 0.00 | 0.00 | 0.00 | 5.66 |
| 2 | 14.77 | +1.04107 | 4.617 | 4.412 | 0.622 | 6.33101 | 2.22 | 0.00 | 0.00 | 0.00 |
| 3 | 14.76 | +3.40104 | 4.641 | 4.237 | 1.28 | 1.34103 | 2.61 | 0.00 | 0.00 | 2.22 |
| 4 | 13.90 | +1.66106 | 4.690 | 3.568 | 3.15 | 6.53103 | 3.85 | 1.82 | 0.00 | 0.00 |
| 5 | 13.84 | +2.96104 | 4.830 | 3.553 | 5.67 | 1.25105 | 3.85 | 2.06 | 0.00 | 0.55 |
| 6 | 13.82 | +6.76103 | 4.859 | 3.550 | 9.95 | 4.87106 | 3.85 | 2.18 | 0.44 | 0.00 |
| 7 | 13.82 | +8.63100 | 4.859 | 3.550 | 12.06 | 8.45106 | 3.85 | 2.19 | 0.88 | 0.70 |
| 8 | 13.82 | +3.13100 | 4.859 | 3.550 | 15.13 | 6.50106 | 3.85 | 2.19 | 2.01 | 0.00 |
| 9 | 13.82 | +9.8210-2 | 4.859 | 3.550 | 15.01 | 6.73106 | 3.85 | 2.19 | 2.01 | 0.00 |
| 10 | 13.82 | +3.71100 | 4.857 | 3.550 | 19.37 | 2.13107 | 3.85 | 2.19 | 2.01 | 0.77 |
| 20 M☉ | ||||||||||
| 1 | 20.00 | 0.00 | 4.625 | 4.539 | 0.359 | 4.87100 | 0.00 | 0.00 | 0.00 | 8.72 |
| 2 | 19.45 | +7.40106 | 4.965 | 4.447 | 0.729 | 5.71101 | 3.90 | 0.00 | 0.00 | 0.00 |
| 3 | 19.44 | +1.45104 | 4.991 | 4.291 | 1.35 | 6.59102 | 4.21 | 0.00 | 0.00 | 3.70 |
| 4 | 17.34 | +1.01106 | 5.017 | 3.557 | 3.46 | 5.40103 | 5.69 | 3.35 | 0.00 | 0.00 |
| 5 | 17.25 | +1.42104 | 5.111 | 3.547 | 5.80 | 4.83104 | 5.70 | 3.34 | 0.00 | 0.49 |
| 6 | 17.22 | +3.30103 | 5.135 | 3.544 | 10.830 | 2.77106 | 5.70 | 3.52 | 0.53 | 0.00 |
| 7 | 17.22 | +1.13101 | 5.134 | 3.544 | 12.168 | 6.01106 | 5.70 | 3.52 | 0.80 | 0.73 |
| 8 | 17.22 | +1.21100 | 5.134 | 3.544 | 16.263 | 4.16106 | 5.70 | 3.52 | 1.16 | 0.00 |
| 9 | 17.22 | +4.8810-3 | 5.134 | 3.544 | 16.218 | 4.23106 | 5.70 | 3.52 | 1.16 | 0.97 |
| 10 | 17.22 | +8.8610-1 | 5.134 | 3.544 | 24.022 | 1.10107 | 5.70 | 3.54 | 1.77 | 0.00 |
| 25 M☉ (25C) | ||||||||||
| 1 | 25.00 | 0.00 | 4.871 | 4.542 | 0.325 | 2.72100 | 0.00 | 0.00 | 0.00 | 12.6 |
| 2 | 23.94 | +6.01106 | 5.227 | 4.396 | 1.06 | 1.59102 | 5.88 | 0.00 | 0.00 | 0.00 |
| 3 | 23.94 | +4.60103 | 5.238 | 4.308 | 1.40 | 4.20102 | 6.00 | 0.00 | 0.00 | 5.35 |
| 4 | 18.49 | +7.47105 | 5.236 | 3.550 | 3.62 | 4.59103 | 7.57 | 4.66 | 0.00 | 0.00 |
| 5 | 18.47 | +9.70103 | 5.309 | 3.542 | 6.14 | 3.71104 | 7.58 | 4.86 | 0.00 | 0.42 |
| 6 | 18.30 | +1.54103 | 5.351 | 3.529 | 11.58 | 2.91106 | 7.58 | 5.04 | 0.59 | 0.00 |
| 7 | 18.30 | +5.2710-1 | 5.319 | 3.521 | 12.41 | 3.64106 | 7.58 | 5.04 | 0.59 | 0.72 |
| 8 | 18.30 | +5.8310-1 | 5.257 | 3.526 | 17.94 | 3.73106 | 7.58 | 5.08 | 1.53 | 0.00 |
| 9 | 18.30 | +9.5810-3 | 5.253 | 3.525 | 18.10 | 4.17106 | 7.58 | 5.08 | 1.53 | 1.08 |
| 10 | 18.30 | +1.8110-1 | 5.233 | 3.529 | 24.65 | 1.70107 | 7.58 | 5.12 | 1.80 | 0.00 |
| 25 M☉ (25K) | ||||||||||
| 1 | 25.00 | 0.00 | 4.876 | 4.575 | 0.371 | 4.06100 | 0.00 | 0.00 | 0.00 | 12.8 |
| 2 | 23.95 | +6.00106 | 5.223 | 4.397 | 1.06 | 1.61102 | 5.88 | 0.00 | 0.00 | 0.00 |
| 3 | 23.94 | +4.40103 | 5.237 | 4.311 | 1.39 | 4.12102 | 6.00 | 0.00 | 0.00 | 5.31 |
| 4 | 18.60 | +7.49105 | 5.231 | 3.550 | 3.62 | 4.62103 | 7.53 | 4.67 | 0.00 | 0.00 |
| 5 | 18.47 | +7.90103 | 5.280 | 3.545 | 5.51 | 2.19104 | 7.54 | 4.79 | 0.00 | 0.47 |
| 6 | 18.41 | +3.50103 | 5.322 | 3.540 | 10.98 | 2.03106 | 7.54 | 5.01 | 0.45 | 0.00 |
| 7 | 18.41 | +6.93100 | 5.329 | 3.541 | 11.90 | 4.10106 | 7.54 | 5.01 | 1.09 | 0.75 |
| 8 | 18.41 | +3.28100 | 5.337 | 3.538 | 16.66 | 4.09106 | 7.54 | 5.01 | 1.09 | 0.00 |
| 9 | 18.41 | +0.00100 | 5.337 | 3.538 | 16.64 | 4.16106 | 7.54 | 5.01 | 1.09 | 1.06 |
| 10 | 18.41 | +5.1010-1 | 5.319 | 3.529 | 22.75 | 1.72107 | 7.54 | 5.03 | 2.09 | 0.00 |
| 25 M☉ (25N) | ||||||||||
| 1 | 25.00 | 0.00 | 4.877 | 4.575 | 0.371 | 4.06100 | 0.00 | 0.00 | 0.00 | 12.8 |
| 2 | 23.94 | +5.96106 | 5.226 | 4.397 | 1.053 | 1.57102 | 5.88 | 0.00 | 0.00 | 0.00 |
| 3 | 23.94 | +4.30103 | 5.237 | 4.318 | 1.362 | 3.86102 | 6.00 | 0.00 | 0.00 | 5.32 |
| 4 | 18.67 | +7.54105 | 5.232 | 3.551 | 3.624 | 4.63103 | 7.51 | 4.65 | 0.00 | 0.00 |
| 5 | 18.52 | +9.60103 | 5.304 | 3.542 | 6.103 | 3.61104 | 7.54 | 4.85 | 0.00 | 0.36 |
| 6 | 18.49 | +1.60103 | 5.321 | 3.540 | 12.11 | 1.80106 | 7.54 | 5.02 | 0.36 | 0.00 |
| 7 | 18.49 | +1.2210-1 | 5.320 | 3.540 | 12.70 | 2.11106 | 7.54 | 5.02 | 0.59 | 0.61 |
| 8 | 18.49 | +2.9410-1 | 5.320 | 3.540 | 17.00 | 2.35106 | 7.53 | 5.03 | 1.46 | 0.00 |
| 9 | 18.49 | +9.1410-4 | 5.320 | 3.540 | 17.00 | 2.35106 | 7.53 | 5.03 | 1.46 | 0.95 |
| 10 | 18.49 | +3.3110-1 | 5.320 | 3.540 | 22.59 | 9.82106 | 7.53 | 5.05 | 1.96 | 0.00 |
| 25 M☉ (25NM) | ||||||||||
| 1 | 25.00 | 0.00 | 4.877 | 4.575 | 0.371 | 4.06100 | 0.00 | 0.00 | 0.00 | 12.8 |
| 2 | 25.00 | +5.93106 | 5.260 | 4.402 | 1.06 | 1.60102 | 6.07 | 0.00 | 0.00 | 0.00 |
| 3 | 25.00 | +4.30103 | 5.272 | 4.324 | 1.39 | 4.07102 | 6.20 | 0.00 | 0.00 | 5.20 |
| 4 | 25.00 | +7.90105 | 5.222 | 3.564 | 3.65 | 4.71103 | 7.62 | 4.79 | 0.00 | 0.00 |
| 5 | 25.00 | +1.01104 | 5.305 | 3.555 | 6.00 | 3.42104 | 7.63 | 4.86 | 0.00 | 0.23 |
| 6 | 25.00 | +1.86103 | 5.322 | 3.553 | 11.49 | 1.83106 | 7.63 | 4.92 | 0.49 | 0.00 |
| 7 | 25.00 | +1.02100 | 5.322 | 3.552 | 12.59 | 2.71106 | 7.63 | 4.92 | 0.70 | 0.64 |
| 8 | 25.00 | +3.4810-1 | 5.323 | 3.552 | 17.88 | 3.26106 | 7.63 | 4.92 | 1.59 | 0.00 |
| 9 | 25.00 | +4.1210-3 | 5.323 | 3.552 | 17.95 | 3.38106 | 7.63 | 4.92 | 1.59 | 1.19 |
| 10 | 25.00 | +1.6710-1 | 5.321 | 3.552 | 25.24 | 5.59106 | 7.63 | 4.95 | 2.35 | 0.00 |
| 25 M☉ (25L) | ||||||||||
| 1 | 25.00 | 0.00 | 4.873 | 4.572 | 0.371 | 4.06100 | 0.00 | 0.00 | 0.00 | 12.8 |
| 2 | 23.95 | +6.02106 | 5.166 | 4.453 | 0.79 | 5.28101 | 5.61 | 0.00 | 0.00 | 0.00 |
| 3 | 23.95 | +9.90103 | 5.167 | 4.222 | 1.40 | 4.60102 | 5.75 | 0.00 | 0.00 | 6.16 |
| 4 | 13.86 | +6.88105 | 5.336 | 3.522 | 3.56 | 3.94103 | 8.34 | 5.53 | 0.00 | 0.00 |
| 5 | 13.66 | +7.70103 | 5.382 | 3.522 | 5.99 | 2.66104 | 8.36 | 5.61 | 0.00 | 0.47 |
| 6 | 13.61 | +1.88103 | 5.382 | 3.522 | 11.18 | 1.94106 | 8.36 | 5.69 | 0.48 | 0.00 |
| 7 | 13.61 | +4.35100 | 5.382 | 3.522 | 12.05 | 3.63106 | 8.36 | 5.72 | 0.74 | 0.77 |
| 8 | 13.61 | +2.30100 | 5.382 | 3.522 | 17.25 | 3.65106 | 8.36 | 5.72 | 1.10 | 0.00 |
| 9 | 13.61 | +8.2410-3 | 5.382 | 3.522 | 17.27 | 3.72106 | 8.36 | 5.72 | 1.10 | 1.15 |
| 10 | 13.61 | +4.7210-1 | 5.382 | 3.522 | 22.95 | 1.82107 | 8.36 | 5.75 | 2.29 | 0.00 |
| 30 M☉ | ||||||||||
| 1 | 30.00 | 0.00 | 5.069 | 4.601 | 0.381 | 3.54100 | 0.00 | 0.00 | 0.00 | 16.10 |
| 2 | 28.25 | +5.09106 | 5.409 | 4.355 | 1.25 | 1.98102 | 7.90 | 0.00 | 0.00 | 0.00 |
| 3 | 28.25 | +1.80103 | 5.415 | 4.303 | 1.44 | 3.13102 | 7.98 | 0.00 | 0.00 | 7.17 |
| 4 | 17.07 | +6.29105 | 5.408 | 3.542 | 3.74 | 4.07103 | 9.49 | 6.38 | 0.00 | 0.00 |
| 5 | 16.84 | +7.00103 | 5.463 | 3.537 | 6.27 | 2.84104 | 9.54 | 6.50 | 0.00 | 0.39 |
| 6 | 15.24 | +1.01103 | 5.463 | 3.537 | 11.92 | 1.76106 | 9.54 | 6.72 | 0.67 | 0.00 |
| 7 | 15.24 | +7.1310-1 | 5.463 | 3.537 | 12.44 | 2.37106 | 9.54 | 6.75 | 0.80 | 0.67 |
| 8 | 15.24 | +3.3410-1 | 5.463 | 3.537 | 18.70 | 3.06106 | 9.54 | 6.75 | 1.69 | 0.00 |
| 9 | 15.24 | +4.5810-3 | 5.463 | 3.537 | 18.21 | 2.68106 | 9.54 | 6.75 | 1.78 | 1.20 |
| 10 | 15.24 | +1.0210-1 | 5.463 | 3.537 | 26.02 | 4.68106 | 9.54 | 6.89 | 2.80 | 0.00 |
| Mass | ||||||
|---|---|---|---|---|---|---|
| () | End Helium | End Helium | End Carbon | End Helium | End Carbon | End Neon |
| 15 | 0.285 | 0.0028 | 0.371 | 0.688 | 0.548 | 0.738 |
| 20 | 0.258 | 0.0041 | 0.349 | 0.713 | 0.579 | 0.758 |
| 25K | 0.280 | 0.0052 | 0.384 | 0.689 | 0.541 | 0.737 |
| 25L | 0.274 | 0.0054 | 0.379 | 0.695 | 0.549 | 0.740 |
| 25N | 0.236 | 0.0052 | 0.329 | 0.733 | 0.606 | 0.795 |
| 25NM | 0.193 | 0.0067 | 0.275 | 0.774 | 0.669 | 0.806 |
| 30 | 0.221 | 0.0070 | 0.316 | 0.745 | 0.624 | 0.786 |
| Physical Quantity | PWa | LSCb | WHWc |
|---|---|---|---|
| H-Burning | |||
| (106 yr) | 10.4 | 10.7 | 11.1 |
| Mcc (M☉) | 5.66 | 6.11 | 5.7 |
| M | 3.94 | 4.28 | 4.5 |
| M | 3.85 | 4.10 | 4.15 |
| He-Burning | |||
| (106 yr) | 1.66 | 1.40 | 1.97 |
| Mcc (M☉) | 2.22 | 2.33 | 2.60 |
| Mcore (M☉) | 2.27 | 2.39 | 2.80 |
| X(12C)/X(16O) | 0.285/0.688 | 0.195/0.777 | 0.216/- |
| M (He-shell) (M☉) | 2.3-3.1 | 2.43-3.54 | 2.8-4.2 |
| C-Burning | |||
| (103 yr) | 6.76 | 2.60 | 2.03 |
| Mcc (M☉) | 0.55 | 0.41 | 0.50 |
| Mcore (M☉) | 2.01 | 2.44 | 1.85 |
| M (C-shell) (M☉) | 0.50-1.21 | 0.39-0.80 | 0.59-1.20 |
| 0.99-1.76 | 0.80-1.18 | 1.20-2.30 | |
| 1.38-1.91 | 1.20-1.77 | 1.90-2.61 | |
| 1.56-1.67 | |||
| 1.64-2.18 | |||
| Ne-Burning | |||
| (yr) | 1.98 | 2.00 | 0.73 |
| Mcc (M☉) | 0.70 | 0.66 | 0.70 |
| X(16O)/X(24Mg) | 0.74/0.09 | 0.81/0.05 | – |
| O-Burning | |||
| (yr) | 3.71 | 2.47 | 2.58 |
| Mcc (M☉) | 0.77 | 0.94 | 0.80 |
| Physical Quantity | 25K | 25N | 25NM | LSC | 25L | WHW |
|---|---|---|---|---|---|---|
| H-Burning | ||||||
| (106 yr) | 6.00 | 6.00 | 5.93 | 5.93 | 6.02 | 6.70 |
| Mcc (M☉) | 12.8 | 12.8 | 12.8 | 12.8 | 12.8 | 12.5 |
| Mcore | 7.54 | 7.53 | 7.63 | 8.01 | 8.36 | 8.43 |
| M | 7.60 | 7.60 | 7.89 | 8.27 | 8.71 | 8.60 |
| He-Burning | ||||||
| (106 yr) | 0.749 | 0.754 | 0.79 | 0.68 | 0.688 | 0.839 |
| Mcc (M☉) | 5.31 | 5.32 | 5.20 | 5.23 | 6.16 | 6.50 |
| MC/O-core (M☉) | 5.03 | 5.05 | 4.95 | 4.90 | 6.09 | 6.45 |
| X(12C)/X(16O) | 0.28/0.69 | 0.24/0.73 | 0.19/0.77 | 0.18/0.79 | 0.27/0.70 | 0.19/- |
| M (He-shell) (M☉) | 5.30-6.30 | 5.30-6.30 | 5.25-7.35 | 5.30-7.68a | 6.28-8.07 | 6.5-8.1 |
| C-Burning | ||||||
| (yr) | 3500 | 1600 | 1860 | 970 | 1880 | 522 |
| Mcc (M☉) | 0.47 | 0.36 | 0.23 | radiative | 0.47 | radiative |
| M (M☉) | 2.50 | 1.96 | 2.63 | 2.40 | 2.61 | 2.45 |
| M (C-shell) (M☉) | 0.50-1.19 | 0.38-0.97 | 0.865-1.16 | 1.48-2.43 | 0.52-1.30 | 1.60-5.60 |
| 1.30-4.54 | 1.04-2.19 | 1.21 - 3.12 | 2.28-4.61 | 1.33-5.15 | 3.20-5.70 | |
| 2.26-4.94 | 2.76 - 3.50 | |||||
| Ne-Burning | ||||||
| (yr) | 3.28 | 0.294 | 0.348 | 0.77 | 4.35 | 0.89 |
| Mcc (M☉) | 0.75 | 0.61 | 0.64 | 0.50 | 0.77 | 1.0 |
| Mcore (M☉) | 1.80 | 1.96 | 2.16 | 2.29 | 2.05 | 2.20 |
| X(16O)/X(24Mg) | 0.74/0.10 | 0.80/0.09 | 0.81/0.07 | 0.83/0.05 | 0.74/0.10 | - |
| O-Burning | ||||||
| (yr) | 0.510 | 0.33 | 0.547 | 0.33 | 0.47 | 0.40 |
| Mcc (M☉) | 1.06 | 0.95 | 1.19 | 1.15 | 1.15 | 1.25 |