A new Classical T Tauri object at the sub-stellar boundary in Chamaeleon II
Abstract
We have obtained low- and medium-resolution optical spectra of 20 candidate young low-mass stars and brown dwarfs in the nearby Chamaeleon II dark cloud, using the Magellan Baade telescope. We analyze these data in conjunction with near-infrared photometry from the 2-Micron All Sky Survey. We find that one target, [VCE2001] C41, exhibits broad H emission as well as a variety of forbidden emission lines. These signatures are usually associated with accretion and outflow in young stars and brown dwarfs. Our spectra of C41 also reveal Li I in absorption and allow us to derive a spectral type of M5.5 for it. Therefore, we propose that C41 is a classical T Tauri object near the sub-stellar boundary. Thirteen other targets in our sample have continuum spectra without intrinsic absorption or emission features, and are difficult to characterize. They may be background giants or foreground field stars not associated with the cloud or embedded protostars, and need further investigation. The six remaining candidates, with moderate reddening, are likely to be older field dwarfs, given their spectral types, lack of lithium and H.
1 Introduction
The southern star-forming region in Chamaeleon consists of three major dark clouds –designated Cha I, Cha II and Cha III– and a handful of smaller structures (Schwartz 1977; Boulanger et al. 1998). Given its relative proximity (160–180 pc; Whittet et al. 1997), youth (1 Myr) and intermediate galactic latitude (), this cloud complex is well suited for investigations of low-mass stellar and sub-stellar populations. Cha I has been the focus of a variety of studies (Luhman 2004 and references therein) whereas Cha II and Cha III remain relatively unexplored.
The interest in Cha II, in particular, is likely to grow in the near future because it will be surveyed during the course of a Spitzer Legacy program (Evans et al. 2003). Schwartz (1977) and Hartigan (1993) identified a number of pre-main-sequence stars with H emission in this region. Near-infrared and InfraRed Astronomy Satellite (IRAS) data confirmed these sources likely harbor circumstellar material (Whittet et al. 1991; Prusti et al. 1992; Larson et al. 1998). A Class I protostar, IRAS 12553-7651, with a probable molecular outflow and near-infrared nebulosity, has been found close to the cloud center (Olmi et al. 1997; Persi et al. 2003). A recent Infrared Space Observatory (ISO) study revealed four new candidate young stellar objects, including a very low luminosity ( 0.01 ) source with a mid-infrared excess (Persi et al. 2003). Alcalá et al. (2000) detected 40 X-ray sources in Cha II in a ROSAT pointed observation; only 14 of these sources coincided with previously known young stellar objects. These authors suggest that Cha II contains fewer weak-line T Tauri stars than classical T Tauri stars, compared to Cha I, and thus may be in an earlier evolutionary stage than the latter.
Using data from the DEep Near Infrared Survey of the southern sky (DENIS; Epchtein et al. 1997), Vuong, Cambrésy & Epchtein (2001, hereafter VCE2001) identified 51 candidate low-mass stars and brown dwarfs in Cha II. Comparison with theoretical evolutionary tracks suggest that their photometrically-selected candidates have masses 0.2 and ages 1–10 Myr. However, the true nature of these candidates can only be determined through spectroscopy. Here we present optical spectra of 20 of the DENIS candidates, and use these data to derive their spectral types and to evaluate their evolutionary status and cluster membership.
2 Observations
We obtained spectra of 20 Cha II targets at low-resolution (2003 March 9) and four of them also at medium-resolution (2003 March 10 and 11) with the Boller & Chivens (B&C) optical spectrograph on the Magellan Baade 6.5-meter telescope. The spectral resolutions were R=620 and R=2600, as measured in the comparison arc lamps, using the 300 l/mm and 1200 l/mm gratings. The spectral coverages were 5200–9600 Å and 6200–7800 Å respectively. The data were reduced using standard techniques within IRAF111IRAF is distributed by National Optical Astronomy Observatories, which is operated by the Association of Universities for Research in Astronomy, Inc., under contract to the National Science Foundation, USA.
In the case of the low resolution spectra, typical exposure times were of the order of 300 seconds. For the fainter objects, we collected several exposures of this exposure time and co-added them after the reduction process. For the medium resolution spectra, we collected 3–4 exposures of 900 seconds each.
On the same observing run, we observed a large number of late K and M stars of III, IV and V luminosity classes, and several spectrophotometric standard stars. These spectra were used to calibrate the data and to derive spectral types. During this run, we also observed members of other young clusters and stellar associations, such as TW Hya association, IC2391 cluster and Orionis cluster. Further details can be found in Mohanty, Jayawardhana & Barrado y Navascués (2003); Barrado y Navascués, Mohanty & Jayawardhana (2004); Barrado y Navascués et al. (2004); and Barrado y Navascués, Stauffer & Jayawardhana (2004).
In addition, we have compiled near-infrared data – photometry– from the 2MASS All Sky Survey (Cutri et al. 2003). These values are listed, together with previous optical-infrared data –– from DENIS, in Table 1.
3 Results and Discussion
We use these data to re-estimate the reddening values, derive spectral types for the sample objects and evaluate their nature and possible membership in Cha II. Figure 1 shows the distribution of these targets on the sky against a contour plot of 100 m emission from IRAS, as well as the distribution of X-ray sources and Cha II members of IR classes I, II and III (after Alcalá et al. 2000).
3.1 Color-Magnitude and Color-Color Diagrams: Reddening
Figures 2, 3 and 4 display color-magnitude and color-color diagrams (CMD and CCD), respectively, for the sample analyzed in this paper. The first set of diagrams (Figure 2) suggests that the VCE2001 study contains a large number of young substellar objects. However, it is clear that there are significant differences in reddening (Figure 3 and 4). VCE2001, in their discovery paper, presented a reddening map and derived, based on it, the individual reddening for each object. These values are listed in Table 1. On the other hand, the IRAS contours plotted in Figure 1 clearly show that there is differential reddening, both for those objects within the Cha II cloud and for background objects located behind it.
Figure 4 displays the detail for the () versus () diagram –based on 2MASS data. We show a comparison between other Cha II members of different IR class and the VCE2001 sample in panel (a), whereas panel (b) contains the sample of X-ray emitters (data from Alcalá et al. 2000). Note that most Class II objects (in accreting phase, Lada & Wilking 1984; Shu et al. 1987) are located over the CTT locus. Only one Class I object appears in the 2MASS database, and it is located in the same position as VCE2001 candidate members with large reddening values. We have been able to identify only few X-ray sources from Alcalá et al. (2000) in 2MASS, and they are located moderately close to the main sequence. The two diagrams suggest that these populations are different (i.e., the VCE2001 sample may contain a large number of spurious members).
We show the subsample of the objects with continuum spectra (see next section) in Figure 4c and 4d. This subsample is characterized by large reddening towards each of the objects. In panel 4c, we display the location of this subsample and the reddening vector based on the VCE2001 data (i.e, the location of the arrow tip indicates the color of each object after reportedly been corrected for interstellar reddening). As visual inspection indicates, the dereddened objects follow neither the main sequence nor the classical T Tauri locus. We have procceded to derive again the reddening vector by forcing each object to lie on the main sequence (or on the point closest to it). Figure 4d shows the subsample with the new reddening vectors. These values are also included in Table 1. The comparison of the interstellar absorption derived by VCE2001 and by us indicates that there are important differences.
3.2 Spectral types and membership
3.2.1 Subsample with large reddening
Figure 5a shows the spectra of the subsample with large reddening. All of them are continuum spectra, and only contain telluric features. The spectral slope of these objects, after correction of the intrumental response but prior to dereddening, is similar to the slope of mid-M spectral type. However, if we apply the extinction derived by VCE2001, the slope is closer to early M for most of them. Finally, if we apply our own, newly derived reddening, they are closer to K7-M0.
These 13 featureless objects are difficult to characterize. Featureless spectra in the optical are characteristic of embedded objects or classical T Tauri stars with very strong veiling, in which the contribution from circumstellar dust is larger than the photospheric emission from the central object (Lada & Wilking 1984; Adams et al. 1987; Bertout et al. 1988; Bertout 1989; Appenzeller & Mundt 1989). From Figure 1, it appears that these 13 sources are associated with the denser parts of the Chamaeleon II cloud. This might suggest that they are embedded stellar and sub-stellar objects, still in their Class I phase. At least one confirmed Class I protostar, IRAS 12553-7651, with a probable molecular outflow and near-infrared nebulosity had been previously identified close to the center of Cha II (Olmi et al. 1997; Persi et al. 2003). However, other optically visible Class I objects, such as Sz102 in Lupus (Comerón et al. 2003) and some Taurus members (Kenyon et al. 1998), show intense H emission and forbidden lines. This is not the case for the 13 continuum sources in our sample. Therefore, until further evidence is collected –near-infrared spectroscopy or mid-infrared photometry– it may be safer to assume that these objects are probable background, red giants, not associated with the Cha II cloud. Note that Luhman (2004), in his study of Cha I, has found that up to 50% of the candidate members can be foreground field stars and background giants. In addition, Figure 1 shows that the distribution of Cha II members (Class I, II and III objects, together with X-ray sources from Alcalá et al. 2000) is different from that for VCE2001 candidates. In the first case, they are aligned with the bar of dense material, with a SE-NW orientation, whereas the other two groups, composed of probable members of the star forming region, are concentrated North-East of this area.
3.2.2 Subsample with small reddening
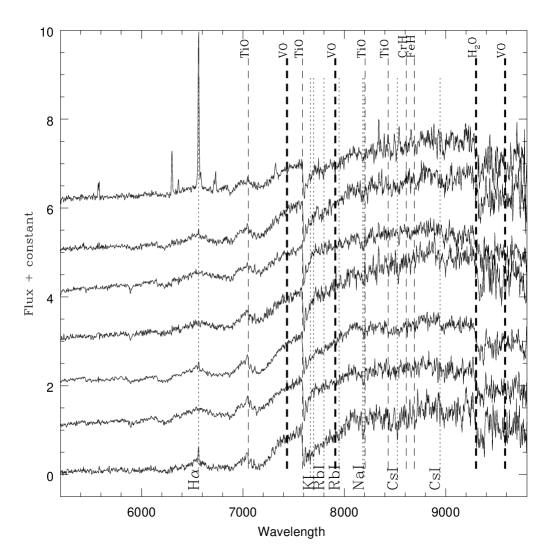
For the other seven objects in our sample, which have moderate reddening, we derived spectral types by direct comparison with a large sample of template stars. Estimated uncertainty is about half a sub-class. Figure 6 shows the low-resolution spectra. Panel (a) consists of those seven candidate members, after instrumental response correction but without taking the reddening into account. Panel (b) displays the spectra after we have applied the reddening corrections, whose values were obtained in a manner similar to that described in section 3.1 and illustrated in Figure 4b. Our derived spectral types are listed in Table 1.
Figure 7 shows medium-resolution spectra of four targets with moderate reddening. Again, we have derived their spectral type and luminosity class in comparison to template spectra. Comparison of the gravity sensitive K I doublet at 7700 Å is shown in Figure 8. Three –namely [VCE2001] C01, C03, and C15– out of the four exhibit strong potassium absorption and are likely foreground dwarfs. The non-detection of Li I6708 Å in [VCE2001] C01 and C03 also suggests that these are probably older field stars (Figure 9). Lithium depletion is not so clear in the case of [VCE2001] C15 due to poorer S/N in its spectrum. The fourth target observed at medium-resolution, [VCE2001] C41 (hereafter C41), clearly exhibits Li absorption as well as a variety of prominent emission lines including H, He I 6678 Å, [O] I, [N] II, and [S] II, and is likely a classical T Tauri cloud member (see section 3.3).
Three other candidates with low reddening, for which we only have low-resolution spectra –[VCE2001] C02, C06, and C07– do not show H in emission. Therefore, they seem to be old, field M dwarfs and can be classified as probable non-members. These three, as well as two of the three other likely non-members with medium-resolution spectra, appear to be located well outside the peaks in the IRAS 100m map (Figure 1).
In summary, of the 20 targets we observed, six are likely field M dwarfs (though we are less certain that [VCE2001] C15 is a non-member since lithium depletion is not clearly seen), one is a classical T Tauri star and the other 13 with continuum spectra are probably heavily reddened background giants, seen through the cloud.
3.3 [VCE2001] C41: accretion and outflow near the sub-stellar boundary
Figure 10 shows the medium- and low-resolution spectra of [VCE2001] C41 while Table 2 lists the equivalent widths of various lines seen at medium-resolution. The detection of Li I in absorption implies a young object. Assuming it is a member of the Cha II group, the M5.5 spectral type we derive places [VCE2001] C41 at or near the sub-stellar boundary at an age of a few million years. The H emission line is broad, with a full width at half-maximum and at 10% of maximum intensity–as measured in the medium-resolution spectrum– of 285 and 500 km/s, respectively (in any case, much broader than the spectral resolution of 120 km/s, FWHM). We also detect a prominent emission line of He I (6678 Å) and the Ca II infrared triplet. These signatures are characteristic of classical T Tauri stars and young brown dwarfs undergoing accretion (e.g., Jayawardhana, Mohanty & Basri 2002, 2003; Barrado y Navascués & Martín 2003). Furthermore, [VCE2001] C41 exhibits significant excess in the near-infrared (Figures 7 and 8), consistent with a dusty circum-(sub)stellar disk (e.g., Jayawardhana et al. 2003; Barrado y Navascués et al. 2003).
The forbidden lines seen in [VCE2001] C41 –[O] I, [O] II, [N] II, [S] II– are commonly observed in Harbig-Haro objects, Class I sources and some T Tauri stars and may arise in a jet or outflow (Kenyon et al. 1998, Jayawardhana et al. 2002). Recently such forbidden line emission has been found in two other young objects (LS-RCrA 1 and Par-Lup3 4) near the sub-stellar boundary in the R Coronae Australis and Lupus 3 star forming regions (Fernández and Comerón 2001; Comerón et al. 2003; Barrado y Navascués, Mohanty & Jayawardhana 2004). We note that [VCE2001] C41 is 14.4 arcsec (about 2450 AU) North-West of IRAS 12554-7635, a Class II source, and the two may be related.
Taken together, the spectroscopic and photometric evidence makes a compelling case that [VCE2001] C41 is a young object near the sub-stellar limit undergoing accretion as well as mass loss. This result is consistent with the recent finding that very low mass young objects, including brown dwarfs, go through a T Tauri phase similar to their higher-mass counterparts (e.g., Jayawardhana, Mohanty & Basri 2002, 2003; Jayawardhana et al. 2003; Barrado y Navascués et al. 2003; Barrado y Navascués & Martín 2003; Barrado y Navascués, Mohanty & Jayawardhana 2004; Barrado y Navascués 2004). So far, it appears that brown dwarf disks may persist for timescales comparable to those of low-mass stars (Jayawardhana et al. 1999; Mohanty, Jayawardhana & Barrado y Navascués 2003). Thus, the presence of an accreting disk around [VCE2001] C41 only constraints its age to 10 Myr while the signatures of a jet suggest it may be closer to 1 Myr. Based on the X-ray detection rates, Alcalá et al. (2000) suggest that weak-line T Tauri stars are less numerous than classical T Tauri stars in Cha II, contrary to the situation in Cha I and several other star-forming regions. This result, the authors point out, could be due to Cha II harboring a younger population.
4 Concluding Remarks
We have found a classical T Tauri object near the sub-stellar boundary, with signatures of disk accretion and outflow, associated with the Cha II dark cloud. Thirteen targets in our sample have continuum spectra, and may be either unrelated background giants or embedded protostars. Six other targets are likely field M dwarfs. Further infrared studies –ground-based near-infrared spectroscopy and Spitzer observations in the mid- and far-infrared– are needed to investigate the nature of the embedded stellar and sub-stellar population in Cha II. More sensitive X-ray observations could reveal additional weak-line T Tauri stars missing from the current samples.
References
- (1) Adams F.C., Lada C.J., Shu F.H., 1987, ApJ 312, 788
- (2) Alcalá J.M., Covino E., Sterzik M.F., Schmitt J.H.M.M., Krautter J., Neuhauser, R. 2000, A&A 355, 629
- (3) Appenzeller I., Mundt R., 1989, A&A Rev. 1, 291
- (4) Baraffe, I., Chabrier, G., Allard, F., Hauschildt P. H., 1998, A&A, 337, 403
- (5) Barrado y Navascués, D., Béjar V., Mundt R., Martín, E.L., Rebolo R., Zapatero Osorio M.R., Bailer-Jones C.A.L., 2003, A&A 404, 171
- (6) Barrado y Navascués, D., Martín, E.L., 2003, AJ 126, 2997
- (7) Barrado y Navascués D, Mohanty S. & Jayawardhana R. 2004, ApJ 604, 284
- (8) Barrado y Navascués D., 2004, A&A 422, 631
- (9) Barrado y Navascués D., Stauffer J.R., Bouvier J., Jayawardhana R., Cuillandre J.-C., 2004, ApJ, in press (astro-ph/0404072)
- (10) Barrado y Navascués D., Stauffer J.R., & Jayawardhana R., 2004, ApJ, in press (astro-ph/0406436)
- (11) Bertout C., Basri G., Bouvier J., 1988, ApJ 330, 350
- (12) Bertout C., 1989, Ann. Rev. Astron. Astroph. 27, 351
- (13) Boulanger F., Bronfman L., Dame T.M., Thaddeus P., 1998, A&A 332, 273
- (14) Comerón, F., Fernández, M., Baraffe I., Neuhauser R., Kaas A.A., 2003, A&A 406, 1001
- Cutri et al. (2003) Cutri, R.M., et al. 2003, “2MASS All-Sky Catalog of Point Sources”, University of Massachusetts and Infrared Processing and Analysis Center, (IPAC/California Institute of Technology).
- (16) Epchtein N. et al. 1997, The Messenger 87, 27
- (17) Evans N.J., et al. 2003, PASP 115, 965
- fernandez (2001) Fernández, M., Comerón, F., 2001, A&A 380, 264
- (19) Hartigan P., 1993, AJ 105, 1511
- (20) Jayawardhana R., Hartmann L., Fazio G., Fisher R.S., Telesco C.M., Piña R.K., 1999, ApJ, 521, L129
- (21) Jayawardhana, R., Mohanty, S., Basri, G., 2002, ApJ, 578, L141
- (22) Jayawardhana, R., Luhman, K.L., D’Alessio, P., & Stauffer, J. 2002, ApJ, 571, L51
- (23) Jayawardhana, R., Mohanty, S., Basri, G., 2003, ApJ 592, 282
- (24) Jayawardhana, R., Ardila, D.R., Stelzer, B., Haisch, K.E., 2003, AJ 126, 1515
- (25) Kenyon S.J., Brown D.I., Tout C.A., Berlind P., 1998, AJ 115, 2491
- (26) Lada C.J., Wilking B.A., 1984, ApJ 287, 610
- (27) Larson K.A., Whittet D.C.B., Prusti T., Chiar J.E., 1998, A&A 337, 465
- (28) Luhman K.L. 2004, ApJ 602, 816
- (29) Mohanty, S., Jayawardhana, R., Barrado y Navascués, D., 2003, ApJ, 593, L109
- (30) Olmi L., Felli M., Cesaroni R., 1997, A&A 326, 373
- (31) Persi P., Marenzi A.R., Gómez M., Olofsson G., 2003, A&A 399, 995
- (32) Prusti T., Whittet D.C.B., Assendorp R., Wesselius P. R. 1992, A&A 260, 151
- (33) Schwartz R.D., 1977, ApJS, 35, 161
- (34) Shu F.H., Adams F.C., Lizano S., 1987, ARA&A 25, 23
- (35) Vuong M.H., Cambrésy L. & Epchtein N., 2001, A&A 379, 208
- (36) Whittet D.C.B., Assendorp R., Prusti T., Wesselius P.R., Roth M. 1991, A&A 251, 524
- (37) Whittet D.C.B. Prusti T., Franco G.A.P., Gerakines P.A., Kilkenny D., Larson K.A., Wesselius P.R., 1997, A&A 327, 1194
| [VCE2001] | I | J | Ks | Av | J | H | Ks | Av | Sp.Type1 | |
|---|---|---|---|---|---|---|---|---|---|---|
| Vuong et al. (2001) | 2MASS | |||||||||
| C14 | 17.81 0.17 | 14.90 0.14 | 13.19 0.18 | 2.1 | 14.947 0.037 | 13.671 0.031 | 13.190 0.038 | 5.0 | C | |
| C20 | 16.86 0.11 | 14.26 0.11 | 12.65 0.14 | 2.7 | 14.387 0.032 | 13.216 0.025 | 12.701 0.027 | 4.8 | C | |
| C21 | 17.99 0.18 | 14.90 0.14 | 13.28 0.19 | 2.8 | 15.107 0.046 | 13.834 0.027 | 13.227 0.034 | 5.9 | C | |
| C22 | 16.37 0.09 | 13.87 0.10 | 12.40 0.11 | 2.5 | 14.028 0.028 | 12.903 0.025 | 12.552 0.030 | 3.3 | C | |
| C26 | 16.80 0.10 | 14.23 0.11 | 12.74 0.14 | 2.6 | 14.331 0.030 | 13.343 0.029 | 12.819 0.030 | 3.5 | C | |
| C28 | 16.04 0.07 | 13.44 0.08 | 11.74 0.09 | 2.6 | 13.546 0.028 | 12.288 0.023 | 11.789 0.021 | 5.2 | C | |
| C30 | 15.45 0.06 | 12.27 0.07 | 10.14 0.07 | 2.7 | 12.251 0.023 | 10.755 0.024 | 10.208 0.021 | 6.5 | C | |
| C31 | 15.18 0.05 | 12.11 0.07 | 10.13 0.07 | 2.7 | 12.109 0.023 | 10.672 0.022 | 10.144 0.019 | 6.1 | C | |
| C38 | 15.96 0.07 | 13.07 0.08 | 11.13 0.08 | 2.3 | 13.105 0.023 | 11.736 0.025 | 11.217 0.023 | 6.0 | C | |
| C52 | 17.34 0.14 | 13.98 0.10 | 11.71 0.10 | 2.8 | 14.091 0.028 | 12.402 0.025 | 11.733 0.023 | 8.5 | C | |
| C54 | 17.10 0.11 | 14.75 0.12 | 13.03 0.17 | 1.8 | 14.842 0.043 | 13.908 0.042 | 13.437 0.045 | 3.0 | C | |
| C69 | 17.62 0.18 | 14.75 0.12 | 12.81 0.15 | 0.8 | 15.022 0.053 | 13.386 0.033 | 12.862 0.036 | 7.0 | C | |
| C70 | 17.81 0.20 | 15.04 0.14 | 13.29 0.19 | 0.7 | 15.129 0.056 | 14.056 0.039 | 13.493 0.050 | 4.3 | C | |
1 “C” stands for continuum or featureless spectrum.
IRAS 12510-7631, SIMBAD database.
| [VCE2001] | I | J | Ks | Av | J | H | Ks | Av | Sp.Type | |
|---|---|---|---|---|---|---|---|---|---|---|
| Vuong et al. (2001) | 2MASS | |||||||||
| C01 | 16.97 0.12 | 14.67 0.12 | 13.41 0.19 | 0.7 | 14.777 0.040 | 14.019 0.047 | 13.759 0.059 | 0.8 | M5.0V1 | |
| C02 | 17.77 0.44 | 14.75 0.13 | 13.43 0.17 | 1.1 | 14.638 0.038 | 13.891 0.042 | 13.587 0.044 | 1.0 | M4.5 | |
| C03 | 16.49 0.16 | 14.34 0.11 | 13.31 0.17 | 0.7 | 14.405 0.035 | 13.694 0.032 | 13.426 0.035 | 0.6 | M4.5V1 | |
| C06 | 17.32 0.12 | 14.70 0.12 | 12.98 0.14 | 1.0 | 14.652 0.038 | 13.611 0.028 | 13.174 0.035 | 3.5 | M5.52 | |
| C07 | 17.26 0.03 | 15.14 0.04 | 13.42 0.08 | 0.2 | 15.264 0.053 | 14.301 0.049 | 13.989 0.062 | 2.5 | M4.53 | |
| C15 | 16.88 0.10 | 14.41 0.12 | 12.96 0.16 | 1.9 | 14.403 0.035 | 13.476 0.031 | 13.087 0.039 | 2.5 | M5.5V1,4 | |
| C41 | 16.82 0.10 | 14.04 0.10 | 11.19 0.09 | 0.1 | 14.446 0.051 | 12.566 –5 | 11.364 –5 | –6 | M5.51 | |
1 Observed also with the 1200 l/mm grating.
2 M4.5 and M3.5 after derredening the spectra using the VCE2001 and our new value of the reddening.
3 M4 and M2 after derredening the spectra using the VCE2001 and our new value of the reddening.
4 M4.4 and M3.5 after derredening the spectra using the VCE2001 and our new value of the reddening.
5 No error in the 2MASS database.
6 Veiling.
Associated to IRAS 12554-7635?
| Line | March 10 | March 11 |
|---|---|---|
| (Å) | (Å) | |
| [O] I 5577.35 | 17.3 | – |
| [O] I 6300.331 | 32.4 | 30.8 |
| [O] I 6363.79 | 7.7 | 7.3 |
| [N] II 6548 | – | 3.7 |
| H 6562.8 | 84.01 | 108.5 |
| [N] II 6581 | 6.6 | 10.5 |
| He I 6678.15 | – | 1.02 |
| Li I 6707.8 | – | 0.4 |
| [S] II 6717.0 | 6.3 | 5.9 |
| [S] II 6731.3 | 9.1 | 11.6 |
| [O] II 7319 | 4.73 | 4.5 |
| [O] II 7329 | 4.73 | 3.8 |
| Ca II 8498.0 | 2.3 | – |
| Ca II 8542.1 | 3.5 | – |
| Ca II 8662.1 | 2.5 | – |
1 H blended with [N] II 6548.
2 Lithium in absorption.
3 [O] II 7319 & 7329 blended together.