33institutetext: Max-Plank-Institut für Kernphysik, Postfach 103980, D-69026 Heidelberg, Germany
Spectral properties of nonthermal X-ray emission from the shell-type SNR RX J1713.7–3946 as revealed by XMM-Newton
We present the results of our morphological and spectral study of properties of the supernova remnant RX J1713.73946 based on data obtained with XMM-Newton. Highly inhomogeneous structures, such as the bright spots, filaments and dark voids, noted by Uchiyama et al. (2003), appear in the entire bright western portion of the shell. In addition two narrow rims are found which run parallel to each other from north to south in the western part of the remnant. No complex structures are seen in the interior region of the remnant. The X-ray spectra everywhere can be well represented with a power-law function of photon index ranging within 2.0–2.8. A clear difference of spectra between the central dim region and the bright western portion is seen at lower energies. This differences can be ascribed either to an additional thermal component with electron temperature, from the center or, alternatively, to an increase in column density of in the western region. In the context of the recent discovery by the NANTEN telescope of a molecular cloud apparently interacting with the western part of the supernova remnant, the second possibility seems to be the more likely scenario.
Key Words.:
radiation mechanisms: non-thermal – ISM:supernova remnants – ISM:cosmic rays –stars suparnovae:individual:RX J1713.7–39461 Introduction
The supernova remnant (SNR) RX J1713.7–3946 (also known as G 347.3–0.5) was discovered during the ROSAT All-Sky survey (Pfeffermann & Aschenbach 1996). It is the bright source of nonthermal radiation in X-ray bands among the shell-type SNRs.
The ASCA observations of Koyama et al. (1997) showed that the X-ray spectrum in the northwestern (NW) rim is featureless and can be modeled by a single power-law function with interstellar absorption. Subsequent ASCA observations, which covered the overall remnant with a diameter of , showed that other portions of the remnant also have a featureless spectral shape with a complete lack of signatures of thermal X-ray emission (Slane et al. 1999).
Based on Chandra observations, Uchiyama et al. (2003) resolved the bright X-ray region in the NW rim into fine structures–a complex network of nonthermal X-ray filaments and spots. They showed that the energy spectra of different parts can be represented by a power-law with photon index which varies from site to site from 2.1–2.5, but does not correlate with the brightness distribution. Another important result of their study was the conclusion that the synchrotron cutoff energy is unusually high, namely it is beyond 10 keV.
The CANGAROO collaboration reported detection of TeV -rays from the direction of the NW rim of RX J1713.7–3946 (Muraishi et al. 2000). Later, Enomoto et al. (2002) published results of follow up observations by the CANGAROO 10 m telescope. They argue that the obtained spectrum should be explained by decay -rays rather than by Compton-upscattered -rays.
One of the important parameters for the interpretation of observations is the distance to the source. Originally Koyama et al. (1997) adopted a distance to this SNR of 1 kpc based on the estimation of the column density derived from the spectral analysis of the ASCA data. Later, Slane et al. (1999) argued that the source should be located much further. It has been suggested that there exist possible associations between the SNR RX J1713.7–3946 and adjacent molecular clouds (Slane et al. 1999). Among these clouds, the so-called cloud A has an enhanced value of CO (=2–1)/(=1–0) which could indicate the physical interaction with the SNR shock (Slane et al. 1999; Butt et al. 2001). Thus, based on the kinematic distance to the cloud A, they assumed 6k̇pc as the distance to the RX J1713.73946. This estimate was used in most of the following studies of the physical properties of RX J1713.73946 (e.g. Pannuti et al. 2003, Cassam-Chenaï et al. 2004 and Lazendic et al. 2004).
Recently, Fukui et al. (2003) have performed a new CO observation at 2.6 mm wavelength with the NANTEN telescope located at Las Campanas Observatory in Chile. They discovered a cloud at a distance of 1 kpc which surround SNR RX J1713.7–3946. It shows a good spatial correlation between the X-ray and the CO emission, together with the presence of a broad CO line down to a few arcminutes. These data favor a physical association with RX J1713.7–3946 rather than with the cloud at 6 kpc.
In this paper, we report on the X-ray study of the bright rims and interior regions of the SNR RX J1713.7–3946 by using archival data from the XMM-Newton satellite (P.I. A. Decourchelle). These observations revealed the presence of a double-shell structure along the western limb of the remnant, with enhanced absorption along this edge (Cassam-Chenaï et al. 2004). This effect naturally can be attributed to nearby (passive or interacting with the shell) molecular clouds. Remarkably such a cloud has been indeed found by Fukui et al. (2003) using CO observations. It should be noted the XMM-Newton composite image presented in Fig. 2 and Fig. 3 by Fukui et al. (2003) was quite similar to the image presented by Cassa-Chenaï et al. (2004) with a clear indicaton of a double-shell structure. However the main issue discussed in the paper by Fukui et al. (2003) was the correlation of the X-ray and CO peaks on arcmin scales.
The aim of the present paper is to extend our study of the distinct spatial and spectral features found by Uchiyama et al. (2003) based on the Chandra observations of the NW rim to the whole remnant.
The large field-of-view (FOV) of XMM-Newton is a great help to understand the nonthermal X-ray features and their three-dimensional structures. Spatio-spectral analysis enables us to examine different possible scenarios to investigate the spectral differences which may arise due to, e.g. variation of the column density. Comparison between the XMM-Newton image and the NANTEN CO map in Fukui et al. (2003) gives a constraint on the origin of synchrotron X-ray emission in the context of the X-ray and CO correlation. Here, we describe the XMM-Newton observations in §2, and present the results of our analysis in §3. Finally, in §4, we briefly discuss the implications of the results.
2 Observation and Data reduction
The observations of SNR RX J1713.7–3946 by the XMM-Newton satellite (Jansen et al. 2001) were carried out in March 2001, September 2001 and March 2002 with a total of five pointings. In this paper, we used five data sets from the archive with the positional identification of center (CE), northeast (NE), northwest (NW), southwest (SW) and southeast (SE) as listed in Table 1. These observations cover almost the whole remnant including the bright western portion, and the central dim region. Data from the EPIC (European Photon Imaging Camera) which consists of two MOS CCDs (MOS1 & MOS2) (Turner et al. 2001) and the pn CCD (Strüder et al. 2001) are used for analysis. The pixel size is 11 and 41 for the MOS and the pn CCDs, respectively, while the mirror PSF width is 15″ of HPD (Half Power Diameter). All data have been acquired with the medium filters and imaging mode, full frame for the MOS and extended full frame for the pn CCDs. Therefore the temporal resolution is low, 2.5 s and 280 ms for the MOS and the pn CCDs, respectively.
The pipeline process of event screening was carried out using Science Analysis System (SAS) software (version 5.4.1) and the latest calibration data. In general, the data quality obtained by XMM-Newton depends on the condition of individual observations because data sometimes suffer from particle flares in orbit (mainly due to protons) which can not be removed by the standard pipeline process. These particle flares dramatically increase the count rate by over one order of magnitude above that of quiescent periods and cause high background in the detector. We were careful to exclude such intervals by using wide band (0.5–10.0 keV) light curves for each observation. Time periods where the count rate deviates from the mean value during quiescent periods by are removed from subsequent analysis. Since the pn CCD is more sensitive to proton flares than the MOS CCD, the net exposure time for the pn CCD is reduced by a large amount (see Table1).
The NE observation severely suffered from particle flares during the observation and the net exposure time is reduced to only 2.5 ksec out of the 14 ksec of total observation time in the MOS CCDs. Therefore, the NE observation is used only for imaging analysis since the statistics are too poor to carry out a spectral analysis. On the other hand, we obtain good statistics from both the SW and CE, even with the relatively low source flux, because the observation was carried out under good conditions in terms of the non X-ray background (NXB). The good quality of data enables us to perform spatially resolved spectroscopy of the diffuse emission from dim regions in the central part of the remnant. Although the situation is better than the case for the NE observation, the data from the NW observation has a significant fraction of the NXB. The deviation of the count rate in the 0.510.0 keV band is 20 % of the mean value, whereas it is 12 % in the case of SW and CE observations. We therefore need individual estimates of the background for spectral analysis (see §3.2).
| Obs.ID | Coord (J2000) | Exposure | Date |
|---|---|---|---|
| MOS1/MOS2/pn | |||
| [ksec] | |||
| 0093670501 (CE) | , | 14/14/9 | 2/3/2001 |
| 0093670101 (NE) | , | 2.5/2.6/ | 5/9/2001 |
| 0093670201 (NW) | , | 14/14/10 | 5/9/2001 |
| 0093670301 (SW) | , | 16/16/11 | 7/9/2001 |
| 0093670401 (SE) | , | 13/13/6 | 14/3/2002 |
-
a
There were little good time intervals (GTI).
3 Analysis and Results
3.1 Image analysis
Recently, Uchiyama et al. (2003) noted the high inhomogeneity towards the NW portion of RX J1713.7–3946, using the spatial resolution of 05 of the Chandra satellite. The NW portion has complex, filamentary structures in the synchrotron X-ray emission, namely, bright filaments and spots embedded in the diffuse plateau and the dim circular void. These structures show distinctive variations of the surface brightness on scales down to 20″.
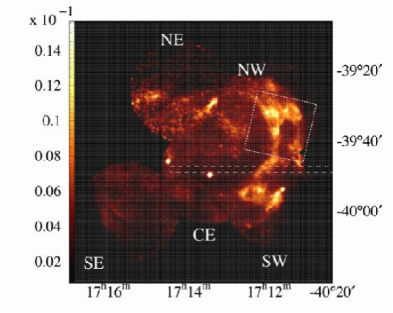
Most of the entire remnant of RX J1713.73946 is covered with the spatial resolution of 15″ and the large FOV of XMM-Newton. The spatial resolution of fifteen arcsec is sufficient to investigate the fine structures discovered with Chandra. Figure 1 shows mosaic X-ray images of SNR RX J1713.7–3946 in 0.7–2.0 keV (soft band) constructed from the data obtained by the EPIC MOS1 and MOS2. The images are smoothed by a Gaussian with 15″ . The mirror vignetting and exposure time are corrected whereas the background is not subtracted. The white square corresponds to Chandra’s 17′17′ FOV (Fig. 2 in Uchiyama et al. 2003). We also construct a hard band image (2.0–7.0 keV) which shows virtually identical to that in the soft band image.
In the bright western portion, the thick rim with an apparent width of 8′ obtained with ASCA (Slane et al. 1999) is resolved into distinct components (see also Cassam-Chenaï et al. 2004). Two nested narrow arc-like rims (hereafter we refer to them as the ‘outer rim’ and ‘inner rim’ ) are found. The inner rim seems to have a radius of 16′ and is elongated toward the northeastern (NE) portion. The outer rim runs parallel to the inner rim from north to south with a gap of 8′ whereas it is torn off in the middle west. In the interior of the remnant, we can see diffuse, dim X-ray emission (hereafter, referred to as ‘interior regions’ ). In comparison with the rim regions, no filamentary structures are seen. Figure 2 shows the profile of photon counts from the white-dashed rectangular region depicted in the soft band image of Fig. 1, summed over the narrow-vertical dimension of the rectangle. The interior region shows a quite flat profile with its deviation smaller than 20% from the mean value. Note that the detected counts are far from the background level. This motivated us to perform a spatially-resolved analysis of the spectrum with much finer angular resolution than what was possible for the ASCA data (see § 3.2.2).
On small scales within the rim region, complex structures are detected in the NW portion such as bright filaments, spots and two voids. These structures are exactly the same as discovered by Chandra (Fig.6 in Uchiyama et al. 2003). Prominent filaments, identified by 2, 3 in Fig.6 in Uchiyama et al. (2003) are revealed to be a part of the inner rim. In addition to the NW portion, Fig.1 shows complex structures in the southwestern (SW) portion. We find other voids in the middle west and in the end of SW side of the remnant enclosed by the outer rim as well as some bright filaments and spots. There is a conspicuous plateau inserted between two voids. The data demonstrates that the fine structures discovered in the Chandra FOV are a common characteristic of the SNR RX J1713.7–3946. These characteristic structures stand in line between the inner and outer rims. Hereafter we refer to both the two rims and the substructures inside them as the ‘rim region’ .
There are two point sources seen in the mosaic image. Both sources are identified in the ROSAT bright source catalogue, 1WGA J1714.4–3945 associated with a star (Pfefferman & Aschenbach 1996) and 1WGA 1713.4–3949. 1WGA 1713.4–3949, located near the center of the remnant, is suggested to be the associated neutron star for the RX J1713.7–3946 by Lazendic et al. (2003).

3.2 Spectral analysis
As suggested by previous observations, the entire region of RX J1713.7–3946 is dominated by nonthermal X-ray emission with a complete lack of thermal emission (Koyama et al. 1997; Slane et al. 1999). Uchiyama et al. (2003) demonstrated that the X-ray spectra are best fit by hard power-law spectra with a photon index ranging 2.1–2.5 which does not correlate with significant brightness variations within the NW rim inside the Chandra FOV. They argued, furthermore, that the observed hard power-law seems to require the synchrotron cutoff energy to be above 10 keV which needs a high shock speed exceeding 5 000 km .
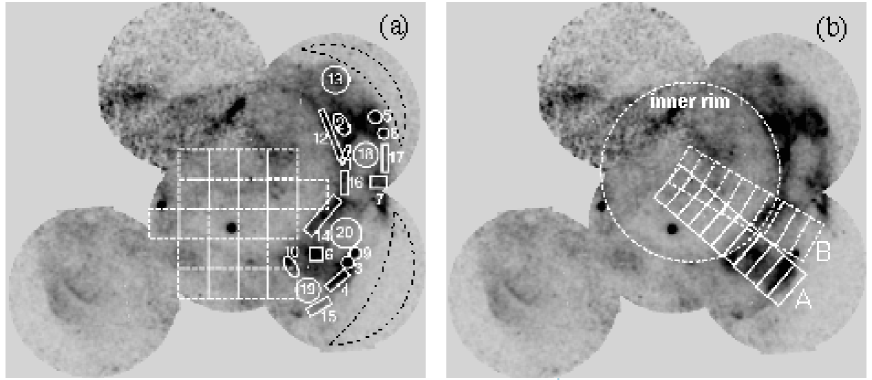
In the spectral analysis, especially for extended sources, a careful estimation of the background (BG) is necessary. Since the SNR RX J1713.7–3946 is located near the galactic plane, we need to extract the BG data from a source free region in the same FOV. In the analysis, the BG data is extracted from the individual FOV denoted by the dashed curve both in NW and SW (Fig. 3 for the MOS1 and MOS2 data) because the signal to noise ratio is different between the NW observation and SW observation. These data include NXB as well as cosmic X-ray background (CXB) and the galactic diffuse emission. For the pn CCD, the BG data are extracted from the outside of SNR RX J1713.7–3946 which is in the outer part of the detector. We have examined the BG flux variation in the detector plane using archived Lockman Hole data. We find no significant variation for the continuum over the 5 keV in which the NXB is dominant. The intensity of fluorescent lines of the NXB, especially 7.0–9.0 keV , in the pn CCD has a significant position dependency in the detector (e.g. Lumb et al. 2002). No significant source fluxes are detected above 9.0 keV . We, therefore, ignore the data above 7.0 keV in the subsequent spectral analysis. In the low energy part ( 1 keV), the NXB is relatively constant () and a high signal to noise ratio above 0.7 keV is obtained. In order to derive the spectral parameters, we perform simultaneous spectral fitting with all of the EPIC instruments from 0.7 keV up to the 7.0 keV intervals. For the CE observation, the same BG data as for the SW observation were used since the data have no source free regions and the light curve shows a similar level with that of the SW observation (see §2).
3.2.1 Rim regions
We select 20 characteristic regions in the rim region for the study of spectral variations (Fig. 3 (a)). From all spectra, we detect only featureless continua without any line emission. Spectra are fitted by a power-law function with photoelectric absorption along the line-of-sight, . XMM-Newton has a large effective area, much larger than that of Chandra, especially in the low energy part (). This enables us to determine more precisely, because is strongly constrained by spectra below 1 keV. On the other hand, RX J1713.7–3946 is located in the inhomogeneous region of the galactic plane and is suggested to have a physical interaction with the molecular cloud. It is important to examine the possible variation of as well as . We therefore set both photon index, and absorption column density, free in the spectral fitting.
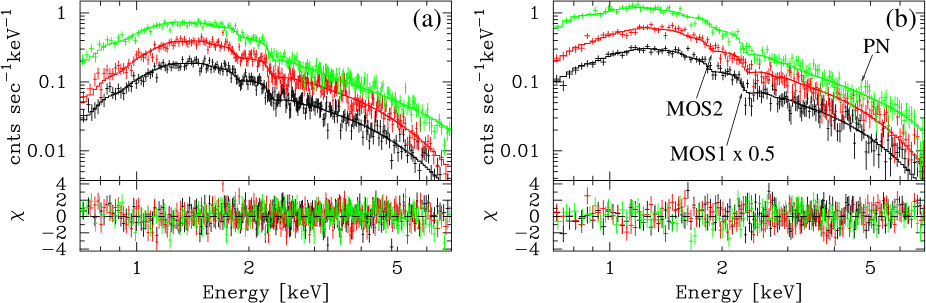
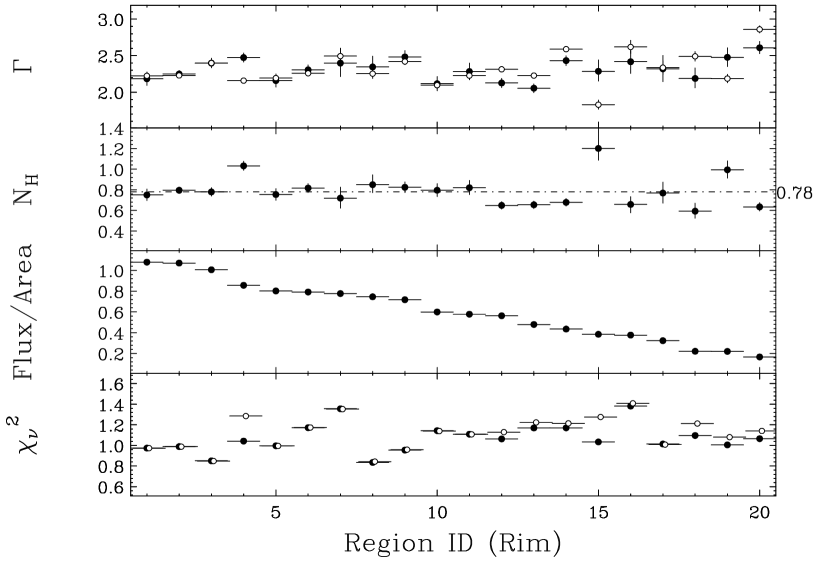
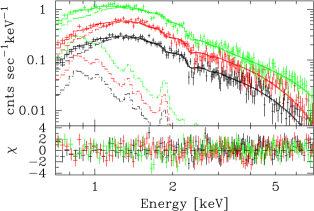
Spectra from representative region ‘6’ are shown in Fig. 4 (a) with the best fit model as a typical example. We show the spectral parameters obtained for these regions depicted with filled circles in Fig. 5. It is demonstrated that all spectra are fitted by a power-law function with photon index ranging from 2.1–2.6 , with a somewhat large for . Best-fit values of the absorbing column density, , are similar in almost all cases, with average values of . These values are consistent with the ASCA results obtained from the spectra integrated over the NW and SW rims. (Koyama et al. 1997; Slane et al. 1999).
Based on the Chandra observations, Lazendic et al. (2004) reported that the spectral shape in the brighter regions is flatter than those in the fainter regions (Fig. B3 in Lazendic et al. 2004) adopting a fixed value of column density. In order to verify the significance of the spectral variation both for and for , we tried to fit spectra with a fixed of , an average value for the rim regions. Although similar results are obtained in almost of all cases as denoted with circles in the top and bottom panels of Fig. 5, we find that increase remarkably for several regions such as regions “4” and “15” in which there could be true variation of column density in the small scale of arcmin. By treating as a free parameter we obtain significantly large , greater than 1.0 for these regions which possibly corresponds to the region where the maximums of CO emission was reported (Fukui et al. 2003).
3.2.2 Interior region
For finding out the spectral property in the interior region, we select an annular region from 75 to 10′ intervals around the central point source and perform the spectral fitting with power-law and photoelectric absorption models. Fig. 4 (b) shows the obtained spectra which show featureless continua without line emission for the best-fit models. We find that the spectral shape is different from that in Fig. 4 (a) (rim region) in the low energy part ( 1 keV). The resultant photon index is and the absorption column density is . In order to examine possible spectral variations in the interior region, we divide the region into 20 squares of 5′ 5′ (Fig. 3 (a)) and perform a systematic spectral fitting. The resultant photon indices, , vary ranging from 2.0–2.8 from place to place. It seems to have no correlation with either absorption column density, , or flux.
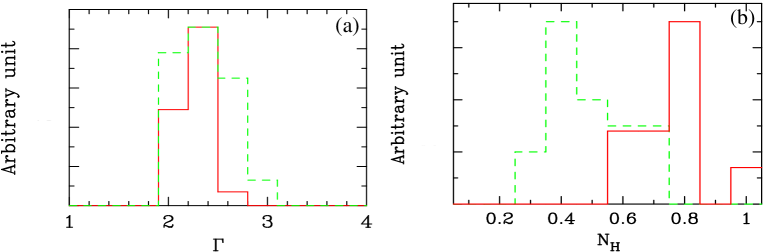
In Fig. 6, we show the distributions of parameters and obtained with the best-fit model. It is clear that each region has a similar distribution of with an average of . However shows obvious discrepancies with average of for the interior region and for the rim region. The increase of column density, implies that the rim region is covered by an additional medium which absorbs X-ray emission, such as a dense molecular cloud.
One of the unique features of RX J1713.7–3946 is the complete lack of measurable thermal emission which is expected from the hot gas that resides in SNRs. Nevertheless one may assume that the observed spectral differences from the rim and interior region at low energies part can be caused by an additional thermal component from the center of the remnant due to a limited energy resolution of CCDs. Assuming that the interstellar absorption of (the average value of at the rim region) is constant over the entire remnant, we can calculate the largest possible amount of the thermal component. We perform a spectral fit for the same spectra as shown in Fig. 4 (b) with an additional thermal component of a MEKAL model (XSPEC v11.0). We derive the best-fit values for different , e.g. 0.76 , and . We set the photon index, , as a free parameter and fix the abundances to solar values. Statistically acceptable results () are obtained from the fitting. The best-fit model in the case of is shown in Fig. 7. The resultant parameters are 0.56–0.57 keV, 2.37–2.39 for each case of . The emission measure, EM is calculated to be where and are the mean number density of electron and hydrogen, is the volume and is the distance to the remnant. Assuming is 1.2 times and a uniform density distribution inside the sphere of 16′ in radius (inner rim), we derive , where is the distance normalized to 1 kpc.
We should note, however, the hypothesis of the additional thermal component, which requires a very large interstellar absorption column density, does not match with the X-ray spectrum of the central point source (1WGA 1713.4–3949). It is well fitted by a blackbody model with photoelectric absorption. The best-fit value () of is 0.40 0.01 keV and that of is 0.37 0.03 . The resultant absorption column density, , is in rather good agreement with that found towards the interior region. Even so, with this approach, we can derive an important upper limit on the flux of the thermal component. We note that the possible thermal emission is very subtle, such as of unabsorbed flux in 0.6–10.0 keV X-ray band per solid angle. This is only 10 % of the nonthermal emission. It is quite different from the case of SN 1006. The X-ray emission of the central region of SN 1006 is completely due to thermal emission with no nonthermal component. Even near the rim, the thermal emission is observed to be comparable to that of the nonthermal emission of in the 0.6–10.0 keV band (Bamba et al. 2003).
3.3 Radial profile of the spectral variation
XMM-Newton observations enabled us to quantify the spectral variation in the dim interior region of RX J1713.73946. We observe that the spectrum in the interior region is dominated by nonthermal X-ray emission as pointed out by ASCA observations (Koyama et al. 1997; Slane et al. 1999). This is very unusual because thermal emission from a hot plasma is generally expected as seen in SN 1006. At least in the framework of the standard diffusive shock acceleration model, in which the electrons accelerated in the shell hardly could achieve, due to severe radiative losses, the central parts of the remnant. we should expect strong steepening of the synchrotron spectrum moving towards the center but it is not the case for RX J1713.73946. It is therefore important to explore the three dimensional structure of the remnant, in particular to examine whether the emission from the interior region could be the result of geometrical effects, i.e. the projection of the shell, or intrinsic origin due to relativistic electrons interacting with the ambient magnetic fields.
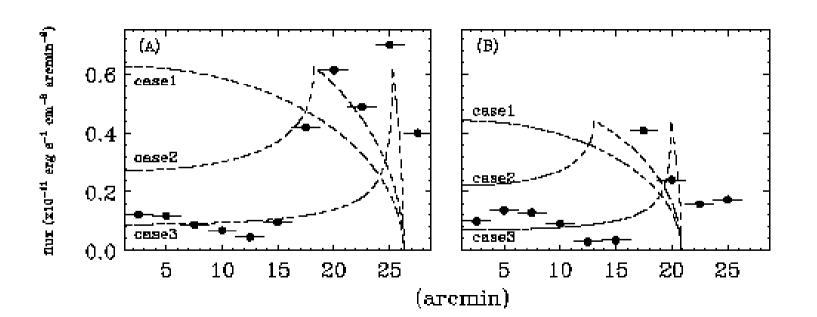
In order to investigate the radial variation of the nonthermal X-ray emission, we extract spectra from two sets of 10 rectangle regions with 25 intervals (Fig. 3(b)). (A) is selected such that the regions run across both the inner and outer rims, whereas (B) is selected to run across only the inner rim. Spectral fits are performed using the same model of the previous analysis and consistent results for best-fit parameters of and are obtained.
In Fig. 8, we construct radial profiles of the surface brightness. We examine three simple cases assuming uniform distribution of the volume emissivity; the sphere (case 1), the 8′-thick shell (case 2) and 1′-thick shell (case 3). The one arcmin of shell thickness roughly corresponds to the width of the inner or outer rims whereas the eight-arcmin of shell thickness corresponds to that of the bright western portion containing both the inner and outer rims. None of our assumptions can explain the observed profiles of the surface brightness; there is a broad shell and the interior is about one order of magnitude dimmer than the rim. Although there is little doubt that the geometrical effect of the shell brighten contributes non-negligibly to the flux observed from the dim interior region, it is difficult to obtain a quantitative estimate of the ratio of the shell emission to the other contribution given the complex shape of the remnant. Moreover, we note that the bright compact features appear only in the rim region. We may conclude that the surface brightness variation is somewhat contributed to by the intrinsic origin and/or difference of the volume emissivity.
In Table 2, we listed the best-fit values and the absolute fluxes which is accurate to within about 10% in the current investigation of on-board calibration111detailed in http:/xmm.vilspa.esa.es/docs/documents/XMM-SOC-CAL-TN-0018. In the rim regions, the resultant fluxes are integrated for characteristic regions such as NWb, NWd, SWb and SWd denoted in Fig. 3(b). This is consistent with the ASCA results (Uchiyama et al. 2002). In order to estimate how much emission totally comes from the interior dim region, we sum up the resultant fluxes for twenty square regions of 5′ 5′ (see §3.2.2).
| Region | area | ||||
|---|---|---|---|---|---|
| (arcmin2) | |||||
| NWb | 125 | 2.28 | 0.72 | 7.3 | 8.7 |
| NWd | 64 | 2.12 | 0.68 | 2.8 | 3.4 |
| SWb | 125 | 2.38 | 0.83 | 6.2 | 7.4 |
| SWd | 77 | 2.54 | 0.68 | 1.9 | 2.3 |
| Interior | 500 | 2.39a | 0.46a | 5.4 | 6.5 |
-
Note.
is the unabsorbed flux in the 1–10 keV band. is the distance to the source normalized to 1 kpc.
-
a
average values with totally 20 squires of 5′ 5′.
4 Discussion
We examined the SNR RX J1713.7–3946 by using the XMM-Newton data to further investigate the remarkable features in nonthermal X-ray emission discovered by Uchiyama et al. (2003). The XMM-Newton X-ray image demonstrates complex morphological structures such as filaments and voids in the bright western region, while relatively weak and smooth emission around the center of the remnant. The X-ray spectra everywhere in the remnant are successfully represented by a power-law with a photon index ranging from 2.0–2.8. We found no line features in the X-ray spectrum anywhere. The low energy part ( 1 keV) of the X-ray spectra in the dim interior region systematically differs from that in the western bright portion, which is attributable either to an additional absorption in the western spectra or to an additional thermal component in the interior region. The surface brightness of nonthermal X-ray emission of RX J1713.73946 has distinctive variations across the remnant both on large scales (Pfeffermann & Aschenbach 1996; Slane et al. 1999), showing broad shell-like morphology, and on small scales down to 20″ (Uchiyama et al. 2003). There is no correlation between photon indices, absorption column density and surface brightness in the western bright (rim) region. A similar spectral shape of power-law suggests that the same emission mechanism — presumably synchrotron radiation given the observed luminosity and spectral shape — is operating everywhere.
The observed surface brightness variations can be ascribed to different volume emissivities from place to place, or to different path lengths along the line-of-sight with similar volume emissivity. Dimmer parts of the remnant have a surface brightness typically an order of magnitude lower than the bright plateau. Adopting a typical depth of the bright plateau of 10′ inferred from an apparent thickness, the dimmer portions should have a thin shell-like structure of a thickness of 1′ if we assume the same volume emissivity. However, because we do not find such a thin shell at the periphery of the remnant, it seems difficult to regard all of the dim regions as a thin bright shell. Instead of the effect of different path length, we therefore prefer to invoke spatial variation of volume emissivity; the western part would be bright thanks to an enhanced emissivity. Moreover, the presence of spots indicates significant enhancement of the volume emissivity of nonthermal X-rays.
The high X-ray volume emissivity can be caused by concentration of relativistic electrons and/or large magnetic fields. The luminosity of synchrotron X-ray emission most likely reaches its maximum value given by the injection rate of electrons at least on large scales. Therefore the enhanced X-rays in the bright western portion would not be due solely to large magnetic fields, but result primarily from a higher electron injection rate there.
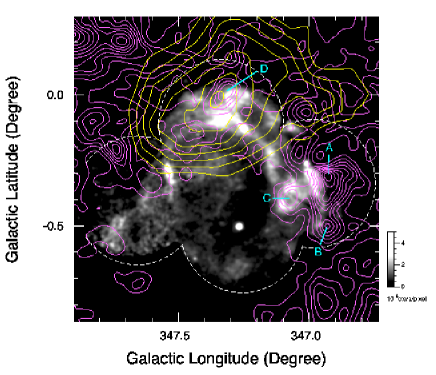
Fukui et al. (2003) have recently reported the discovery of a molecular cloud at 1 kpc interacting with the SNR RX J1713.7–3946, based on CO observations made with the NANTEN telescope. The observations (at 2.6 mm wavelength) covered the entire SNR region with 2′ grids achieving a high sensitivity that enabled them to detect a column density down to . A morphological correspondence between the newly-discovered molecular cloud of velocity range from to and X-ray emission is evident; a “hole” in the CO distribution matches the overall X-ray morphology (see Fig.1 in Fukui et al. 2003). In Fig. 9 (the same with Fig. 2 of Fukui et al. 2003), a close-up view of the CO map is compared with the X-ray image taken by XMM-Newton which referred to this study. A remarkable correspondence can be seen on an arcmin scale, particularly in the western portion.
We found possible evidence that the X-ray spectra in the western bright part suffer from larger absorption column densities, 0.3–0.4, than the interior region (see §3.2.2). The typical intensity of the CO line of detected by NANTEN toward the X-ray bright part can be used to an atomic hydrogen column density of with the conversion relation from the CO line intensity to the molecular hydrogen column density of (Bertsch et al. 1993), which nicely agrees with the inferred additional absorption column density toward the western bright portion. With the current data, we can also explain the change of the low energy part of X-ray spectra by introducing an additional thermal component from inside the remnant. We need further observations to disentangle the two possibilities.
The presence of the molecular cloud being coincident with the X-ray bright regions also would account for the enhanced nonthermal emissivity in the western part. The striking association between the CO peaks (A–D) and X-ray bright features (it is important to note that both CO and X-ray emissions have been detected with superior statistical significance) suggests that the high X-ray emissivities would be caused by enhanced electron acceleration and/or compressed magnetic fields at secondary shocks resulting from the collisions of the SNR blast wave and the molecular cloud. Yet another possibility, although quite unusual, is that the nonthermal X-ray emission emerges directly from the molecular cloud. With this interpretation, the high X-ray emissivities would originate in the molecular cloud itself. We will discuss the origin of the nonthermal X-ray emission in RX J1713.7–3946 in a forthcoming paper.
5 Conclusion
XMM-Newton observations show the existence of fine structures throughout the entire remnant, especially in its western portion in which interaction with a dense molecular cloud is strongly suggested the recent NANTEN observations. Spectra everywhere in the remnant can be represented by power-law functions with photon index ranging from 2.0–2.8 assuming some absorption in line-of-sight of –. We found that there is no correlation between photon indices and the brightness variation. It is found that the obtained for the rim regions is systematically larger than that obtained for the interior regions. The differences of spectral shape between the rim and the interior region at lower energies can be explained by an additional column density, 0.3–0.4 , for the rim region. This is in good agreement with the molecular cloud recently discovered by the NANTEN telescope. The spectral differences can be also described by introducing an additional thermal emission from the interior region. Although we treat this as a less likely scenario, given the strong evidence of interaction of a dense molecular cloud with the shell of the supernova remnant, it gives a quite robust upper limit on the flux of the thermal X-ray emission component from this supernova remnant. The thermal X-ray flux appears to be an order of magnitude smaller than the nonthermal flux of RX J1713.7–3946.
References
- (1) Bamba, A., Yamazaki, R., Ueno, M., et al. 2003, ApJ, 589, 827
- (2) Bertsch, D. L., Dame, T. M., Fichtel, C. E., et al. 1997, ApJ, 416, 587
- (3) Butt, Y. M., Torres, D. F., Combi, J. A., Dame, T., & Romero, G. E. 2001, ApJ, 562, L167
- (4) Cassam-Chenaï, C. G., Decourchelle, A., Ballet, J., et al. 2004, in IAU Symp. 218, ASP Conf. Proc, ed Camilo, F & Gaemsler, B. M
- (5) Enomoto, R., Tanimori, T., Naito, T., et al. 2002, Nature, 416, 823
- (6) Fukui, Y., Moriguchi, Y., Tamura, K. et al. 2003, PASJ, 55, L61
- (7) Jansen, F., Lumb, D., Altieri, B., et al. 2001, A&A, 365, L1
- (8) Koyama, K., Kinugasa, K., Matsuzaki, K. et al. 1997, PASJ, 49, L7
- (9) Lazendic, J. S., Slane. P. O,Gaensler. B. M., et al. 2003, ApJ, 593, L27
- (10) Lazendic, J. S., Slane. P. O,Gaensler. B. M., et al. 2004, ApJ, 602, L201
- (11) Lumb. D. H., Warwick. R. S., Page. M., et al. 2002, A&A, 365, L93
- (12) Muraishi, H., Tanimori, T., Yanagita, T. et al. 2000, A&A, 354, L57
- (13) Pannuti, T G., Allen, G E. Houck. J. C. et al. 2003, ApJ, 593, 10
- (14) Pfeffermann, E., & Aschenbach, B. 1996, in Röntgenstrahlung from the Universe, ed H. U. Zimmermann, J. Trümper, & H. Yorke. (MPE Rep. 263) 267
- (15) Slane, P., Gaensler, B. M., Dame, T. M., et al. 1999, ApJ, 525, 357
- (16) Strüder, L., Briel, U., Dennerl, K., et al. 2001, A&A, 365, L18
- (17) Turner, M. J. L., Abbey, A., Arnaud, M. et al. 2001, A&A, 365, L27
- (18) Uchiyama, Y., Takahashi, T., & Aharonian, F. A. 2002, PASJ, 54, L73
- (19) Uchiyama, Y., Aharonian, F. A. & Takahashi, T. 2003, A&A, 400, 567