The complex structure of low luminosity active galactic nuclei : NGC 4579
Abstract
We have modelled the low luminosity AGN NGC 4579 by explaining both the continuum and the line spectra observed with different apertures. It was found that the nuclear emission is dominated by an AGN such that the flux from the active centre (AC) is relatively low compared with that of the NLR of Seyfert galaxies. However, the contribution of a young starburst cannot be neglected, as well as that of shock dominated clouds with velocities of 100, 300, and 500 . A small contribution from an older starburst with an age of 4.5 Myr, probably located in the external nuclear region is also found. HII regions appear in the the extended regions ( 1 kpc), where radiation and shock dominated clouds with =100 prevail. The continuum SED of NGC 4579 is characterized by the strong flux from an old stellar population. Emissions in the radio range show synchrotron radiation from the base of the jet outflowing from the accretion disc within 0.1 pc from the active centre. Radio emission within intermediate distances (10-20 pc) is explained by the bremsstrahlung from gas downstream of low velocity shocks (=100 ) reached by a relatively low radiation flux from the AC. In extended regions ( 100 pc) the radio emission is synchrotron radiation created by the Fermi mechanism at the shock front. The shocks are created by collision of clouds with the jet. All types of emissions observed at different radius from the centre can be reconciled with the presence of the jet.
keywords:
galaxies: active-galaxies: nuclei-galaxies individual: NGC4579.1 Introduction
The analysis of the line and continuum spectra of active galactic nuclei (AGN) developed in the last years, revealed that radiation in the different spectral ranges depends on different excitation mechanisms of gas and dust. It was found, in particular (e.g. Contini & Viegas 2000, Contini, Viegas & Prieto 2004) that both the photoionizing flux from the active centre (AC) and collisional processes in supersonic velocity fields contribute to ionization and heating of the emitting gas (and dust) in the narrow emission-line region (NLR) with different relative importance.
In low luminosity objects, such as LLAGNs (low luminosity AGN) and LINERs (low ionization nuclear emission regions) starbursts as well as an active nucleus can be present with comparable importance. Anyway, winds and jets are often observed, leading to a prominent role of shocks. The complex nature of LINERs was revealed by modelling the most significant line ratios in the UV-optical-IR spectra (Contini 1997). Moreover, modelling the X-ray -IR continuum correlation in a large sample of AGN, Contini, Viegas & Campos (2003) found that LLAGNs are in the low luminosity tail of AGN. This is explained by a relative low flux from the AC, roughly two orders of magnitude lower than that found in the NLR of Seyfert 2 and Seyfert 1 galaxies,
In this paper we analyse the spectra of NGC 4579 which is classified as a LINER 1.9 galaxy with many AGN characteristics by Pogge et al. (2000) and as a Seyfert 1.9 by Ulvestad & Ho (2001). The morphological type of NGC 4579 is SBb. The galaxy is located at a distance of 20 Mpc (cz=1502 ) (Gonzalez-Delgado & Perez, 1996). Hubble Space Telescope (HST) images at 2300 Å (Maoz et al. 1995) show emission resolved into two components, a bright core and a weaker source with a flux corresponding to 15 % of that of the bright core. The weaker source is extended 0.1 X 0.2 arcsec2 and is located 0.2 arcsec from the bright core at PA=72o.
From ground-based observations the galaxy was previously known to contain a type 1 nucleus revealed by a broad H line (FWHM of 2300 ). New spectra obtained by HST 0.2” slit reveal an H component with FWZI of 18,000 (Barth et al, 2001) with ”shoulders” on the red and blue sides. About 31 low-luminosity HII regions have been detected and measured in the disc, located along the dust lanes of the spiral arms, at distances between 3.3 and 7.5 kpc from the nucleus (Gonzalez-Delgado & Perez).
NGC 4579 line spectra have been observed with different apertures in the different frequency domains by Gonzalez-Delgado & Perez (1996) within 1.5” in the nuclear region and within 20” in regions A and B, and previously by Keel (1983) within 4.7”, and by Stauffer (1982) within 4.0”.
In this paper we address the line spectra observed by Gonzalez-Delgado & Perez with small and large apertures. The latter include some information about the surroundings of the nucleus. The earlier data by Keel and Stauffer obtained with intermediate apertures will be considered only to check the consistency of modelling. In fact, the large apertures integrate on all the conditions found in the nucleus, the values from the small aperture and the surroundings. In the case of this galaxy they are rather complex and includes every thing from a nuclear stellar bar, a starforming ring, an the old galaxy population, etc.
Indeed, the low [OIII] 5007/4363 observed line ratio (Sect. 2.2) indicates relatively high temperatures in the emitting gas, because very high densities ( 1000 ) downstream are excluded by [SII] 6717/6730 1. The radiation flux from the AC cannot heat the gas of the NLR to temperatures 2 104 K, which, on the other hand, are easily reached by collisional heating downstream of the shock front. Moreover, the [OII] 3727+/H (the + symbol indicates that the doublet intensities are summed up) and [OI] 6300+/H line ratios are relatively high. So pure photoionization models (cfr. the code CLOUDY) are less adapted to model NGC 4579. The SUMA code (Viegas & Contini 1994, Contini & Viegas 2001a,b and references therein) which calculates the spectra emitted from gas and dust accounting for the coupled effects of shocks and of an external photoionizing source, is adopted throughout this work.
The spectral energy distribution (SED) of the continuum is calculated consistently with the line spectra to constrain the models. Particularly, the SED of NGC 4579 continuum is characterised by an unusually high contribution of the old stellar population, higher by a factor of 10 than in Seyfert 2 and Seyfert 1 galaxies.
The observations in the radio by Anderson, Ulvestad, & Ho (2003) provide the fluxes within 104 Schwarzchild radii of the black hole, i.e. within 0.1 pc from the nucleus for a sample of LLAGN (NGC 3147, NGC 4168, NGC 4203, NGC 4235, and NGC 4450). NGC 4579 was actually selected from this sample because radio data are available also on larger scales. It was suggested by Ulvestad & Ho (2001) that jets are responsible of the subparsec radio emission. This may originate in synchrotron radiation from discrete plasma components or from the ”base” of a continuous jet ejected from the central engine, which becomes optically thin on larger scales (Nagar, Wilson, & Falcke 2001). Anderson et al. explain the observed spectral slope by compact jets that can accomodate the average spectral index, the relatively high radio luminosity, and the unresolved appearance. This applies only if the jets are fairly close to our line of sight. Anderson et al. conclude that, as the galaxies show a broad line component, they have to be in the right direction. This suggests that synchrotron emission with different spectral indices can be observed at different distances from the AC, and that shock fronts are at work. The shocks are created by collision of jets with the interstellar medium (ISM). The in-situ particle acceleration associated with shocks could lead then to extended regions of radio emission with suitable spectral indices. Moreover, if the jets were disrupted by interaction with the ISM, the emission line and continuum spectra from the NLR clouds should show the characteristic features of shocks, such as relatively high low ionization (e.g. [OII],[NII], and [SII]) and neutral (e.g. [OI]) line ratios to H, and high [OIII] 4363 /[OIII] 5007+. Moreover, soft X-ray emission and dust reradiation in the IR could be explained, as well as faint diffuse radio emission (Middleberg et al. 2004). The signature of shocks is well recognizable in the radio range of the continuum because the power-law type of synchrotron radiation has a different slope than that of bremsstrahlung from cool gas (Contini & Viegas 2000).
In this paper, we will investigate whether radio emissions within different radii from the AC on large scales are consistent with the jet hypothesis by showing that the different types of emissions within different regions can be explained by the shocks. Actually, shocks in the NLR of AGN are investigated by modelling the line and continuum spectra. In order to unravel the different aspects of the NGC 4579 complex (e.g. the AGN, the starburst, and the HII region), we will model NGC 4579 first through the line spectra (Sect. 2). We will calculate the different components of the continuum SED and compare them with the data observed with different apertures in Sect. 3. Discussion and conclusions follow in Sect. 4.
2 The line spectra
The spectra in the nuclear region observed by Gonzalez-Delgado & Perez (1996) within 1.5” at the 4.2 m William Herschel Telescope in La Palma during 1988 March, and at the 1 m Jacobus Kapteyn Telescope during 1992 May show a number of line ratios large enough for modelling. The spectra observed in the circumnuclear region ( 20”) contain a small number of lines, and are not reddening corrected. They can however provide some precious results. The line spectra observed by Keel (1983) at 4.7” and by Stauffer (1982) at 4.0” at the Lick 1 m Anna Nickel telescope are relatively poor in number of lines.
Pogge et al (2000) in their Table 3 give the ratio of [OIII]/H in the nuclear (0.23”, 18pc) region and in the circumnuclear (2.5”, 194pc) regions, which correspond to [OIII]/H=0.37 and 0.06 , respectively. However, they cannot be used for the modelling because they refer to ”band” fluxes, not converted to emission in a particular line by correcting for the filter transmission of other lines in the bandpass.
2.1 Modelling procedure
We consider clouds moving outwards from the centre. The inner edge of the clouds is illuminated by the flux from the photoionizing source (AGN, starburst, HII region, etc) while the outer edge defines the shock front.
As a first guess, we compare the data with models from the grids calculated by the SUMA code (Contini & Viegas 2001a,b, thereafter CV01a and CV01b). The models presented in (CV01a) correspond to the AGN with power-law flux intensities ranging from zero in shock dominated (SD) clouds up to a maximum of log 13 which was found in radiation dominated (RD) clouds by previous modelling of AGN (e.g. Contini & Viegas 2000). Models presented in CV01b refer to the starbursts where the ionizing flux corresponds to a stellar cluster. Models for HII regions where black body radiation reaches the inner edge of the cloud are also presented in CV01b. All the models are composite, i.e. they account also for the shocks, as suggested by the relatively strong low ionization level lines (Contini 1997), by soft X-ray, as well as by infrared luminosities (Contini, Viegas, & Campos 2003).
The input parameters of SUMA relative to the shock are the following : the shock velocity, , the pre-shock density, and the pre-shock magnetic field, . Those relative to the flux are the power law flux, , in units of photons cm-2 s-1 eV-1 at 1 Ryd, the spectral indices in the UV and X-ray ranges. = -1.5 and = -0.4 are adopted, respectively. In models representing starbursts, t is the starburst age, and for HII regions is the color temperature of the stars. U is the ionization parameter in both cases. For all types of models D is the geometrical thickness of the cloud, and d/g the dust-to-gas ratio. A preshock magnetic field = 10-4 gauss and cosmic relative abundances (Allen 1973) are used for all the models.
The intensity of each line depends on the physical conditions of the emitting gas, namely, on the distribution of the temperature, density, and fractional abundance of the corresponding ion downstream of the shock front, and on the relative abundance of the elements.
In our previous modelling of the NLR of AGN (e.g. Contini et al. 2003 and references therein) it was found that multi-cloud models explain the observed spectra. These models result from the weighted sum of models representing single clouds each characterized mainly by the shock velocity, the gas density, and the radiation flux intensity. For LINERs, in particular, it was found that the single-cloud models account for all types of ionizing and heating mechanisms (Contini 1997), e.g. the power-law radiation from the active nucleus, the radiation from starburts, the black body radiation from stars with a certain colour temperature, and shocks created by collision of clouds in the ISM and in supernova remnants (SNR). Therefore multi-cloud models will be adopted in the present modelling. The relative importance of the different types which best fit the observed spectra will shed some light on the characteristics of the galaxy on scales larger than the nuclear ones.
| M1 | M2 | M3 | M4 | M5 | M6 | M7 | M8 | M9 | M10 | M11 | M12 | |||
| type1 | SD | SD | SD | pl | pl | pl | pl | pl | sb | sb | sb | hII | ||
| [OII] 3727+ | 4.20 | 16.80 | 3.20 | 4.0 | 4.80 | 13.10 | 8.30 | 7.0 | 2.60 | 1.73 | 9.50 | 1.0 | ||
| [NeIII] 3869+ | .17 | 2.70 | 1.0 | .50 | .94 | .77 | .86 | 1.21 | .33 | .54 | 3.45 | .12 | ||
| [OIII] 4363 | .12 | 1.35 | .31 | .02 | .03 | .29 | .04 | .03 | .01 | .05 | .07 | .19 | ||
| [OIII] 5007+ | 1.55 | 17.10 | 4.60 | 1.70 | 7.40 | 3.67 | 3.86 | 6.42 | 2.20 | 9.54 | 13.17 | 2.0 | ||
| [NI] 5200+ | .01 | .26 | .53 | .18 | .17 | .04 | .003 | .03 | 0.03 | 3.(-4) | .025 | .13 | ||
| [OI] 6300+ | .03 | 1.39 | 3.54 | 2.0 | 3.0 | 2.17 | .84 | 1.46 | .66 | .005 | 8.04 | 1.90 | ||
| [NII] 6548+ | .46 | 4.50 | 3.34 | 4.90 | 7.43 | 7.81 | 5.0 | 5.79 | 2.64 | .88 | 13.94 | 5.0 | ||
| [SII] 6716 | .15 | 1.50 | 2.60 | 3.86 | 5.20 | 3.73 | 2.21 | 1.65 | 1.80 | .14 | 1.93 | 1.75 | ||
| [SII] 6730 | .14 | 2.27 | 4.06 | 3.12 | 4.34 | 3.20 | 2.19 | 2.43 | 1.70 | .15 | 1.71 | 1.95 | ||
| [OII] 7325+ | .34 | 5.15 | .79 | .12 | .13 | .79 | .25 | .39 | .06 | .04 | .25 | .03 | ||
| [SIII] 6069+ | .14 | 1.40 | .24 | 1.38 | 1.77 | 1.28 | 1.17 | 1.60 | .24 | 2.65 | 9.13 | 3.80 | ||
| H | .81 | .75 | 6.7 | 6. | 12.6 | .35 | 3. | 45. | 16. | 5.80 | 68. | 700. | ||
| () | 100 | 300 | 500 | 100 | 100 | 100 | 100 | 100 | 100 | 100 | 100 | 200 | ||
| () | 100 | 300 | 300 | 100 | 100 | 100 | 100 | 300 | 100 | 100 | 100 | 200 | ||
| D (1017cm) | 100 | 100 | 10 | 100 | 100 | 1 | 1 | 1 | 100 | 1 | 100 | 100 | ||
| log F | - | - | - | 9. | 9.48 | 8. | 9. | 10. | - | - | - | - | ||
| U | - | - | - | - | - | - | - | - | .01 | .01 | .01 | .10 | ||
| t (Myr) | - | - | - | - | - | - | - | - | 0.0 | 0.0 | 4.50 | - | ||
| (104 K) | - | - | - | - | - | - | - | - | - | - | - | 5 | ||
| w(MC1) | 90 | 190 | 5 | - | - | 5 | - | 20 | 10 | - | 1 | - | ||
| w(MC2) | 9000 | - | - | 500 | - | - | 50 | - | - | - | - | 1 | ||
| Nuclear region (MC1) : | ||||||||||||||
| % [OII] 3727+ | 3.0 | 23.5 | 1.0 | .0 | .0 | .0 | .0 | 62.0 | 4.1 | .0 | 6.3 | .0 | ||
| % [OIII] 4363 | 3.5 | 78.0 | 4.2 | .0 | .0 | .0 | .0 | 11.0 | .6 | .0 | 2.0 | .0 | ||
| % [OIII] 5007+ | 1.2 | 25.0 | 1.6 | .0 | .0 | .0 | .0 | 59.3 | 3.6 | .0 | 9.2 | .0 | ||
| % [OI] 6300+ | .0 | 8.6 | 5.2 | .0 | .0 | .17 | .0 | 57.4 | 4.6 | .0 | 24.0 | .0 | ||
| % H | 5.3 | 10.3 | 2.4 | .0 | .0 | .1 | .0 | 65.3 | 11.6 | .0 | 4.9 | .0 | ||
| Regions A and B (MC2) : | ||||||||||||||
| % [OII] 3727+ | 68.7 | .0 | .0 | 26.9 | .0 | .0 | 2.8 | .0 | .0 | .0 | .0 | 1.6 | ||
| % [OIII] 4363 | 81.5 | .0 | .0 | 5.6 | .0 | .0 | .6 | .0 | .0 | .0 | .0 | 12.4 | ||
| % [OIII] 5007+ | 61.5 | .0 | .0 | 27.7 | .0 | .0 | 3.1 | .0 | .0 | .0 | .0 | 7.6 | ||
| % [OI] 6300+ | 2.4 | .0 | .0 | 78.5 | .0 | .0 | 1.65 | .0 | .0 | .0 | .0 | 17.4 | ||
| % H | 65.40 | .0 | .0 | 27.0 | .0 | .0 | 1.3 | .0 | .0 | .0 | .0 | 6.3 |
2.2 Single-cloud models : the physical conditions of the emitting gas
Single-cloud models are shown in Table 1. Some models that do not contribute to the best fit are also included (e.g. M5 and M10) in order to understand the dependence of the line ratios on the different input parameters.
Interestingly, the models which roughly fit the line ratios belong to all of the different types which are considered in the interpretation of LLAGN spectra (Contini 1997, Contini et al. 2003) : SD models with a relatively low (=100 in M1) and high (=500 in M3) shock velocities, RD composite models corresponding to a relatively low and a low radiation flux from the AC reaching the cloud (M4, M5, M6, M7, and M8), composite models relative to a young starburst (M9 and M10) and to a starburst with an age of 4.5 Myr (M11), and a composite model corresponding to an HII region (M12). Both radiation-bound and matter-bound models appear in Table 1.
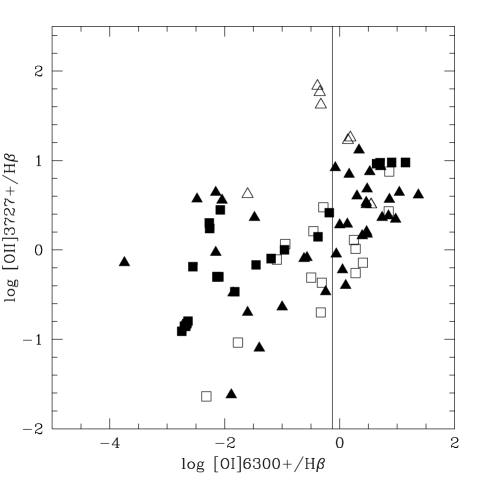
Cid Fernandez et al (2004) and Gonzalez-Delgado et al. (2004) claim that the relative importance between collisional phenomena and the photoionizing radiation which originates from the AC and/or from starbursts, or even from HII regions, can be deduced from the line ratios. Very recently, analysing new ground observations of LLAGN and data by HST, respectively, they distinguished between objects with high [OI] 6300/H (0.25) and low [OI] 6300/H relatively to the stellar population age and to the presence of an active nucleus. The data collected from the grids are given in Fig. 1 . It can be seen that the data referring to starburst models show [OI]/H 0.75 ([OI]/H 0.25, adopting H/H=3), out of few models calculated by =100 , U=0.01, an age of t= 3.3-4.5 Myr, and D=3 pc. In other words, these clouds are more likely located in the surroundings of the starburst, and they are merging with the ISM. All the other models showing [OI]/H 0.75 refer to composite models with a power-law flux, shock dominated models, and models for HII regions.
The spectra calculated by SD models with =300 (M2) and =500 (M3) and a preshock density =300 , are chosen following our previous results that the velocity gradient increasing towards the AC is accompanied by a density gradient, and because [NI]/H are relatively high and [SIII]/H relatively low. Model M4 accounts for a relatively low ionization flux from the AC that is appropriate to LINERs. The composite model which accounts for a starburst at early age and a small ionization parameter (M9) shows a relatively low . As was pointed out by Viegas, Contini & Contini (1999) and confirmed by Contini & Contini (2003) low shock velocities are characteristic of young starbursts, which had not yet the time to develop supernovae. The only model corresponding to an older starburst (M11) which could be considered corresponds to a low . Most of the line ratios to H are higher than observed, out of [OIII] 4363 and [NI] 5200+. Finally, the spectrum emitted from gas illuminated by a HII region corresponding to a temperature of 5 104 K and U=0.1 (M12) is characterised by low [OII]/H line ratios.
The single-cloud models fit the data very roughly. Yet they can lead to a better fit when summed up adopting relative weights.
2.3 Multi-cloud models : comparison with the data
| line | obs1 | MC1 | obs2 | obs3 | MC2 | |
|---|---|---|---|---|---|---|
| [OII]3727+ | 8. 0.7 | 7.4 | 3.6 | 4.5 | 4. | |
| [NeIII]3868 | 0.7 0.1 | 1. | - | - | - | |
| [OIII]4363 | 0.7 0.1 | 0.2 | - | - | - | |
| [OIII]5007+ | 7.1 0.6 | 7. | 1. | 1.3 | 1.6 | |
| [NI]5199+ | 0.79 0.09 | 0.07 | - | 0.36 | 0.06 | |
| [OI]6300+ | 1.46 0.14 | 1.66 | 0.27 | 0.32 | 0.7 | |
| [NII]6548+ | 7.9 0.7 | 5.4 | 7.8 | 9. | 2. | |
| H n | 3.2 | 3. | 3. | 3. | 3. | |
| H b | - | - | - | - | - | |
| [SII]6716 | 1.8 0.2 | 1.6 | 2.25 | 2.49 | 1.3 | |
| [SII]6730 | 1.8 0.2 | 2.2 | 1.89 | 1.86 | 1.1 | |
| [OII]7325+ | 0.61 | 0.8 | - | - | - | |
| [SIII]6069+ | 0.29 0.05 | 1.8 | - | - | - |
Modelling the NLR of different galaxies (Seyfert types 1 and 2, NLS1, luminous infrared starburst galaxies, LINERs, etc) we have learned that the spectra are generally explained by multi-cloud models. Models MC1 and MC2 which appear in Table 2 result from the weighted averages of single-cloud models which better fit the line ratios. The weights corresponding to the different single-cloud models are given in the rows 13 and 14 from the bottom of Table 1. The relative weights compensate for the H absolute flux intensities and indicate roughly the covering factors of each type of clouds. So e.g. the relative weight of model M12 is low, but this does not mean that HII regions do not contribute somewhat to the NGC 4579 spectra.
In Table 2 we compare the observed line ratios with model results. The results show that the N/H relative abundance is higher than cosmic (9.1 10-5) by a factor 2 within 1.5” and by a factor 3 in the extended region. The [OIII] 4363/5007 line ratios are underpredicted by a factor of 3, while [NI]/H and [SIII]/H are underpredicted and overpredicted by factors of 6, respectively in the nuclear region. The fit, in fact could be improved by models calculated purposely for NGC 4579 and/or by a larger number of single-cloud models. The average spectra corresponding to the extended regions A and B (MC2) overpredict the [OI]/H line ratio and underpredict the [SII]/H ratios. Generally, a lower [OI] flux corresponds to a lower [SII] flux, because the first ionization potential of S is lower than that of H and, therefore, of O. So, we conclude that also the S/H relative abundance should be about twice the cosmic one (1.6 10-5) in the extended region. The number of the observed line ratios is small and does not constrain strongly the averaged model. Nevertheless, the present analysis, which is carried out only by models from the grids, shows that the choice of models presented in the grids is sensible.
The results show that in NGC 4579 the AGN coexists with starbursts and HII regions, as is generally found for LLAGNs. The relative importance of the different types is determined by the relative weights adopted summing up the single-cloud models.
In the bottom of Table 1 the contribution in percent of each model to each of some significant lines ([OII] 3727+, [OIII] 4363, [OIII] 5007+, [OI] 6360+, and H) is given for the nuclear region and in regions A and B.
It can be noticed that the largest contribution ( 60 %) to the nuclear spectra comes from RD clouds corresponding to the highest flux (log = 10) and relatively low velocities (M8). SD clouds corresponding to =300 (M2) also contribute by factors 8.6%, with maxima of 80 % to the [OIII] 4363 line. A contribution 5% to all the lines comes from SD clouds with =500 (M3). Interestingly, a young starburst (M9) contributes by less than 13 % with maxima of 12 % to [SII] 6717 and H. Moreover, a starburst with an age of 4.5 Myr (M11) contributes to all the lines.
Shock velocities of 100 in the young starburst are reasonable, because the starburst had not yet the time to develop SN. However, the low (100 ) and (100 ) in the older starburst may indicate that the starburst is in the outskirts of nuclear region where the outward velocities are generally low, while the young starburst is most probably correlated with the jet within the nuclear region. A similar situation was found in the Seyfert 2 galaxy NGC 7130 (Contini et al. 2002) where a young starburst was revealed by modelling the spectra in the nuclear region, even if the effect of the AGN dominates, while the circumnuclear regions show spectra corresponding to stars with lower temperatures.
Regions A and B show a strong contribution from SD clouds (M1) and RD clouds (M4, M7) reached by a rather low flux, and having =100 . HII regions corresponding to a temperature of 5 104 K (M12) are also present.
It is clear that the HII regions are located in the circumnuclear regions of NGC 4579, while the AGN and the young starburst coexist in the nuclear region. The distances of regions A and B from the nucleus are within 1 kpc (Gonzales-Delgado & Perez 1996, Fig. 4a). The modelling shows that high do not appear in these regions.
Indeed, the classification (Cid Fernandes et al, Gonzalez-Delgado et al 2004) between LINERs and Transition Objects considering the [OI]/H line ratio sets NGC 4579 among LINERs and is consistent with the presence of an AGN nucleus and of an old stellar population.
Finally, the spectra observed within 4.7” and 4.0” by Keel (1983) and Stauffer (1982), respectively, hint about the conditions beyond the nuclear region. The spectra show significant contributions from HII regions (M12), SD clouds with =500 (M3), and of an AGN with log =9 (M4). It is typical of the NGC 4579 continuum SED that the old star population strongly dominates in the optical range (see Sect. 3). These stars do not affect the spectra because their temperatures are too low to heat and ionize the surrounding gas. The signature of old stars in the spectra could be revealed by collisional events in supernova winds leading to high velocity shocks which contribute to the heating and ionization of the gas in the clouds.
3 The continuum SED


The modelling of line and continuum spectra must be cross-checked until the best fitting model is found for both.
The bremsstrahlung emitted from gas in the downstream region of the NLR clouds, generally explains the observed SED in a wide frequency range (108 - 1018 Hz). In the infrared range, however, dust emission dominates, while the old stellar population background is observed in the optical - near-IR. Synchrotron radiation generated by the Fermi mechanism at the shock front is often observed in the radio range of AGN.
In Figs. 2 we present the SED of the continuum of NGC 4579 in the different spectral ranges, while Fig. 3 shows the SED of the multi-cloud spectrum in a large frequency range. Open triangles represent data from the NED/IPAC Extragalactic Database) (Fabbiano et al. 1992, Kinney et al. 1993, Kodaira et al. 1990, De Voucouleurs et al. 1991, Zwicky et al. 1961, Spinoglio et al. 1995, Aaronson 1977, Jarrett et al. 2003, Roussel et al. 2001, Scoville et al. 1983, Soifer et al. 1989, Moshir et al. 1990, Tuffs et al. 2002, Whiteoak 1970, Becker et al. 1991, Gregory & Condon, 1991, Dressel & Condon 1978, Heeschen & Wade 1964), where the data in the soft X-ray range are upper-limit. Open squares show the data from observations in the near-mid-IR by Alonso-Herrero et al (2003). Black triangles represent the data of Anderson, Ulvestad, & Ho (2003) from 1.7 to 43 GHz using the Very Long Baseline Array, while the black squares show the data by Hummel (1980) obtained at the Westerbork Synthesis Radio Telescope, and the data by Crane (1977). Notice that Hummel presents two data at 1.5 GHz, namely, the flux density of the central source ( 21”, i.e. 1.6 kpc) and the total flux density of the galaxy with a radio extent of 3.9 arcmin along the major axis. The fluxes from Crane 1977 at 2.7 and 8.1 GHz with size 3” (about 230 pc, adopting a distance to Earth of 16 Mpc as given by Roussel et al 2001) are also given by Hummel (1980). The data from the NED by Heeschen & Wade (1969) broad band measurement, as well as the total flux at 1.5 GHz by Hummel account for radiation from a more extended region.
3.1 Bremsstrahlung
Consistent modelling of line (Sect. 2) and continuum spectra (Contini, Viegas & Prieto 2004) of NGC 4579 shows that the SED is explained by a multi-cloud model which accounts for SD clouds with shock velocities of 500 (solid lines) and RD clouds with a low (100 ) reached by a relatively low photoionization flux from the AC (log =9) represented by short-dashed lines in Fig. 2. The bremsstrahlung from these RD and SD clouds (Fig. 2, top-left) fits the data in the optical-UV range. The modelling of line spectra in the previous section revealed that the dominant component from the nuclear region corresponds to RD clouds with =100 , =300 , and log = 10 (short-dash-long-dashed lines).
A small contribution from high velocity clouds with = 1000 and a preshock density =1000 can explain the emission in the soft X-ray range (dotted lines). This model however does not contribute to the line ratios because the line fluxes are low. Moreover, it was found by modelling the mid-IR data (Contini et al 2004) from the sample of Seyfert galaxies observed by Alonso-Herrero et al. (2003) that a high density, low velocity single-cloud model (=1000 , =100 ) contributes to the fit of most of the galaxies, among them also NGC 4579. This model which is also shown in Fig. 2 (long-dashed lines) corresponds to very low line ratios to H and is not included in the selected grid (Table 1).
Recall that the modelling of the spectra have to account for covering factors, for the distance of the emitting clouds from the AC and for the distance of the galaxy from Earth, because the models are calculated at the nebula, while the spectra are observed at Earth. The models in Fig. 2 are scaled roughly by taking into account the weights and the above mentioned factors. In fact, same types of clouds are located in different regions. Notice that the model corresponding to the HII regions does not contribute to the continuum because its relative weight is low.
3.2 Infrared bump
Dust and gas are coupled across the shock front and downstream, so the grains are collisionally heated by the gas to temperatures which depend on the shock velocity. Reradiation from dust in the IR is well explained in Fig. 2 (top-right) by the same models which fit the bremsstrahlung. For all models a dust-to-gas ratio of 10-14 by number (corresponding to 4 10-4 by mass adopting silicate grains) leads to a good fit of the infrared emission bump. In composite models corresponding to a relatively low flux from the AC or to a low ionization parameter, U, dust grains are mainly heated collisionally by the gas throughout the shock front and downstream. Therefore, the frequencies corresponding to the peaks of the infrared emission depend on the shock velocity (see Contini et al. 2004). Thus, it is difficult to distinguish between starburst activity and/or an active nucleus from the analysis of the infrared bump.
3.3 Old star contribution
Fig. 2 (bottom-left panel) shows that a peculiar characteristic of NGC 4579 consists in the very high contribution to the continuum in the optical range of an old star population background, which is modelled by a black-body corresponding to T=5000 K (dot-dashed line). As was explained by Contini et al. (2004) Alonso-Herrero et al. data (open squares) are uncontaminated from the star contribution.
3.4 Radio emissions
The data in the radio range, relative to different apertures, are used to determine the different slopes of the continuum which correspond to the different mechanisms. Fig. 2 (bottom-right panel) shows a detailed presentation of the data and modelling.
Bremsstrahlung emission from high density gas downstream can be self absorbed at long wavelengths, as was found in the Circinus galaxy, NGC 7130, etc. This occurs to the downstream emission from clouds with a preshock density 300 and =1000 . For example, model M3 with =500 has a density downstream of 104 , a temperature of 104 K after recombination in a region of about 1019 cm, leading to optically thick gas ( 1) for Hz.
On the other hand, in RD clouds, the bremsstrahlung from gas downstream of the low velocity shock explains the data from Hummel (1980) and Crane (1977) which refer to a region extended to intermediate distances from the AC. This is in agreement with Stauffer (1982) who claims that in his sample, nuclear radio sources and optical activity are well correlated.
The data relative to the most extended region of the galaxy show relatively high fluxes and a different trend. The data are well explained by the synchrotron power-law radiation with = -0.75 (Bell 1978) (thin solid line) created at the shock front by the Fermi mechanism. In fact, the values corresponding to large apertures may include anything from SN and SNR in the galaxy as a whole.
The data within 0.1 pc from the AC are investigated by Anderson et al. Although the slope defined by the data resembles bremsstrahlung emission with some absorption at longer wavelengths, Ulvestad & Ho (2001) claim that the free-free interpretation is untenable because the source is much more compact ( 0.05 pc) than the dimension of nuclear tori. Advection-dominated accretion flows provide a good fit to the spectral slopes but the luminosities are too high relative to the black hole masses calculated from the diffuse motions. In this paper we adopt the modelling by Anderson et al. who explain the observed spectral slope by jets (see Sect. 1)

4 Discussion and concluding remarks
In the previous sections we have modelled the line and continuum spectra of NGC 4579.
Early interpretations of the line spectra (e.g. Stauffer 1982) based on the high electron temperature derived from the low [OIII] 5007/4363 ratio and on the similarity with the spectra of SNR, already suggested the presence of shocks. However, LINER-like spectra are also shown by galaxies in which some filaments, arcs and extended features reveal vigorous recent bursts of star formation (Gonzalez-Delgado & Perez 1996, Contini 1997). The weak broad H emission observed in NGC 4579 and UV radiation similar to those of Seyfert galaxies suggest an AGN nature of the spectra but with stronger low-ionization lines (Barth et al. 2001).
The results of the present modelling show that the multi-cloud models which best explain the line ratios account for all types of photoionizing sources, as well as for the shocks. The relative importance of the different ionizing mechanisms is determined by the relative weight adopted to sum up the different single-cloud models.
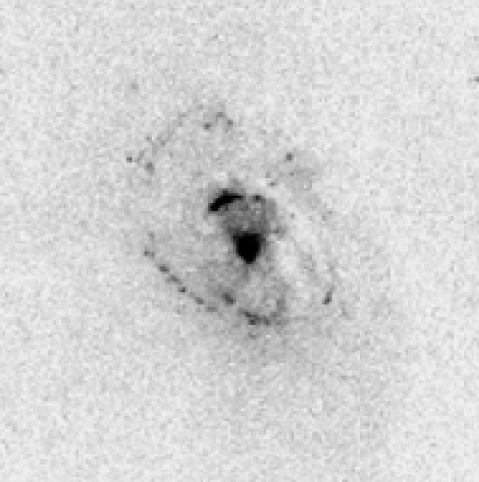
The nuclear emission is dominated by the AGN with a relative low flux from the AC (log =10) compared with that found in the NLR of Seyfert galaxies (log 11-13). On top of this there is the relative small contribution of a young starburst in agreement with Maoz et al (1995) who found two emission components in the nucleus of NGC 4579. Shock dominated clouds with velocities of 100, 300, and 500 , as well as an older starburst with an age of 4.5 Myr, probably located in the external nuclear region were also revealed by modelling. The good agreement of model predictions with the observations is evident in Fig. 4. Fig. 4 shows a section of a recent image of the nuclear region of NGC 4579, obtained with the Hubble Space Telescope’s Advanced Camera for Surveys in the F330W band, corresponding to Å (D. Maoz et al., in preparation). The extended source from the nucleus, previously noted by Maoz et al. (1995), is now resolved into a short arc which forms the beginning of the spiral arm that can be traced for over one revolution around the nucleus. This region likely contributes young stellar features to ground-based spectra where it is included in the aperture.
In the extended A and B regions ( 1 kpc), RD clouds reached by a flux weaker by a factor of 10 than that in the nuclear region, due to dilution with distance, contribute to most of the line fluxes, while HII regions corresponding to = 5 104 K are also revealed. The contribution of SD clouds with =100 to the [OII] 3727 and [OIII] 5007 lines is significant, confirming that the velocity gradient decreases towards the outskirts of the galaxy. Such low velocities are generally present in LINERs and LLAGNs (Contini, Viegas, & Campos 2003).
The regions observed by Stauffer (1982) and Keel (1983) within intermediate apertures are explained by the same AGN corresponding to a low flux, by shocks with a rather high (500 ) and by the HII regions which dominate the spectra. The high velocity SD clouds created by collisional events in SN winds may be related with the strong flux from the old stellar population in the optical - near-IR range revealed by the continuum SED of NGC 4579.
Indeed, the calculated throughout the galaxy are in the range of those observed in the NLR of AGN. Stauffer (1982) claims that the observed FWHM are 280 , while Barth et al find a FWHM of about 520-570 for the narrow H, and for [NII] and [SII] lines. Pogge et al (2000) claim that the bulk of H and [OIII] emission comes from a clumpy complex with an elliptical shape of major axis of 2” (the emission region is between tens and hundreds of parsecs). So many different conditions coexist and spectra from clouds with different can indeed be present. The same conclusions were found modelling the Seyfert 2 galaxies Circinus (Contini, Prieto, & Viegas 1998), NGC 7130 (Contini et al. 2002), and LINERs (Contini 1997). In Seyfert 2 galaxies the AGN dominates in the nuclear region, while in LINERs the shock prevails.
The complex nature of LLAGN as an AGN + starbursts is discussed very recently by Cid Fernandez et al. (2004) and Gonzalez-Delgado et al. (2004) in the light of new observations. They found that few LLAGN have a detectable young ( yr) starburst component, indicating that massive stars do not contribute significantly to the optical continuum. No features of W-R stars are present. Intermediate age populations are very common in LLAGN with relatively low [OI]/H emission ( 0.25), but rare for stronger [OI]. Moreover, the dominant source of ionization in strong-[OI] LLAGN is likely an AGN which is consistent with the detection of broad Balmer lines in emission in a few cases and a larger contribution of older stars in their stellar population. Therefore, it seems that the strong [OI] ([OI]/H 0.25) objects are true LLAGN, with stellar processes being insignificant.
Actually, NGC 4579 belongs to the strong [OI] type. The models presented in Table 1 which were selected by fitting the NGC 4579 spectra show that only models M1 and M10 correspond to a very low [OI]/H. M10 is a matter bound model, which does not contribute to NGC 4579 spectra, and M1 is a SD model corresponding to low and . On the other hand, the young starburst corresponding to radiation bound model M9, is characterised by [OI]/H = 0.22 (adopting H/H= 3)), while the power-law dominated model (M4 in Table 1) and the high velocity shock (M3) show high [OI]/H line ratios (0.66 and 1.2, respectively). This confirms that in low [OI]/H LLAGN a young starburst dominates, as found by Gonzalez-Delgado et al., while, starbursts of older ages (t 3.3 Myr) show very high [OI]/H as for AGN. This does not exclude that in complex high [OI]/H objects, a young starburst can be present, however, by a low weight, as found for NGC 4579. Also SD models show high [OI]/H line ratio. These models generally explain the emission in supernova remnant, i.e they are related with an old stellar population, in agreement with Cid Fernandez et al who claim that in the strong-[OI] LLAGN, stars cannot play an important role in the gas ionization. Recall that the presence of old stars is revealed by the SED of NGC 4579.
We have particularly focused on the nature of the emission in the radio range. We have adopted the Ulvestad & Ho explaination that synchrotron emission from the base of the jet fits the radio data observed within 0.1 pc from the active centre. Modelling the continuum SED it is found that radio emission within intermediate distances (10-200 pc) from the centre is explained by the bremsstrahlung from gas downstream of low velocity shocks (=100 ) reached by a rather low radiation intensity from the AC. The shocks are created by the collision of clouds with the jet (Blandford & Königl 1979). Within larger distances from the AC ( 100 pc) the dominant radio emission is synchrotron radiation with a spectral index of -0.75 created by the Fermi mechanism at the shock front, as is often observed from Seyfert galaxies (Contini & Viegas 2000). So all types of emission observed within different radius from the AC can be reconciled consistently with the presence of the jet outflowing from the accretion disk, if shocks are created by collision of the jet with ISM and/or NLR matter. Consistently with the presence of the jet, the young starburst can be created in the nuclear region close to the base of the jet, by the interaction of the high velocity gas with clouds, while the old stars are located in the circumnuclear region. The stars were created by triggering in collision of shocks with dense matter, so the shocks are loosing velocity towards the outskirts of the galaxy.
In conclusion, we have explained both the line and continuum spectra in the different regions of the LLAGN NGC 4579 by composite models accounting for the AGN and for the shocks which are created by collision of the jets with ISM clouds within different distances from the centre, as well as for starbursts of different ages, and for the HII regions.
Acknowledgments
I am very grateful to an anonymous referee for valuable comments which improved the presentation of the paper. I thank D. Maoz for providing the recent image of the nuclear region of NGC 4579, S.M. Viegas and M.A. Prieto for helpful discussions, and I. Goldman for reading the manuscript.
References
- (1) Aaronson, M., 1977 PhD Thesis Harvard Univ, Cambridge, MA
- (2) Allen, C.W., 1973, Astrophysical Quantities (London: Athlon)
- (3) Alonso-Herrero, A., Quillen, A.C., Rieke, G.H., Ivanov, V.D., Efstathiou, A., 2003, AJ, 126, 81
- (4) Anderson, J.M., Ulvestad, J.S., Ho, L.C., astro-ph/0311303
- (5) Barth, A.J., Ho, L.C., Filippenko, A.V., Rix, H-W, Sargent, W.L.W., 2001, ApJ, 546, 205
- (6) Becker, R.H., White, R.L., Edwards, A.L., 1991, ApJS, 75, 1
- (7) Bell, A.R., 1978, MNRAS, 182, 443
- (8) Blandford, R.D., Königl, A., 1979, ApJ, 232, 34
- (9) Cid Fernandez, R. et al., 2004, astro-ph/0401416
- (10) Contini, M., 1997, A&A, 323, 71
- (11) Contini, M., Contini, T., 2003, MNRAS, 342, 299
- (12) Contini, M., Radovich, M., Rafanelli, P., Richter, G.M., 2002, ApJ, 572, 124
- (13) Contini, M., Viegas, S.M., 2000, ApJ, 535, 721
- (14) Contini, M., Viegas, S.M., 2001a, ApJS, 132, 211
- (15) Contini, M., Viegas, S.M., 2001b, ApJS, 137, 75
- (16) Contini, M., Viegas, S.M., Campos, P.E., 2003 MNRAS, 346, 37
- (17) Contini, M., Prieto, M.A., Viegas, S.M., 1998, ApJ, 505, 621
- (18) Contini, M., Viegas, S.M., Prieto, M.A., 2004 MNRAS, 348, 1065
- (19) Crane, P.C., 1977, Thesis, Massachussets Institute of Technology
- (20) De Voucouleurs, G., De Voucouleurs, A., Corwin Jr., H.G., Buta, R.G., Paturel, G., Fouque, P., 1991, RC3.9.C
- (21) Dressel, L.L., Condon, J.J., 1978, ApJS, 36, 53
- (22) Fabbiano, G., Kim, D.-W., Trinchieri, G., 1992, ApJS, 80,53
- (23) Gonzalez-Delgado, R.M., Perez, E., 1996, MNRAS, 281, 1105
- (24) Gonzalez-Delgado, R.M. et al., 2004, astro-pc/0401414
- (25) Gregory, P.C., Condon, J.J., 1991, ApJS, 75, 1011
- (26) Heeschen, D.S., Wade, C.M., 1964, AJ, 69, 277
- (27) Hummel, E., 1980, A&AS, 41, 151
- (28) Jarrett, T.H., Chester, T., Cutri, R., Schneider, S.E., Huchra, J.P., 2003, AJ, 125, 525
- (29) Keel, W.C., 1983, ApJ, 269, 466
- (30) Kinney, A.L., Bohlin, R.C., Calzetti, D. Panagia, N., Wyse, R.F.G., 1993, ApJS, 86, 5
- (31) Kodaira,K., Watanabe, T., Onaka, T., Tanaka, W., 1990, ApJ, 363, 422
- (32) Maoz, D., Filippenko,, A.V., Ho, L.C., Rix, H.W., Bachall, J.N., Schneider, D.P., Macchetto, F.D., 1995, ApJ, 440, 91
- (33) Middelberg, E. et al., 2004, A&A, 417, 925
- (34) Moshir, M. et al., 1990, BAAS, 22, 1325
- (35) Nagar, N.M., Wilson, A.S., Falcke, H., 2001, ApJ, 559, L87
- (36) Pogge, R.W., Maoz, D., Ho, L.C., Eracleus, M., 2000, ApJ, 532, 323
- (37) Roussel, H. et al., 2001, A&A, 369, 473
- (38) Scoville, N.I., Becklin, E.E., Young, J.S., Capps, R.W., 1983, ApJ, 271, 512
- (39) Soifer, B.T., Boehmer,, L., Neugebauer, G., Sanders, D.B., 1989, AJ, 98, 766
- (40) Spinoglio, L., Malkan, M.A., Rush, B., Carrasco, L., Recillas-Cruz, E., 1995, ApJ, 453, 616
- (41) Stauffer, J.R., 1982, ApJ, 262, 66
- (42) Tuffs, R.J. et al., 2002, ApJS, 139, 37
- (43) Ulvestad, J.S., Ho, L.C., 2001, ApJ, 562, L133
- (44) Viegas, S. M., Contini, M., 1994, ApJ, 428, 113
- (45) Viegas, S. M., Contini, M., Contini, T., 1999, A&A, 347, 112
- (46) Whiteoak, J.B., 1970, ApL, 5, 29
- (47) Zwicky, F., Herzog, E., Wild, P., 1961, Pasadena: California Institute of Technology (CIT), lc1961