Cosmic Filaments in Superclusters
Abstract
Large-scale structure calculations show that modest overdensity filaments will connect clusters of galaxies and these filaments are reservoirs of baryons, mainly in gaseous form. To determine whether such filaments exist, we have examined the UV absorption line properties of three AGNs projected behind possible filaments in superclusters of galaxies; the AGNs lie within 3 Mpc of the centerlines of loci connecting clusters. All three lines of sight show absorption in Ly, Ly, or/and O VI at redshifts within about 1300 km s-1 of the nearby galaxy clusters that would define the closest filaments. For one AGN, the absorption line redshifts are close to the emission line redshift of the AGN, so we cannot rule out self-absorption for this object. These absorption line associations with superclusters are unlikely to have occurred by chance, a result consistent with the presence of cosmic filaments within superclusters.
1 Introduction
Big-bang nucleosynthesis and quasar absorption line studies (at ) determine the same mass fraction of baryons in the universe: (e.g., Fukugita, Hogan, and Peebles 1998). It was expected that this gas would become the galaxies of today, but a census of stars and gas in galaxies in the local universe accounts for only about 20% of the baryonic mass. This is the “missing” baryon problem that has drawn much attention, for which the leading solution is that the baryons have remained as dilute gas (e.g., Fukugita, Hogan, and Peebles 1998; Cen and Ostriker 1999a; Davé et al. 2001). However, the Ly forest becomes less dense in the local universe by about a factor of 3-4 compared to the number of absorption systems at fixed equivalent width at z = 3. This decrease in the baryons is not balanced by the increase in the stellar mass, leading to the conclusion that a significant mass of gas must be hot, above 105 K.
There is a prediction for the properties of the missing baryons from hierarchical models of structure formation. The most visible large structures are clusters of galaxies, which are deep potential wells of high overdensity, but these clusters are relatively rare. The more common collapsed systems are groups of galaxies and the large filaments that connect the groups and clusters. Groups of galaxies are weak emitters of X-rays, indicating gas at 0.3–2 K but with extended gaseous masses that are very poorly known because their extent is broad and their surface brightness fades below the detectability of X-ray instruments at a fraction of the virial radius.
It is the filaments that contain most of the volume in collapsed structures and here the temperature is generally lower, typically – K, according to theoretical calculations (e.g., Cen et al. 1995). There have been no convincing detections of these filaments in emission, but there is good evidence that gas is present at these temperatures, as O VI absorption is detected by both HST and FUSE in observations toward bright AGNs (e.g., Savage et al. 2002). Gas bearing O VI occurs when K, a temperature expected in filaments, and because this doublet is strong and oxygen is the most abundant heavy element, this is an excellent tracer of such gas. These observations show that O VI absorption is common, for mÅ (Tripp and Savage 2000). It is predicted that the O VI absorption lies in a network of filaments with modest overdensities of 10–40 (Cen et al. 2001) as well as in the galaxy groups (Hellsten et al. 1998). When O VI is present, a small fraction of hydrogen is still neutral, so the Lyman series lines of H I accompany O VI as a tracer.
The goal of our effort is to identify the likely locations of these filaments and then to determine whether O VI and H I absorption is associated with them. Theoretical simulations guide us to the most likely location of filaments (Evrard et al. 2002), which shows that they generally connect rich clusters, sothe objects with the highest frequency of filaments (and the largest covering factor) are the superclusters of galaxies. These are generally several galaxy clusters near each other on the sky and with only modest velocity differences, so they are physically close in space. In this study, we examine three AGNs that have already been observed in the ultraviolet either by the Far Ultraviolet Spectroscopic Explorer (FUSE), or by the Hubble Space Telescope (HST), and each of these show absorption near the redshift of the supercluster behind which they are projected. We analyze the properties of these absorption features and discuss the implication for the detection of the “cosmic web” of filaments.
2 Sample Selection and Results
Practical aspects of observing, involving the identification of suitably bright AGNs, drive us toward using the nearby superclusters as the optimum absorption sites. Nearby superclusters subtend a large solid angle (with known redshift), which is very helpful for finding sufficiently bright background AGNs. Also, most of the brightest AGNs are nearby, typically Seyfert galaxies at z 0.1, so the superclusters must be at lower redshift, which are the closest superclusters. Another consideration is that numerical simuations suggest that filaments connect clusters in a near-linear fashion, so the background AGN should lie close to loci connecting clusters. The tangential dimensions of the filaments (at an overdensity of 10) are predicted to be the same size as the virial radii of the galaxy clusters ( 3 Mpc; Cen and Ostriker 1999b), so background AGNs should be within this distance of the line connecting clusters, although, as this is a theoretical prediction, we will include AGNs that are not so ideally aligned.
Superclusters have been cataloged out to a distance of (Einasto et al. 1997). They have catalogued 220 superclusters using a friends-of-friends algorithm with a neighborhood radius of Mpc. We visually identified the most likely locations of filaments connecting galaxy clusters within superclusters and searched for UV-bright AGNs projected behind them, using the updated Véron-Cetty & Véron (2001) Catalog and at low Galactic as given by Schlegel, Finkbeiner, and Davis (1998). About ten objects satisfy our criteria and are bright enough to be observed by HST or FUSE and we have an observing program to obtain spectra of these targets. However, three targets have already been observed by FUSE and HST (PHL 1811, PG 1402+261 and TON S180), which we report upon here.
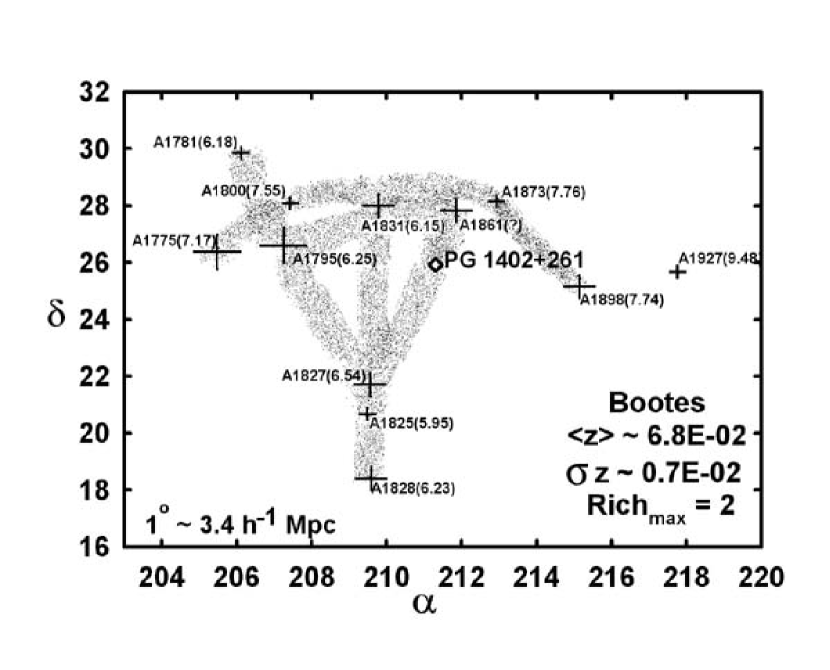
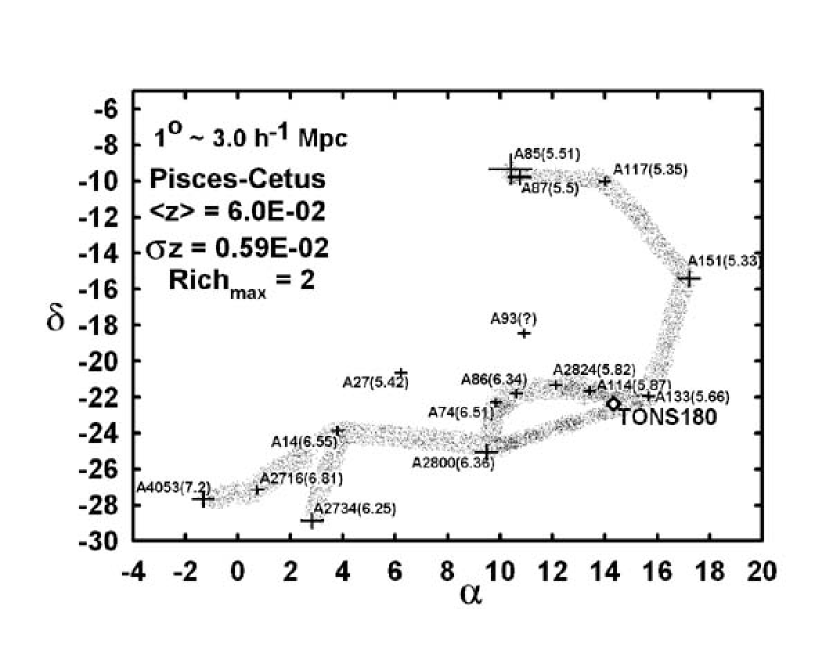
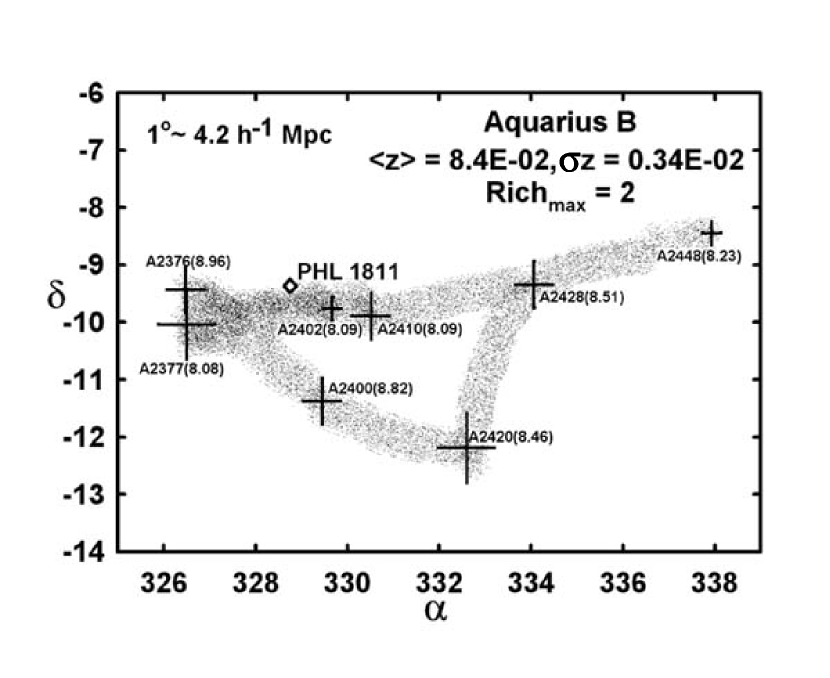
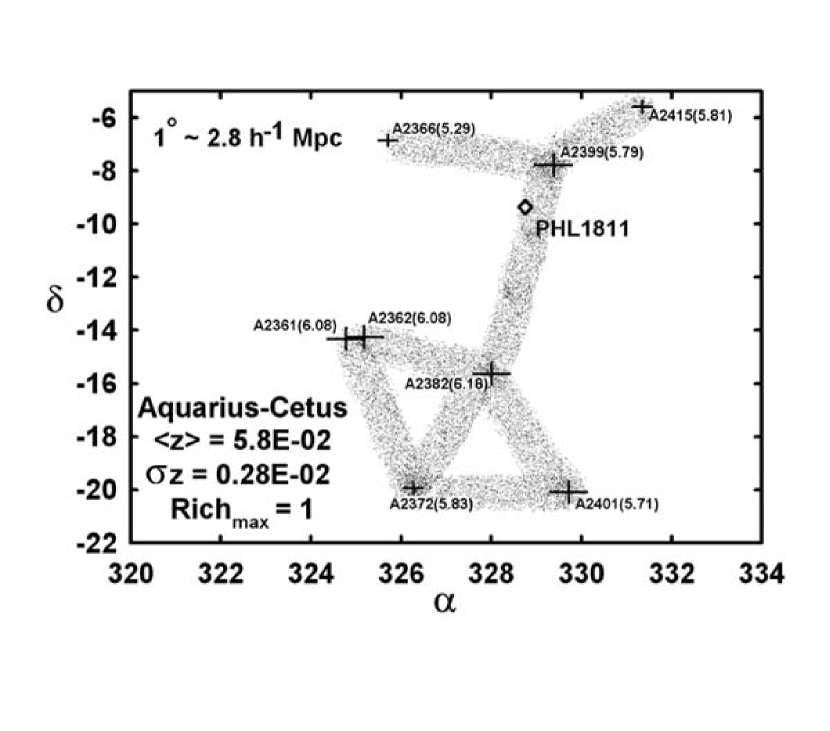
The locations of these three targets, relative to the foreground superclusters, are shown in Figure 1, where we indicate the position of clusters of galaxies and the size of the crosses represent the richness of the cluster as defined in Dekel & Ostriker (1999). The value for the cluster with maximum richness is given and the values for the other clusters can be estimated by the size of the crosses (in unit steps). Also shown are the AGNs (empty diamond) and the estimated 2-D location of the relevant filaments, where the thickness of the filaments is approximately Mpc. We eliminated misclassified clusters from the Einasto et al. (1997) catalog (those with velocities significantly different from the rest of the systems in the supercluster; they comprise less than 10% of the clusters). In Table 1 we list the name of the AGN, redshift, visual magnitude, the supercluster projected in the line-of-sight, its redshift, the full redshift range of the supercluster, the standard deviation of one galaxy cluster about the supercluster redshift, and the estimated projected distance from the AGN to the nearest candidate filament.
| Target Name | Supercluster Name | ||||||
|---|---|---|---|---|---|---|---|
| PG 1402+261 | 0.164 | 15.5 | Bootes | 0.070 | 0.0151 | 0.007 | 1 Mpc |
| Ton S180 | 0.062 | 14.4 | Pisces-Cetus | 0.060 | 0.0187 | 0.0059 | 3 Mpc |
| PHL 1811 | 0.192 | 13.9 | Aquarius-Cetus | 0.058 | 0.0089 | 0.0028 | 1.5 Mpc |
| PHL 1811 | 0.192 | 13.9 | Aquarius B | 0.084 | 0.0043 | 0.0034 | 2 Mpc |
The FUSE observations were reduced in-house with version 2.2.1 of the pipeline and reprocessed most recently with version 2.4 of CALFUSE, but there was no difference in the resulting spectra. For analysis purposes, the FUSE spectra were binned by a factor of 5 (0.034 Å width) and then smoothed with a seven point FFT filter, yielding a resolution of about 4,000 (we examined the spectra at full resolution as well before adopting this procedure). For the HST data, we used the standard data products provided by the MAST archive.
PG1402+261
This Seyfert 1 galaxy, at an emission line redshift of 0.164, lies behind the Bootes supercluster, which is composed of 11 galaxy clusters in a redshift range of 0.059-0.079 (there is an additional cluster at that could be considered an outlier; Figure 1a). This object lies at high Galactic latitude (), with a low extinction (; Schlegel et al. 1998) and a Galactic neutral hydrogen column of cm-2 (Lockman et al. 2002, Wakker et al. 2003). There are spectra available for the 900-1180 Å region (FUSE, a 8 ksec observation taken in June 2000, using the LWRS aperture) as well as for the 1200-1600 Å region (HST, with the G130H, G190H, and G270H on the FOS in August 1996), both of which have been discussed in the literature (Bechtold et al. 2002; Wakker et al. 2003).
The FUSE spectrum shows all the strong Galactic atomic lines, including the high ionization systems (O VI) and the low ionization systems (S III, Si II, C II, C III, O I, Ar I, Fe II, Fe III, and N I). These Galactic lines are blueshifted by about 40 km s-1, which is probably due to the target not being located in the center of the slit, but this shift has no impact on our analysis. There is very little molecular hydrogen evident, with an upper limit of about 1017.5 cm-2. In our analysis of the spectrum, we find no unidentified lines in the FUSE spectral range, aside from the expected number of 2–3 features. In the HST spectrum, obtained with the Faint Object Spectrograph, using the G130H spectral element (resolution of 1300, or 230 km s-1), there are a few unidentified lines, such as those noted by Bechtold et al. (2002) at 1383.11 Å and 1405.36 Å. These are most likely Ly absorption features at redshifts of 0.137 and 0.156, respectively.
In addition to the features cataloged by Bechtold et al. (2002), there is a weak feature at 1285.1 Å that does not correspond to any Galactic features. It is most likely a Ly absorption line at a redshift of 0.0571 and with an equivalent width of 150-200 mÅ and an uncertainty of about 50 mÅ (Figure 2). Confirmation of this feature through the detection of some other Lyman series lines is a commonly used tool when the wavelength coverage is broad. Unfortunately, nearly all of the strong lines lie in places in which it is difficult to detect a line uniquely. That is, the Ly line would lie at 1084.3 Å, but it would be confused with the strong Galactic N II 1084.0 line, so a unique idenfitication is not possible. Also, the feature does not fall in the Lif1a channel, but the Sic1a channel, where the S/N is significantly lower. We estimate that the 3 upper limit to the Ly line is about 0.25 Å, which is much larger than the expected value of 0.03 Å if Ly were optically thin. The Ly line would be at 1028.1 Å, in the shoulder of the Galactic Ly absorption line, but also coincident with an airglow line, that could fill in a weak absorption feature. The line is not detected, with a 3 upper limit of 0.1 Å, which is consistent with the predicted equivalent width of 0.01 Å if the Lyman lines are thin. The Ly line, at 1004.0 Å, is not detected but the 3 upper limit, 0.2 Å, is considerably larger than the expected line strength. We searched for several atomic lines but detected none (e.g., C III 977, C II 1036). For the low ionization lines, this is the expected result, as the Lyman lines are always stronger, but O VI can be stronger than the Lyman lines at high temperatures (5 K). The stronger O VI line (1031.9 Å) would fall at 1090.9 Å, and no line is seen, with a 3 upper limit of 0.1 Å equivalent width.

If the line at 1285.1 Å is a Ly absorption line at , it is close to the redshift of the supercluster. Of the clusters in the Bootes supercluster with known redshifts, the one closest to PG1402+261 is Abell 1831 (2.5∘ away, ), which has the smallest redshift difference with respect to the absorption system, a difference of 1300 km s-1, comparable to the velocity dispersion of the cluster. Consequently, it is possible that this absorption line system is associated with a supercluster filament that connects to Abell 1831, as it lies beyond the virial radius of the cluster (a radius of about 0.5∘). There are other galaxy clusters nearby, but they do not have measured redshifts, such as Abell 1861, which is closer on the sky to PG 1402+261 than Abell 1831. Two galaxy clusters lie within 1.5∘ of PG1402+261 and are presumably more distant than the Bootes cluster: Abell 1797 and Abell 1982. The redshifts of these should be measured in order to determine whether some of the other unidentified lines could be Ly absorption related to the clusters.
Ton S180
This Seyfert 1.2 galaxy lies near the South Galactic Pole (l, b = 139, -85), it has relatively little Galactic absorption (E(B-V) = 0.014), and it has a redshift of 0.06198. In projection, it lies behind the Pisces-Cetus supercluster, near two lines of clusters that connect to Abell 133 (; 82′ away). Along the more northern system are Abell 114 (; the closest cluster, 66′ away), Abell 2824 (; 136′ away), Abell 86 (; 209′ away), and Abell 74 (; 256′ away). Toward the south, Abell 133 may connect to Abell 2800 (; 311′ away; Figure 1b). If a filament connects these clusters both spatially and in velocity, then this Seyfert galaxy is about at the redshift of the filament, of which it may be part. Being part of a filament increases the likelihood that our line of sight toward it would pass through overdense regions, but it also makes it impossible to distinguish between absorption intrinsic to the AGN or host galaxy and absorption by the filament.
The FUSE data were obtained in December 1999, using the LWRS aperture, and with an exposure time of 132 ksec (Shull et al. 2000; Wakker et al. 2003). There were several ultraviolet spectra taken with STIS on HST, using the G140L (January 2000 observation for 1260 seconds) and using the G140M covering the 1194-1300 Å region (taken July 1999) and discussed by Shull et al. (2000), Turner et al. (2002), and Penton et al. (2004).
The system has the usual set of Galactic atomic absorption lines, including O VI (Wakker et al. 2003), but it has very little H2 ( cm-2). There are several low redshift Ly and Ly “forest” lines (Shull et al. 2000), but in addition, there are absorption features near not previously reported. At least three absorption features are seen in both of the O VI lines in the redshift range 0.0614 - 0.0625. These redshifts probably need a small correction upward by about 0.00018 since the Galactic atomic lines are shifted by that amount (e.g., the nearby Fe II line, and others), an effect that can occur if the object is not centered in the slit; the corrected redshifts are 0.0616, 0.0620, and 0.0625 (Figure 3). The system appears to be two lines that are blended together, but the S/N is insufficient to be certain. The other lines appear single and have the same line width, a FWHM of 15040 mÅ.

These absorption systems also appear in the STIS medium resolution spectrum of this object with a resolution of about 1000 (Turner et al. 2002), where three Ly absorption systems are seen at , 0.0620, and 0.0623, with equivalent widths of 80 mÅ, 30 mÅ, and 100 mÅ. If these lines are optically thin, the Ly lines would be 13 mÅ, 5 mÅ, and 16 mÅ, but the 1 uncertainty for a line in this part of the Lif2a spectrum is about 30 mÅ, so the failure to detect the Ly line is suggestive that the lines are of low optical depth. These Ly lines are similar to but not exactly at the same redshift, with differences up to 60 km s-1 for the highest and lowest redshift systems.
The origin of these four redshift systems is ambiguous because we cannot distinguish between absorption intrinsic to the Seyfert and hot material within a cosmological filament. If the absorption is associated with a filament from a cluster, the lines are 800-1050 km s-1 away from the redshift of the nearest cluster (Abell 114) and may be associated with this system (the line of sight passes about two virial radii from the cluster center). The properties of the absorption systems are consistent with a hot but quiescent medium. The equivalent widths of the O VI lines exceed that of the Ly lines, typically by factors of 2-3, which can occur in collisionally ionized gas in the 2–10 K range (Tripp and Savage 2000), the type of material predicted to lie in filaments. The line widths of the O VI lines are close to the thermal width of oxygen at 3 K (110 mÅ), so the gas does not lie in a turbulent medium, as the sound speed of a gas at this temperature is about 80 km s-1 and if the turbulent speed were equal to the sound speed, it would lead to a FWHM of 500 mÅ in all lines.
PHL 1811 (J2155-0922)
This narrow-line Seyfert 1 galaxy, at a redshift of 0.192, is a a very bright object, although at a galactic latitude of -44∘, there is more Galactic extinction along this line of sight, with E(B-V) = 0.046. It lies behind the Aquarius B supercluster as well as the Aquarius-Cetus supercluster, which are distinguished by their redshifts. In the Aquarius B supercluster, the cluster closest to PHL 1811 is Abell 2402 (50′; ), followed by Abell 2410 (109′; ), Abell 2376 (136′; ), Abell 2377 (139′; ), and Abell 2400 (126′; ). If filaments connect the clusters and pass in front of PHL 1811, the most natural connections would be between Abell 2376/2377 and Abell 2402/2410 (Figure 1c). It has been observed with HST on several occassions with STIS (with the G140L in December 2001, and in a current program with the E140M), and with FUSE (in June 2001, and for longer exposures in a current program).
This system has been studied exhaustively by Jenkins et al. (2003), where they combine FUSE and HST data, permitting them to determine the strength of many Galactic lines as well as intervening systems. Four intervening absorption line systems are identified at a redshift below 0.1, and they are at 0.07344, 0.07779, 0.07900, and 0.08093 (Figure 4; the highest redshift system is a Lyman limit system with 17.5 logN(HI) 19.5). Of these systems, they identify many Lyman lines and a few metal lines, including O VI in the and systems at or above the 3 level, several times weaker than Ly. Jenkins et al. (2003) argue that the Lyman limit system is associated with an L∗ galaxy that is 34 kpc from the line of sight and at the same redshift. The origin of the other absorption systems is less clear, as the velocity differences are great enough (580, 940, and 2250 km s-1) that the gas is unlikely to be gravitationally bound to the galaxy. They suggest that some of this absorbing material is due to tidal interactions between galaxies.

We have little to add to this analysis except to point out that it is possible that three systems are due to absorption within the supercluster. Aside from the strongest stystem at , the next two systems closest in redshift space are within 940 km s-1, while the most distant system is 2250 km s-1 away, which is still within the velocity range of a supercluster (or possibly even a cluster). The line of sight toward PHL 1811 is at least twice the virial radius from the nearest cluster (projected separation of 50′; the virial radius would be about 25′), so the absorbing material is not gravitationally bound to any of the clusters. Despite an extensive study by Jenkins et al., they do not identify any galaxies with redshifts that might be associated with these other redshift systems, nor are there tidal features evident with the Lyman limit galaxy.
Also, this line of sight passes through the Aquarius-Cetus supercluster and it lies closest to Abell 2399 (; 102′ away) and Abell 2366 (; 236′), with a few clusters to the south, such as Abell 2361 and Abell 2362 (), although these are more than 6∘ away (Figure 1d). Jenkins et al. (2003) report a Ly absorption line system at a redshift of 0.05119 (equivalent width of 0.600.05 Å), a redshift difference of 0.0067 (2000 km s-1) for Abell 2399 and 0.0017 (500 km s-1) for Abell 2366 (Figure 4). This is consistent with absorption by material in this second supercluster along the line of sight.
3 Summary and Concluding Remarks
We identified three bright AGNs that have been observed by FUSE and HST and lie near possible supercluster filaments. Absorption lines, most of which were reported previously, are found to exist at redshifts within about 1300 km sec-1 of the supercluster, often being closest in redshift to the nearest galaxy cluster. These coincidences between the supercluster redshifts (or the redshifts of the nearest clusters) and the absorption line systems are important only if they are statistically significant, so we need to calculate the probability that this has occurred by chance. The redshift frequency of Ly absorption lines was the topic of an HST Key project as well as more recent work (Dobrzycki et al. 2002 and references therein), where at low redshift, the frequency of Ly absorption lines with equivalent widths greater than 0.24 Å is dN/dz 28 (for EW 0.36 Å, dN/dz 15). We do not have Ly equivalent widths for all of the systems discussed above because in some, only Ly was detected without blending, as for the 0.077–0.081 absorption line systems in PHL1811. However, if the ratio of Ly/Ly is about 0.5, as found for other systems of similar equivalent widths (Shull et al. 2000), then the Ly equivalent widths are above the 0.24 Åthreshold (probably about 0.4 Å) and the sum of the three lines have an equivalent width of 1.73 Å, consistent with this estimation (Jenkins et al. 2003). For Ton S180, the absorption is due to O VI but it is challenging to detect Ly absorption as it would lie in the Ly emission line, but regardless of where one might choose a sensible continuum, there is no Ly absorption line with an equivalent width above 0.05 Å. However, as the O VI clearly shows evidence for absorption, we will consider the effect of including this system in the analysis. Finally, the absorption line from PG 1402+261 is slightly below the threshold, so we will consider the results of the analysis with and without this system.
The next issue is how one counts a system and over what velocity width. The most conservative approach is to count multiple absorption line systems as a single absorption system (i.e., the 0.077-0.081 systems in PHL1811 and the 0.0616 - 0.0630 systems in Ton S180) even though the determination for dN/dz includes all redshift systems. The absorption line systems discussed above fall within 1300 km s-1 ( 0.0043 in redshift space) of the expected redshift of the filament or nearby cluster, so we should expect 0.24 absorption systems per supercluster. If we use only PHL 1811, there are absorption systems associated with two superclusters (excluding the system and counting the systems at and 0.07900 as a single system), which should occur by chance 4.6% of the time (for dN/dz 28). Using the rate for absorption system equivalent widths above 0.36 Å (appropriate for these absorption systems; dN/dz 15), the chance probability is 1.5%. If we include the absorption system from PG1402+261, the probability of this occurring by chance falls to 1.4% (for dN/dz 28; if we were to include the O VI absorption from Ton S180 as a single system, the chance probability would become 0.3%).
When we include all of the absorption systems separately, the association between superclusters and absorption features becomes more likely, as there would be three absorption systems in the redshift range 0.077-0.081 in PHL1811 and three in the redshift range 0.0616 - 0.0630 in Ton S180. Excluding Ton S180, the probability that the association with the superclusters occurred by chance is 9 (1.1 excluding the system), and when Ton S180 is included, the probability becomes 1.7 (2.2 excluding the z = 0.08093 system).
It is difficult at this point to demonstrate that the absorption is associated with regions of mild overdensities (filaments) rather than material that has been ejected or torn away from a galaxy. One would need to be able to determine if absorbing material is gravitationally bound to the galaxy, which would involve assuming a model for the galaxy as well as for the transverse velocity of the absorbing gas relative to the galaxy. Also, the distinction between these two associations may be unimportant, as material expelled in a galactic wind is unbound to that galaxy and becomes part of the filament once it mixes with this surrounding medium.
An alternative approach to looking for evidence of absorption from galaxy clusters and superclusters is to choose bright but randomly located AGNs and identify the absorption sites by obtaining imaging and spectroscopy of nearby objects. Along these lines, Penton, Stocke, and Shull (2002) found that about 22% of absorbers are not associated with galaxies (also, McLin et al. 2002). They find support that absorption line systems align with large-scale filaments of galaxies, which may be similar in nature to the filaments that we have tried to probe.
The association of absorption systems with supercluster filaments or galaxy clusters may seem surprising since a dedicated search to find absorbing gas in galaxy clusters failed to produce detections (Miller, Bregman, and Knezek 2002). However, that study was sensitive only to low ionization metal lines, not to the more common Ly absorption line systems (or to O VI). Given the results here, a search to identify Ly systems around galaxy clusters would be worthwhile.
The relationship between superclusters and Ly absorption systems is enticing, but it is based on the study of just three systems, and it should be possible to improve the statistical situation quite readily. In the near future, we will be investigating several other low redshift superclusters (z 0.12) to search for Ly absorption systems. Another observation that is badly needed is to obtain redshifts for the clusters that are near the lines of sight. We hope that studies such as those will lead to a deeper understanding of whether modest overdensity cosmological filaments can be identified through Ly absorption line studies.
After this paper was submitted, it was pointed out to us that there is evidence of a Ly absorber associated with the supercluster recently discovered from the ROSAT North Ecliptic Pole Survey (NEP). The NEP supercluster (Mullis et al. 2001) is at an average redshift of 0.087 and is X-ray selected. It subtends a large angular region, where about 200 AGNs are found. One of them is bright enough for absorption line studies and was previously observed by HST, H1821+643 (NEP5340). Spectral analyses of H1821+643 (z=0.297) revealed the presence of a Ly system at (Tripp, Lu & Savage 1998). The nearest galaxy cluster is at a projected distance of 18 h-1 Mpc, well beyond the virial radius; no galaxy is identified near the absorption site. These observations are consistent with the absorber being associated with diffuse gas connecting the NEP clusters. As our selection criteria did not include this supercluster, we do not include it in our statistical analysis, but it supports our findings for the other superclusters.
We would like to acknowledge support for this work from NASA grants NAG5-10765 and NAG5-10806, which support research on archival data analysis. Also, we would like to thank B-G Andersen, Ken Sembach, Bart Wakker, Jimmy Irwin, Chris Mullis, and Edward Lloyd-Davies for their advice and encouragement.
References
- Bechtold et al. (2002) Bechtold, J., Dobrzycki, A., Wilden, B., Morita, M., Scott, J., Dobrzycka, D., Tran, K.-V, & Aldcroft, T.L. 2002, ApJS, 140, 143
- Cen et al. (1995) Cen, R., Kang, H., Ostriker, J.P., & Ryu, D. 1995, ApJ, 451, 436
- Cen & Ostriker (1999a) Cen, R., & Ostriker, J.P. 1999a, ApJ, 514, 1
- Cen & Ostriker (1999b) Cen, R., & Ostriker, J.P. 1999b, ApJ, 519, L109
- Cen et al. (2001) Cen, R., Tripp, T.M., Ostriker, J.P., & Jenkins, E.B. 2001, ApJ, 559, L5
- Davé et al. (2001) Davé, R., Cen, R., Ostriker, J.P., Bryan, G.L., Hernquist, L., Katz, N., Weinberg, D.H., Norman, M.L., & O’Shea, B. 2001, ApJ, 552, 473
- Dekel & Ostriker (1999) Dekel, A., & Ostriker, J.P. 1999 Formation of Structure in the Universe (Cambridge: Cambridge Univ. Press)
- Dobrzycki et al. (2002) Dobrzycki, A., Bechtold, J., Scott, J., & Morita, M. 2002, ApJ, 571, 654
- Einasto et al. (1997) Einasto, M., Tago, E., Jaaniste, J., Einasto. J., & Andernach, H. 1997, A&AS, 123, 119
- Evrard et al. (2002) Evrard, A.E., et al. 2002, ApJ, 573, 7
- Francis et al. (1991) Francis, P. J., Hewett, P. C., Foltz, C. B., Chaffee, F. H., Weymann, R. J., & Morris, S. L. 1991, ApJ, 373, 465
- Fukugita, Hogan & Peebles (1998) Fukugita, M, Hogan, C.J., & Peebles, P.J.E. 1998, ApJ, 503, 518
- Hellsten et al. (1998) Hellsten, U., Gnedin, N.Y., & Miralda-Escudé, J. 1998, ApJ, 509, 56
- Jenkins et al. (2003) Jenkins, E.B., Bowen, D.V., Tripp, T.M., Sembach, K.R., Leighly, K.M., Halpern, J.P., & Lauroesch, J.T. 2003, AJ, 125, 2824
- Lockman et al. (2002) Lockman, F.J., Murphy, E.M., Petty-Powell, S., & Urick, V.J. 2002, ApJS, 140, 331
- McLin et al. (2002) McLin, K.M., Stocke, J.T., Weymann, R.J., Penton, S.V., & Shull, J.M. 2002, ApJ, 574, L115
- Miller, Bregman & Knezek (2002) Miller, E.D., Bregman, J.N., & Knezek, P.M. 2002, ApJ, 569, 134
- Mullis et al. (2001) Mullis, C.R. et al. 2001, ApJ, 553, L115
- Penton, Stocke & Shull (2002) Penton, S.V., Stocke, J.T., & Shull, J.M. 2002, ApJ, 565, 720
- Penton, Stocke & Shull (2004) Penton, S.V., Stocke, J.T., & Shull, J.M. 2004, ApJS, 152, 29
- Savage et al. (2002) Savage, B.D., Sembach, K.R., Tripp, T.M., & Richter, P. 2002 ApJ, 564, 631
- Schlegel, Finkbeiner & Davis (1998) Schlegel, D.J., Finkbeiner, D.P., & Davis, M 1998, ApJ, 500, 525
- Shull et al. (2000) Shull, J.M., et al. 2000, ApJ, 538, L13
- Tripp & Savage (2000) Tripp, T.M., & Savage, B.D. 2000, ApJ, 542, 42
- Turner et al. (2002) Turner, T.J., et al. 2002, ApJ, 568, 120
- Véron-Cetty & Véron (2001) Véron-Cetty, M.-P., & Véron, P. 2001, Catalogue of Quasars and Active Nuclei (10th ed.; Garching: ESO)
- Wakker et al. (2003) Wakker, B.P., et al. 2003, ApJS, 146, 1