The Orbit and Albedo of Transneptunian Binary (58534) 1997 CQ29.
Abstract
We have measured the separations and position angles of the two components of the binary transneptunian object (58534) 1997 CQ29 at eight epochs. From these data we are able to constrain the orbit and mass of this binary system. The best fitting orbit has an orbital period of = 3123 days. The orbital eccentricity is = 0.450.03 and the semimajor axis is = 8,01080 km. The mass of the system is surprisingly low at 0.420.02 kg. To account for the observed brightness consistent with the low mass and a range of plausible densities, the geometric albedo must be very high; for an assumed density of 1000 kg m-3 we find a red geometric albedo of = 0.37, an order of magnitude higher than has been generally assumed for transneptunian objects. If objects with comparably high albedos are common in the Kuiper belt, estimates of the mass of the belt must be significantly reduced. The semimajor axis of (58534) 1997 CQ29’s orbit is 2.8% of the Hill radius of the primary, a value strikingly similar to this same ratio in other transneptunian binaries, main-belt binaries, and regular satellite systems.
keywords:
Kuiper Belt, Oort cloud1 Introduction
(58534) 1997 CQ29 is one of fourteen known transneptunian binaries (TNBs) (Noll 2003). In addition to (58534) 1997 CQ29, three others of these fourteen have orbits that have been determined sufficiently to derive masses, 1998 WW31, 2001 QT297, and (66652) 1999 RZ253 (Veillet et al. 2002; Osip et al. 2003; Noll et al. 2004). The opportunity to directly measure the mass makes TNBs among the most attractive objects for study among the 1000 known transneptunian objects (TNOs).
(58534) 1997 CQ29 was discovered at the Canada-France-Hawaii Telescope (Chen et al. 1997) and was found to be a binary object from observations made with the Hubble Space Telescope in November 2001 (Noll and Stephens 2002). Follow-up observations made in June and July 2002 showed a wider separation than at initial discovery and a very small rate of angular motion. Our initial conclusions were that an eccentric orbit was likely (Noll et al. 2002). With additional epochs we are now able to determine an orbit for this binary system yielding a direct measurement of its mass. Photometry of the individual components can be used to constrain the relative masses and radii of the components. Albedo as a function of density is also constrained. In this work we detail our observations and explore the physical implications of the mass determined for this binary system.
2 Observations
We have been able to constrain the orbit of (58534) 1997 CQ29 by combining data obtained with the Hubble Space Telescope (HST) and with the Magellan Project Baade and Clay 6.5m telescopes. The observations are summarized in Table 1 and described in detail separately below.
2.1 HST
HST observations were obtained using the Wide Field Planetary Camera 2 (WFPC2) and Near Infrared Camera Multi-Object Spectrograph (NICMOS) in three separate observing programs. All observations employed moving target tracking with HST to follow the apparent motion of (58534) 1997 CQ29.
The observations made with the WFPC2 camera on four separate dates have been described in detail by Noll et al. (2002). The first epoch of WFPC2 observation was obtained in the WF3 detector with 0.″1 pixels; the remaining pointings centered (58534) 1997 CQ29 on the higher spatial resolution, 0.″045-per-pixel PC detector. Three different filters were used in the WF3 observations, the F555W, F675W, and F814W; only the F814W was used with the PC. Two or more undithered exposures were recorded in each filter to facilitate the removal of cosmic rays.
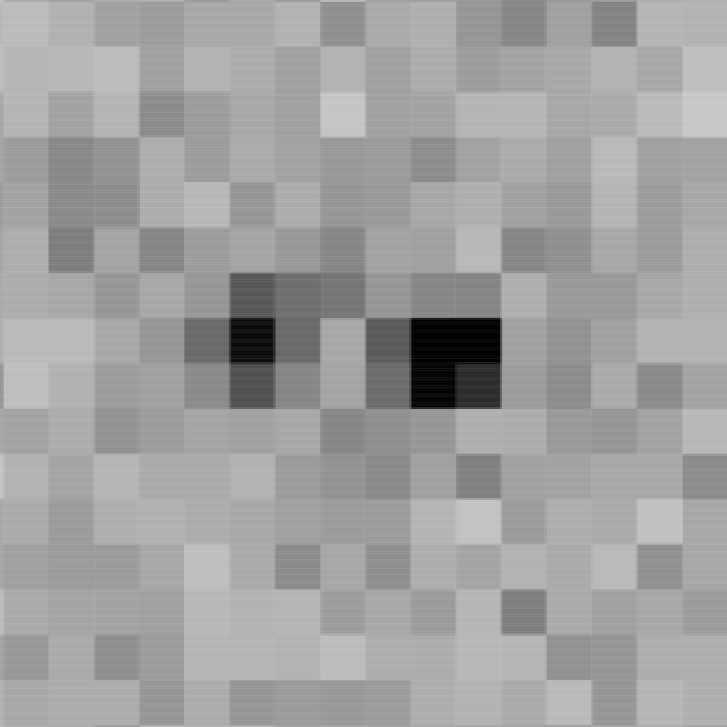
Three additional observations of (58534) 1997 CQ29 have been made using HST’s Near Infrared Camera and Multi-Object Spectrometer (NICMOS) on 8 May and 16 May 1998 and 23 April 2003. The May 1998 data were exposed as target location images for attempted grism spectroscopy of several bright TNOs (Kern et al. 1999). On each date three 32 second exposures of the target using the STEP32 multiaccum sequence were obtained at dithered positions in the NIC3 camera with the F150W filter in place. These relatively short exposures yielded low S/N images of (58534) 1997 CQ29. We were able to reliably detect the secondary only on 16 May 1998, as indicated in Table 1. The April 2003 observation of (58534) 1997 CQ29 consisted of four exposures, two each in the F110W and F160W filters (Fig. 1). Exposures were 256 sec and 512 sec in the two filters at each of two dithered positions on the detector. A STEP256 sample sequence was used with 11 and 12 samples respectively. HST tracked the apparent motion of the binary during all NICMOS (and WFPC2) observations and, importantly, simultaneously corrected for the parallax induced by the telescope’s orbital motion. These data yielded high S/N detections of both components of the binary system. NICMOS data were reduced using the standard on-the-fly pipeline reduction with the most up-to-date dark and flat reference files.
2.2 Magellan
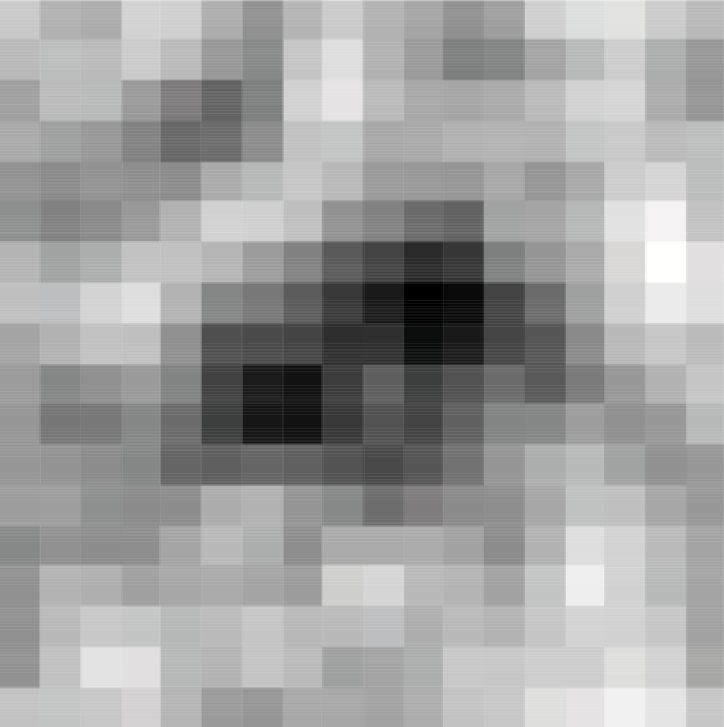
Magellan data were obtained with the Raymond and Beverly Sackler Magellan Instant Camera (MagIC) on eight separate nights in 2002-2004. Of these, we have considered three epochs not already sampled by high quality HST observations, UT 28-29 January 2003, 15 December 2003, and 08-09 March 2004 which offer the best combination of optimal observing conditions and potential to add unique constraints to the orbit (Fig. 2). Other dates either overlapped in time with HST observations or were obtained on nights with poor seeing.
MagIC is a cryogenic CCD camera with a 2k2k SITe detector. Permanently mounted at a folded port of the Magellan project Clay 6.5m telescope, MagIC provides a pixel scale of 0.″069. All observations reported here were obtained with the Sloan filter in place. Standard overscan subtraction and flat fielding were applied to all frames.
On each date two series of at least three separate 150-300 second exposures were obtained. During the integration, the pointing was fixed (sidereal tracking) so that (58534) 1997 CQ29 moved. In January 2003 during 300 second exposures, the target moved 0.″195 at a position angle of 294.7 degrees. In December 2003, 300 second exposures correspond to only 0.″07 of sky motion for the target. Finally, in March 2004, shorter integrations of 150 seconds resulted in target image motion of 0.″127 at a position angle of 293.1 degrees. This motion further complicates accurate measurement of the separation of the two components.
3 Analysis
3.1 HST astrometry
In order to obtain the most accurate positional information from our images, we applied a detailed point-spread-function (PSF) fitting routine to each of the individual images. Model PSFs were generated using the TinyTim software package (Krist and Hook 2003). Following the method described in Noll et al. (2002) we iteratively scaled and shifted synthetic PSF pairs, subtracted from the image, and computed residuals. Models with the smallest residuals were used to calculate the most likely separation and position angle for the two components. Errors in centroiding each component are typically of order 0.1 pixel. The uncertainty in separation and position angle is then calculated directly from the combined centroiding uncertainties of each component. Results are listed in Table 1.
The positional information derived from our images are the raw data that we employed in fitting orbits. In an ideal case where there are high quality astrometric measurements at several points along an orbit, including measurements near pericenter and apocenter, orbit analysis can result in a precise determination of the system mass. The measurements of (58534) 1997 CQ29 are, however, far from ideal. All but one epoch of our high precision HST data are clustered near position angles of 340 degrees. The sparseness of the sampling (Table 1, Fig. 2) limits our ability to determine the orbit and the mass with the HST data alone. The HST data robustly determine the orbital period but do not fully constrain the remaining orbital elements. To break this impasse, we sought additional constraints from ground-based observations.
3.2 Magellan astrometry
(58534) 1997 CQ29 was observed at Magellan as part of an ongoing program of TNO observations that resulted in the discovery and characterization of 2001 QT297 (Osip et al. 2003). Because the ground-based data are considerably lower in resolution than HST data, we chose to include only two epochs in our analysis based on their ability to add constructively to our orbit fitting.
Seeing on the nights of UT 28 January 2003, 15 December 2003, and 09 March 2004 was 0.″65, 0.″55, and 0.″30 respectively. Because of the small 0.″069 pixels, the point-spread-function (PSF) is oversampled in all images. While this leads to a reduction in the signal-to-noise per pixel for any given source, it is ideal for identifying partially resolved binaries through comparison of the TNO PSF with stellar PSFs in the same frame.
A 2-D truncated Gaussian is fit to the images of stars to determine the best-fit FWHM of the PSF for each image. This PSF is then compared to the image of the binary. The images of the binary on the night of 09 March 2004 show two clearly resolved peaks (Fig. 2). The separation is measured by fitting PSFs to each peak. The data from 28 January 2003 do not resolve the binary components, but do indicate elongation of the stellar PSF corresponding to the target motion vector. For a two-component model with a magnitude difference consistent with that observed at other epochs we can place an upper limit on the separation at 0.″3, or slightly less than half the FWHM of the seeing on that night. Data from 15 December 2003 suffer contamination by a similar magnitude background object within 0.″5 - 0.″7. Nevertheless, adopting a two-component model, these data do constrain the separation of the primary and secondary components to be no greater than 0.″3.
3.3 Orbit Fitting
Orbit fitting was accomplished by iteratively minimizing differences between observed and model sky-plane offsets between primary and secondary, projected for the time of each observation. This procedure has the advantage of properly accounting for the time variable projection of the orbit as seen from Earth. The parallax motion of the Earth and the seasonally changing aspect of the TNB’s orbit both produce appreciable variations in the projected shape of the orbit. With our observations spread over several years, it was essential to include these effects.
Two separate solutions to the orbit are found, each comprising equally good fits to the observed data. The orbital elements of both possible solutions are listed in Table 2. The orbits differ primarily in the orientation of the orbit plane and in the timing of mutual events but are otherwise very similar. We have plotted the solution with the lower in Fig. 3, though we note that the difference is insignificant.
Because of the sparseness of the sampling and the clustering of the highest quality data at a position angle near 340 degrees, the orbit is dependent on the lowest quality data points we have included in the fit, the upper limits from 28 January and 15 December 2003. As described above, we have attempted to apply conservative criteria to determining this upper limit in order to insulate the orbit fit from an error in this single datum. It is worth noting that even for one-sigma upper limits to the separation as high as 0.″5, the orbit fit remains essentially unchanged, although with greater uncertainties in the orbit parameters. Apparently, even very weak, fractional-sigma constraints are all that are needed to collapse the uncertainties in the orbit fits. It is also possible to consider the extreme case where we simply eliminate the upper-limit points from our fits. In that case the orbit fitting routine again finds essentially the same orbit as above, but with uncertainties large enough that the eccentricity and semi-major axis of the orbit become indeterminate, though the orbit period remains well-determined. A single orbit fit is replaced by a family of orbits with fixed that are able to equally-well fit the remaining data. The constrained orbit we find when using all the data is near the low-mass, low-eccentricity, high probability end of this family of possible orbits. Higher masses correspond to increasingly unlikely orbits having high eccentricity and an orbit plane inclination approaching an edge-on view. Further observation, particularly at times when position angles are away from our cluster of data at 340 degrees, will be able to confirm the validity of our derived orbit.
3.4 Photometry
Photometry of the individual components was performed using the same PSF-fitting technique used to determine relative positions. The optimally-scaled PSF is used to determine the flux including appropriate corrections for finite aperture size. We have corrected photometry for phase angle effects using a phase function of 0.15 mags/deg at all wavelengths (Sheppard and Jewitt 2002). Measured photometry is listed in Table 3.
Photometric data from five filters can be combined to produce a low resolution optical-near-infrared spectrum as we have done in Fig. 4. As is typical for TNO albedo spectra (e.g. Noll et al. 2000, McBride et al. 2003) there is a red slope from the optical to approximately 1 micron after which the slope flattens. The spectral slope in the optical has been observed to be highly correlated independent of filter over a range from B through I (430-800 nm; Jewitt and Luu 2001). The spectral gradient, , defined as the fractional change in reflectance per 100 (Boehnhardt et al. 2001) is and for components A and B respectively measured over the range from F555W to F814W which approximates V and I. This falls in the mid-range of V-I gradients we have measured for 41 non-resonant TNOs (Stephens et al. 2003). The gradients we measure for the individual components are marginally within the error of the V-I gradient for the combined pair, , measured from the ground (Boehnhardt et al. 2001).
Variability is an important issue that must be addressed when combining photometric data from different epochs. TNOs are known to have intrinsic lightcurves, some with significant amplitudes (need a reference and quantitative number). As listed in Table 1, the data obtained with HST at multiple epochs is ill-suited for an evaluation of possible lightcurve variations. The F814W filter is the only one used on multiple dates, a total of four different epochs. As noted in detail in Noll et al. (2002), there is evidence for possible large amplitude variations in component A (normally the brighter of the pair) with variations in the I band of as much as a magnitude. However, with limited sampling, this observation remains unverified. Ground-based observations of the lightcurve of this object could resolve the question of whether large albedo or shape asymmetries exist on either or both of the components of this binary.
3.5 Mass, Density, and Albedo
Once the orbit is sufficiently well determined that an orbital period and semimajor axis can be determined, it is possible to retrieve the total mass of the system using Kepler’s third law: . Both orbit solutions result in a system mass of 0.42. This mass is notable in that it is an order of magnitude lower than the system masses of the three other binary TNOs that have been measured so far.
It is possible to use measured photometry to determine the relative size and mass of the components of (58534) 1997 CQ29. The mass ratio is given by conditioned by the assumption that both components have the same albedo in the relevant photometric band. We computed this ratio from a weighted average of the flux ratios measured in the F555W, F675W, and F814W filters with WFPC2 and the F110W and F160W filters with NICMOS. Individual masses can be calculated using this ratio and the derived system mass. We find and . Similarly, the ratio of radii is . If we assume a bulk density, it is possible to derive radii from the masses of the components. For we find and . For different assumed densities the derived radii scale by a factor of .
A direct consequence of the low system mass is the conclusion that (58534) 1997 CQ29 must have a high albedo for any plausible assumed density. As shown in Fig. 5, even at an extremely low density of we find a red albedo of that is nearly six times higher than has typically been assumed for TNOs.
4 Discussion
4.1 High Albedos and the Mass of the Kuiper Belt
As is the case for a single object of measured flux and unknown mass, the mass of the Kuiper Belt as a whole is proportional to the assumed albedo to the minus three halves power, independent of assumptions about the size distribution. Typically, estimates of the mass of the belt as a whole have relied on the assumption that = 0.04. If the average albedo is five times higher, = 0.2, the mass calculation overestimates the mass of the belt by more than an order of magnitude. For example, Bernstein et al. (2004) estimate the total mass of the non-resonant, non-scattered population of the Kuiper belt to be 0.010 M⊕ using the standard albedo assumption and their latest estimate of the size distribution. This already low mass estimate could be significantly too large if the average albedo of TNOs is greater than the standard =0.04. Unless the density of (58534) 1997 CQ29 is far lower than any other solar system object known, it indicates that at least some objects in the Kuiper belt have significantly higher albedos. Observations of a significant number of objects at thermal wavelengths using the Spitzer Space Telescope will constrain this important physical parameter.
4.2 The Problem of Orbit Sampling
The period, , is generally relatively easy to determine, given observations spanning a substantial fraction, or more, of an orbital period. The determination of , however, can be more problematic, particularly in cases where the orbit is highly eccentric and/or the normal to the orbit plane is highly inclined. In these situations the simple strategy of observing at apocenter and pericenter to directly determine the quantity may be impractical or impossible and, in any case, requires knowledge of the orbit plane orientation. For sparsely sampled orbits, the uncertainty in the orbital eccentricity, , is also a significant barrier to uniquely determining . Our analysis of the orbit of (58534) 1997 CQ29 provides a clear example of the difficulties involved. Determination of other TNB orbits will inevitably face similar complications.
4.3 Eccentricity and the Origin of Binaries
There is growing evidence that high eccentricity is a common property of TNBs. At the present time, four TNBs (excluding Pluto/Charon which has been circularized due to tidal interactions) have orbits sufficiently well-determined that their eccentricity is constrained. The first TNB to have its orbit measured, 1998 WW31, has an eccentricity of = 0.82 0.05 (Veillet et al. 2002). Osip et al. (2003) have determined that 2001 QT297 has an eccentricity of = 0.250.1. We have recently measured the orbit of (66652) 1999 RZ253 and find an eccentricity of = 0.460.01 (Noll et al. 2004). Adding (58534) 1997 CQ29 to the mix, with = 0.450.03 appears to indicate that moderately high eccentricity may be the norm for TNBs, though extremely high eccentricities are not. This result suggests that the formation of binaries through the exchange reaction mechanism proposed by Funato et al. (2004), which results almost exclusively in eccentricities 0.8 is not the primary mechanism for the formation of TNBs. However, the continuing uncertainty in the formation of stellar binaries (e.g. Mathieu 1994), despite more than 200 years of study, is a sobering reminder of the difficulty of making genetic inferences from orbital data alone.
4.4 Transneptunian Binaries and the Hill Radius
The radius of the Hill sphere, , in a three-body system is given by the equation where is the semimajor axis of the primary’s heliocentric orbit. Orbits within the Hill sphere are stable relative to the Sun, though perturbations from a fourth body (e.g. Neptune in the case of TNOs) can alter the zone of stability. For binary systems where the mass is known, it is possible to compute the separation of binary components in terms of the Hill radius. The size of the Hill radius is 7000 times the radius of the largest component of the binary in the four TNBs with measured mass. The derived orbits of these systems have semimajor axes that are 0.8% to 6% of the Hill radius (Table 4). Pluto has a similarly large Hill radius, but differs in that Charon orbits at only 0.25% of this distance. TNBs with comparably tight orbits may exist but be undetected with current searches. Indeed, the large amplitude lightcurve of 2001 QG298 may be the first recognized contact binary in the Kuiper Belt and suggests that 10% to 20% of the transneptunian population may consist of similarly close pairs (Sheppard and Jewitt 2004).
The majority of known binaries in the main asteroid belt orbit much closer to their primaries in terms of absolute distance and also in terms of the semimajor axis relative to the size of the primary, (Merline et al. 2003) than known TNBs. This is partially due to observational selection effects limiting the discovery of close TNBs. However, it is interesting to note that, in terms of the Hill radius, the semimajor axes of main-belt asteroids are quite comparable to TNBs, falling in a range of one to a few percent (Table 4).
We can also compare TNBs to planetary satellite systems. The four Galilean satellites orbit in a range from 0.7% to 3% of Jupiter’s Hill sphere radius while the most distant satellites, the retrograde irregulars, orbit at nearly half the Hill radius (Sheppard and Jewitt 2003). In terms of their separations in units of the Hill radius, TNBs as well as main-belt binaries are more similar to regular satellites systems than to the irregular captured objects. The significance of this similarity awaits a comprehensive theory of planetesimal binary formation in the early solar system.
5 Conclusions
The orbit of the (58534) 1997 CQ29 binary system has been determined with a combination of data from the Hubble Space Telescope and the Magellan Observatory. The derived orbital parameters reveal a system of nearly equal-sized bodies in a moderately eccentric orbit. The mass derived from the orbit is an order of magnitude lower than the three other TNBs that have been measured to date, and is only 1/35,000 of the mass of the Pluto/Charon system. With probable diameters of less than 80 km, the components of (58534) 1997 CQ29 are approaching the size range of the largest cometary nuclei. For any reasonable assumed density, these objects must be remarkably reflective with red albedos greater than 20%. If objects this reflective are common in the Kuiper belt, current mass estimates may be too high by as much as an order of magnitude. The separations of transneptunian binaries in terms of the Hill radius are comparable to the separations of main belt binaries suggesting possible parallels in their formation.
Acknowledgements.
Based on observations made with the NASA/ESA Hubble Space Telescope. These observations are associated with programs # 9060 and # 9386. Support for programs # 9060 and # 9386 was provided by NASA through a grant from the Space Telescope Science Institute, which is operated by the Association of Universities for Research in Astronomy, Inc., under NASA contract NAS 5-26555. References Bernstein, G. M., Trilling, D. E., Allen, R. L., Brown, M. E., Holman, M., Malhotra, R. 2003 astro-ph/0308467 Boehnhardt, H., Tozzi, G. P., Birkle, K., Hainaut, O., Sekiguchi, T., Vair, M., Watanabe, J., Rupprecht, G., the FORS Instrument Team 2001, Astron. & Astrophys. 378, 653-667 Chen, J., Trujillo, C., Luu, J., Jewitt, D., Kavelaars, J. J., Gladman, B., Brown, W. 1997, MPEC 1997-J02 Funato, Y., Makino, J., Hut, P., Kokubo, E., Kinoshita, D. 2004, Nature 427, 518-520 Kern, S., McCarthy, D., Campins, H., Brown, R. H., Rieke, M., Stolovy, S. 1999, DPS 31.15.03 (abstract) Krist, J. E., Hook, R. 2003, The TinyTim User’s Guide, v.6.1, Space Telescope Science Institute, Baltimore Mathieu, R. D. 1994, Ann. Rev. Astron. Astophys. 32, 465-530 McBride, N., Green, S. F., Davies, J. K., Tholen, D. J., Sheppard, S. S., Whitely, R. J., Hillier, J. K. 2003, Icarus 161, 501-510 Merline, W. J., Weidenschilling, S. J., Durda, D. D., Margot, J-L., Pravec, P., Storrs, A. D. 2002, in Asteroids, eds. W. F. Bottke, A. Cellino, P. Paolicchi, R. P. Binzel, University of Arizona Press, Tucson, pp. 289-312 Noll, K. S., Luu, J., Gilmore, D. M., 2000, AJ 119, 970-976. Noll, K., Stephens, D. 2002, IAUC 7824 Noll, K., Stephens, D., Grundy, W., Millis, R., Buie, M., Spencer, J., Tegler, S., Romanishin, W., & Cruikshank, D. 2002, AJ 124, 3424-3429 Noll, K. S. 2003, Earth, Moon, & Planets 92, 395-407 Noll, K. S., Stephens, D. C., Grundy, W. M., Griffin, I. 2004, Icarus, in press Osip, D. J., Kern, S. D., Eliot, J. L. 2003, Earth, Moon, & Planets 92, 409-421 Sheppard, S. S., Jewitt, D. C. 2002, AJ 124, 1757-1775 Sheppard, S. S., Jewitt, D. C. 2003, Nature 423, 261-263 Sheppard, S. S., Jewitt, D. C. 2004, AJ 127, 3023-3033 Stephens, D. C., Noll, K. S., Grundy, W. M., Millis, R. L., Spencer, J., Buie, M., Tegler, S. C., Romanishin, W., Cruikshank, D. P. 2003, Earth, Moon, & Planets 92, 251-260 Veillet, C., Parker, J. W., Griffin, I., Marsden, B., Doressoundiram, A., Buie, M., Tholen, D. J., Connelley, M., Holman, M. J. 2002, Nature 416, 711-713
|
|||||||||||||||||||||||||||||||||||||||||||||||||||||||||||||||||||||||||||||||||||||||||||||||||||||||||||
|
|||||||||||||||||||||||||||||||||||||||||||||||
|
||||||||||||||||||||||||||||||||||||||||||||||||||||||||||||||||||||||||
|
|||||||||||||||||||||||||||||||||||||||||||||||||||||||||||||||||||||||||||||||||||||||||||||||||||||||||||