The discovery of hard X–ray emission in the persistent
flux of the Rapid Burster
We report the first detection with INTEGRAL of persistent hard X–ray emission (20 to 100 keV) from the Rapid Burster (MXB 1730–335), and describe its full spectrum from 3 to 100 keV. The source was detected on February/March 2003 during one of its recurrent outbursts. The source was clearly detected with a high signal to noise ratio during the single pointings and is well distinguished from the neighboring source GX 354–0. The 3 – 100 keV X–ray spectrum of the persistent emission is well described by a two-component model consisting of a blackbody plus a power-law with photon index 2.4. The estimated luminosity was erg in the 3 – 20 keV energy band and erg in the 20 – 100 keV energy range, for a distance of 8 kpc.
Key Words.:
stars: individual: MXB 1730–335 -stars: neutron - X–ray: bursts: general - X–rays: stars1 Introduction
The Rapid Burster (MXB 1730–335, hereafter RB) is a low mass X–ray binary system (LMXB) located in the globular cluster Liller 1 at a distance of 8 kpc Ortolani et al. (1996) in the Galactic plane (Lewin et al. 1995, for a review). Unique in the Galaxy, the RB is the only LMXB known to produce both type I and type II X–ray bursts. Type I bursts are characteristic of LMXBs hosting a low magnetic field neutron star (NS) and are known to be the result of explosive thermonuclear burning of accreted material on the surface of the NS. Type II bursts likely arise from the release of gravitational potential energy during sudden brief periods of higher accretion rate believed to be caused by a recurring accretion instability (e.g. Lewin et al. 1995). The RB is a recurring transient with outbursts which last for a few weeks followed by quiescent intervals. These intervals lasted for 200 days until 1999, but have shrinked to days since 2000 (Masetti 2002).
One of the major problems in studying the persistent emission from this source is its proximity (0.5∘ apart) to the bright and variable LMXB 4U 1728–34 (GX354–0). As a consequence, it has never been possible to determine the persistent emission from the RB in the hard X–ray energy range, due to the low angular resolution of the collimator detectors used so far. Among the most recent results on the RB, we wish to mention those obtained with the Proportional Counter Array (PCA) aboard the Rossi X–ray Timing Explorer (RXTE) satellite Guerriero et al. (1999), and those obtained with the BeppoSAX satellite Masetti et al. (2000). Guerriero et al (1999) monitored four outbursts of the source occurred between 1996 and 1998, detecting type I bursts, type II bursts, and the source persistent emission up to 20 keV. The persistent emission level was estimated offsetting the satellite pointing by 0.5∘ away from GX354–0. They found that the 2.5 – 20 keV persistent emission spectrum was well described by a multi-component model consisting of two blackbodies (bb), plus a power-law (pl), noticing that up to 10 keV the pl is not needed. Masetti et al. (2000) mainly studied in the broad 0.1 – 200 keV energy band the evolution of the spectral properties of the bursting emission. The persistent emission spectrum was investigated in the range from 1 to 10 keV, also finding that a 2bb model was suitable to describe the data. At energies higher than 10 keV, a residual contamination from GX 354–0 prevented an unbiased estimate the persistent emission flux level and spectrum from being performed with the Phoswich Detection System (PDS). Mahasena et al. (2003) observed type II bursts from th RB with ASCA in 1998 and 1999, and found that both the burst and persistent emission spectra, in the 1 – 10 keV energy range, could be fitted with a two-component model consisting of a multi-color disc model and a blackbody.
We observed the RB in hard X–rays, using both the imager IBIS Ubertini et al. (2003) and the module 2 of the X–ray monitor JEM-X Lund et al. (2003) on board the INTEGRAL satellite Winkler et al. (2003). Thanks to their high angular resolution it was possible to separate the RB from GX 354–0. This represents a significant improvement over the previous measurements made with low spacial resolution instruments. Thus we were able to clearly measure the hard X–ray emission from the RB as distinct from that of the nearby GX 354–0.
We report here the first high energy detection of the RB during the decay phase from outburst to quiescence. The observation was obtained during the February/March 2003 outburst. The results are based on the 20 – 100 keV data from IBIS, and on 3 – 20 keV data from JEM-X. In Sec. 2 we describe the observation, in Sec. 3 we present the spectral results, and in Sec. 4 we give the conclusion.
2 INTEGRAL observation and data analysis
The present dataset was obtained during a Target of Opportunity (ToO) observation of the Galactic center region, performed from February 28 to March 1, 2003 (satellite revolution 46), during the outburst decay phase of the RB. The observation spanned just over 2 days and caught the object as the flux level was decaying from an X–ray intensity corresponding to about 50% of the outburst peak down to quiescence. Fig. 1 shows the 2 – 12 keV RB light curve obtained with the All-Sky Monitor (ASM) on board RXTE. Also shown in Fig. 1 are the time intervals in which the INTEGRAL observation was performed.

The IBIS imager is a coded mask instrument with an angular resolution of 12′ FWHM, a fully coded field of view (FOV) of , and a partially coded FOV of at zero sensitivity. The detection plane consists of two detection layers, ISGRI and PICsIT. The upper detector, ISGRI Lebrun et al. (2003), has a passband between 15 keV and 1 MeV, but its best sensitivity is achieved between 20 keV and 200 keV. The bottom detector, PICsIT Di Cocco et al. (2003), has a passband between 200 keV and 8 MeV. The JEM-X monitor is also a coded mask telescope with angular resolution of 3′ FWHM, a FOV of in diameter, and a partially coded FOV of in diameter. It covers the energy range from 3 to 25 keV.
Our observation consisted of 76 stable pointings (Science Windows, ScW) of 2.2 ks exposure each, with a 5 5 dithering pattern. Due to the dithering, which implied a change of the pointing direction, the RB was not always in the JEM-X field of view. The RB position offsets, which ranged from to , were used in the data extraction. For IBIS, the total exposure time was 173 ks. For JEM-X, for which the data extraction was restricted to pointings with an offset , the total exposure time was 46 ks. Due to the high angular resolution of IBIS and JEM-X the RB was well separated from GX 354–0. The spectrometer (SPI) was not used since its angular resolution is inadequate in this case.
The data reduction was performed using the standard Offline Science Analysis (OSA) version 3.0 distributed by the INTEGRAL Science Data Center Courvoisier et al. (2003). The algorithms used in the analysis are described by Goldwurm et al. (2003). For all instruments, the newest available (OSA 3.0) response matrices were used. For each ScW we extracted 16 channel spectra for IBIS and 256 channel spectra for JEM-X. Single pointings were deconvolved and analyzed separately, and then mosaicked. For each ScW, source positions are determined by fitting a 2D gaussian function to each peak in the deconvolved image. Source spectra are then obtained by a simultaneous fit of all sources detected in the image together with the background. The spectrum averaged on the total exposure time was obtained from those of the ScWs by weighting them for the exposure time of the individual pointings. The spectra were analyzed with the XSPEC v. 11.2.0 software package Arnaud (1996).
3 Results
3.1 Image and light curve properties of the RB
IBIS
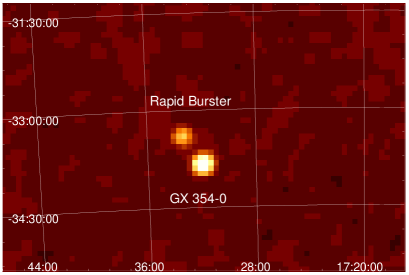
Figure 2 shows a significance map of the sources detected in the region around the RB position in the 20 – 40 keV energy range. Two sources are clearly detected at a significance level of for the RB and for GX 354–0, respectively. At higher energies, 40 – 80 keV, the confidence level was for the RB and for GX 354–0. With the imaging procedure, from the IBIS data the derived celestial position of the RB is given by (J2000) , while that of GX 354–0 is given by . The source position offset with respect to the catalog position is for the RB, and 0.07′ for GX 354–0. This is within the 90% confidence level assuming the source location error given by Gros et al. (2003). The derived angular distance between the two sources is .
The light curve of the RB integrated on each pointing in the same energy bands as above is shown in Fig. 3. The mean count rate in the 20 – 40 keV and 40 – 80 keV energy bands is 2.3 cts/s and 0.5 cts/s, respectively. Above 100 keV the RB was not detected at a statistically significant level either in single exposure or in the total exposure time. The IBIS spectrum and background are fitted simultaneously and extracted for each pointing and energy band. We excluded all channels below 20 keV and above 100 keV.


JEM-X
At offset angles the RB was detected in each ScW at significance levels of 15 – 37, depending on the angular distance from the spacecraft pointing direction. Thanks of the hight angular resolution (3’) of JEM-X, the RB is not contaminated from GX 354–0. The derived light curve, in addition to the persistent emission, shows 11 bursts of duration ranging from 10 s to 60 s. The 3 – 18 keV count rates at the burst peak range from 29 cts/s to 89 cts/s (see the strongest burst in Fig. 4).
The statistics of the data however did not allow us to use the hardness ratio to determine whether the bursts are of type I or II. To get a reasonable signal to noise ratio, the burst light curves were binned at 5 s, and this prevented us from looking at possible ”ringing” effects in the burst timing profile, which are characteristic of type II bursts (see e.g. Masetti et al. 2000). Because of multiple data gaps in the JEM-X light curve of the RB, we could not establish whether the expected linear relation between the X–ray energy in a burst and the time interval to the following burst (’E - t’ relation, Lewin et al. 1976) is satisfied by our burst data. For the same reason, we cannot easily classify the detected bursts according to the results by Guerriero et al. (1999), which predict type I bursts at particular epochs from the outburst onset. On the basis of the luminosity of the persistent emission ( erg ) in correspondence of the observed bursts, according to Guerriero et al. (1999), type II bursts are favored. However, the estimated the 3 – 18 keV ratio between the persistent and bursting fluence emission (462), which is well above the minimum value found in the case of type I X–ray bursts Lewin et al. (1995), would point to a type I burst origin of the observed events.
3.2 Persistent emission and X–ray burst spectra
The mean 3 – 100 keV spectrum of the Rapid Burster persistent emission was obtained by using all the useful JEM-X and IBIS data except those corresponding to the 11 time intervals in which the X–ray bursts were observed. A constant factor was also included in the fit to take into account both the uncertainty in the instruments cross-calibration and the fact that IBIS and JEM-X have different exposure times: the last point in fact can introduce systematic effects in the fitting result, expecially if the source is characterized by a bursting behaviour at the time of the observations. We fixed this constant equal to 1 for JEM-X, allowing it to vary for IBIS. We found that the spectrum is well described by a photo-electrically absorbed multi-component model consisting of a bb plus a pl plus a Gaussian emission line centered at 6.5 keV. We were not able to constrain the interstellar column density , so was frozen at 1.6 cm-2 in our fit, the Galactic value reported in the radio maps of Dickey & Lockman (1990) along the source direction. This value is consistent with that measured by Masetti et al. (2000). The significance of the emission line is very high, as also testified by the /(degrees of freedom, dof) = 178/138 in the case the line is not included in the fit to /dof = 115/135 after its inclusion, with a probability of chance improvement of . The best fit parameters of the model together with the 90% confidence single parameter errors are reported in Table 1, while the count rate and the spectrum along with the single fit components and the residuals on the count spectrum to the best fit model are shown in Fig. 5 and Fig.6.


Assuming that the pl is due to Comptonization of soft photons off high energy electrons, although we do not find any evidence for a high-energy cut-off at 100 keV, we attempted to put a lower limit on the temperature of the electron responsible for hard X–ray emission. For that, we substituted the simple pl, with the Comptonization model compps of Poutanen & Svensson (1996), assuming a spherical geometry and a multicolour disk blackbody (Mitsuda et al. 1984) seed photon spectrum. This model also provides a very good description of the data (/dof = 114/133) and gives a 2 lower limit of 90 keV for the electron temperature, an opacity and a inner edge disk temperature of keV. Using the JEM-X data, we have also analyzed the X–ray burst spectrum. Because of the low statistics available for the single burst spectra, we summed them together deriving a mean spectrum. We found that a photo-electrically absorbed bb describes the data well (/dof = 65/57), with a temperature , which is consistent with that estimated for the persistent emission (see Table 1), and a corresponding bb radius of km. From the bb model, we estimated an average burst luminosity of erg s-1. However, the strongest burst reached a bolometric luminosity of erg s-1.
To compare our spectral results with those obtained by Masetti et al. (2000), we also considered the X–ray burst spectrum with the persistent X–ray emission subtracted. In this case, no significant change was observed in the bb temperature, and bb radius, while the mean burst bolometric luminosity is a little bit lower ( erg s-1).
| Parameter | Value |
|---|---|
| cm-2 | |
| Blackbody | (keV) |
| Blackbody | (km) |
| Gaussian | (keV) |
| Sigma | (keV) |
| Equivalent Width | (eV) |
| Photon index | |
| 0.85 (135 d.o.f.) | |
| (3 - 100 keV) | erg s-1 |
| (3 - 100 keV) | 0.45 |
| a Fixed for the fit. | |
| b Assuming a distance of 8 kpc. |
4 Discussion and Conclusion
INTEGRAL has provided the first measurement of the persistent high energy X–ray emission from the RB without contamination from the source GX 354–0 located at from the RB. We observed X–ray emission from 3 keV up to 100 keV in the time period from 14 to 16 days from the outburst onset. The broad band persistent emission spectrum measured during the INTEGRAL ToO observation, is well described by the sum of a bb a Gaussian plus a pl model. The inferred bb temperature is 2.2 keV, while the photon index of the high energy pl component is 2.4. The persistent emission source luminosity is erg in the energy range from 3 – 100 keV. No evidence for a cutoff in the power law component was found up to energies of 100 keV. Assuming for the hard spectral component a thermal Comptonization model, we get a lower limit for the electron temperature of 90 keV. However we cannot exclude that the hard X–ray spectral component is due to non-thermal Comptonization processes occurring in the source (see e.g. Coppi, 1999, for a review).
An interesting feature of the RB 3 – 100 keV spectrum is that, when modeled by a bb plus pl, it is very similar to that of atoll sources in the hard state. Indeed, in some of these sources, during their hard states, the X–ray spectrum extends up to several hundreds of keV without any evidence of cutoff (e.g., KS 1731–260 and GX 354–0, Barret & Vedrenne 1994; Aql X–1, Harmon et al. 1996). This behaviour at high energies is also similar to that of Black Hole Candidates in the so-called power–law gamma–ray state (Grove et al. 1998). The similarity of the observed RB spectrum to that of atoll sources in hard state would be consistent with our classification, discussed in Section 3.1 of the observed X–ray bursts as Type I bursts. However in the atoll sources in their hard state the luminosity of the bb component is less than about 20% with respect to their total luminosity, while in our case the bb contributes to more than 50% of the total luminosity. A strong contribution of the bb component to the total X–ray luminosity is instead typical of Z-sources (see e.g. Di Salvo et al. 2000). This “anomaly” of the RB spectrum with respect to that of the other atoll sources could however be related to the particular, and still not well understood, physical environment of the source (perhaps the “propeller-effect” caused by the magnetic field of the neutron star). Indeed we do not know why the RB, and only the RB, displays both Type I and Type II X–ray bursts in continously changing times and modality. Thus the fact that the RB cannot be fully classified as a “classical” atoll source is not surprising, given the peculiarity of the RB. However, with INTEGRAL, a new step towards understanding the source has been taken. A step forward could be made by extending the spectral study at energies well above 100 keV, in order to search for any cutoff or to test whether non-thermal Comptonization processes (well observed and studied in Black Hole Candidates) also occur in this unique source. This can be achieved with dedicated INTEGRAL observations of another, possibly stronger, outburst of the Rapid Burster.
Acknowledgements.
MF is grateful to E. W. Bonning for valuable suggestions and assistance with the manuscript, and acknowledges financial support from the France Spatial Agency (CNES).References
- (1)
- Arnaud (1996) Arnaud K. A., 1996, in ASP Conf. Series 101, Astronomical Data Analysis Software and Systems V, ed. G. H. Jacoby & J. Barnes (San Francisco: Astronomical Society of Pacific), p. 17
- Barret & Vedrenne (1994) Barret D., & Vedrenne G., 1994, ApJS, 92, 505
- Courvoisier et al. (2003) Courvoisier T. J.-L., Walter R., Beckmann V., et al., 2003, A&A, 411, L57
- Coppi (1999) Coppi P. S., 1999, in ASP Conf. Ser. 161, High Energy Processes in Accreting Black Holes, ed. J. Poutanen & R. Svensson (San Francisco: ASP), 375
- Di Cocco et al. (2003) Di Cocco G., Caroli E., Celesti E., et al., 2003, A&A, 411, L189
- Di Salvo et al. (2000) Di Salvo T., Stella L., Robba R., et al., Apj, 2000, 544, L119
- Dickey& Lockman (1990) Dickey J. M., & Lockman F. J., 1990, Annu. Rev. A&A, 28, 215
- Goldwurm et al. (2003) Goldwurm A., David P., Foschini L., et al., 2003, A&A, 411, L223
- Gros et al. (2003) Gros A., Goldwurm A., Cadolle-Bel M., et al., 2003, A&A, 411, L179
- Grove et al. (1998) Grove J. E., Johnson W. N., Kroeger R. A., et al., 1998, ApJ, 500, 899
- Guerriero et al. (1999) Guerriero R., Fox., Kommers J., et al., 1999, MNRAS 307, 179
- Harmon et al. (1996) Harmon B. A., Wilson C. A., Tavani M., et al., 1996, A & A Supl., 120, 197
- Lebrun et al. (2003) Lebrun F., Laray J.-P., Lavocat Ph., et al., 2003, A&A, 411, L141
- Lewin et al. (1976) Lewin W. H. G., Doty J., Clark G., W., et al., 1976, ApJ, 207, L99
- Lewin et al. (1995) Lewin W. H. G., van Paradijs J., Taam R. E., 1995, In: Lewin W. H. G., van Paradijs J, van den Heuvel E. P. J. (eds.) X-ray Binaries. Cambridge Univ. Press, p. 175
- Lund et al. (2003) Lund N., Budtz-Jrgensen C., Westgaard N., J., et al. 2003, A&A, 411, L231
- Mahasena et al. (2003) Mahasena, P., Inoue, H., Asai, K., & Dotani, T., 2003, PASJ, 55, 827
- Masetti et al. (2000) Masetti N., Frontera F., Stella L., et al., 2000, A&A, 306, 134
- Masetti (2002) Masetti, N. 2002, A&A, 381, L45
- Mitsuda et al. (1984) Mitsuda, K. K., Inoue H., Koyama K., et al., 1984, PASJ, 36, 741
- Ortolani et al. (1996) Ortolani S., Bica E., & Barbuy B., 1996, A&A, 306, 134
- Poutanen & Svensson (1996) Poutanen J., & Svensson R., 1996, ApJ, 470, 249
- Ubertini et al. (2003) Ubertini P., Lebrun F., Di Cocco G., et al. 2003, A&A, 411, L131
- Winkler et al. (2003) Winkler C., Courvoisier T. J.-L., Di Cocco G., et al. 2003, A&A, 411, L1