I. S. Ohta: E-mail: izumi.ohta@nao.ac.jp, Telephone: +81-422-34-3875, Fax: +81-422-34-3864, Address: National Astronomical Observatory 2-21-1 Ohsawa Mitaka Tokyo 181-8588, Japan
Development of super broadband interferometer in FIR
Abstract
We are developing the super broad band interferometer by applying the Fourier Transform Spectrometer(FTS) to aperture synthesis system in mm and sub-mm bands. We have constructed a compact system based on the Martin and Puplett type Fourier Transform spectrometer (MP-FT). We call this equipment Multi-Fourier Transform interferometer (MuFT). The band width of the system can be extended as large as one wants contrary to the severely limited band width of the usual interferometer due to the speed of the AD converter. The direct detectors, e.g. bolometer, SIS video detector, can be used as the focal plane detectors. This type of detectors have a great advantage in FIR band since they are free from the quantum limit of the noise which limits the sensitivity of the heterodyne detectors used in the usual interferometers. Further, the direct detectors are able to make a large format array contrary to the heterodyne detectors for which construction of a large format array is practically difficult. These three characteristics make one be possible to develop high sensitive super broad band FIR interferometer with wide field of view. In the laboratory experiments, we have succeeded in measuring the spectroscopically resolved 2D image of the source in 150GHz-900GHz band. The future application of this technique to the observations from the space could open new interesting possibilities in FIR astronomy.
keywords:
FTS, aperture synthesis, Interferometer, FIR1 INTRODUCTION
Sub-mm wave band is one of the yet unexplored wavebands in Astronomy although a lot of preliminary researches have been attempted. One part of the difficulties for performing observations in this band is owing to a large atmospheric absorption optical depth. Since sub-mm wave band is a boundary of the radio and infrared astronomy, there remain a lot of frontiers in the development of the fundamental observational technology.
If an interferometer which is able to use direct detectors as focal plane detector were developed, it could open a new horizon for mm and sub-mm wave astronomy since it shares both merits of single dish and interferometer. In this research, we have developed one of the concrete examples of such kind of new instruments by applying the aperture synthesis technique to the Fourier Transform Spectrometer (FTS). The application of the FTS to the aperture synthesis was first independently proposed by Itoh & Ohtsuka(1986)[1] and Mariotti & Ridway (1988)[2] in NIR. The system was referred to as double Fourier interferometer by these authors since the obtained signal by the system is Fourier transformation of both spectra and intensity distribution on the sky. In these works, the Michelson type FTS was applied to the aperture synthesis.
We considered the application of the Martin & Puplett type Fourier Transform spectrometer[3] (hereafter MP-FT) to the aperture synthesis system in wide band[4]. In this system, wire grid is used as beam splitter. By setting the wire grids appropriately, 2D intensity distribution of four Stokes parameters are able to be measured by our instrument. The obtained signal by our system is Fourier transformation of spectra and intensity distributions of 4 Stokes parameters (multiple components) on the sky. Therefore, we refer this system as Multi-Fourier Transform interferometer abbreviated to MuFT. The abbreviated name of MuFT also contains the meaning that this instrument measures Mutual correlation of the source signal instead of auto-correlation as in the case of usual FTS although it is based on FTS. This is the first work which studied the application of the aperture synthesis technique to the MP-FT. There was also no works which concretely studied the application of the aperture synthesis technique to the FTS including the Michelson type in mm and sub-mm wave band.
Applying this technique to space born mission is one of the best possibilities to extract the maximum ability of MuFT since there is no restriction on the band width from the atmospheric absorptions. Mather et al. [5] has been proposing space born Far Infrared Observatory based on this kind of technique to NASA.
2 Fundamentals of Multi-Fourier Transform interferometer
The MuFT is a system which makes possible the imaging and spectroscopy in a wide band by combining Wiener-Khinchine Formula and van Citter Zernike Formula[4]. By setting the wire grids appropriately, acquisition of polarization information is possible. In this section, fundamentals of the components of the MuFT system and fundamentals of the observables by the MuFT are summarized. The advantages of the MuFT are also summarized.
2.1 Components of MuFT
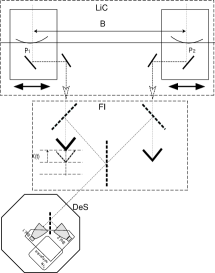 |
Fig.1 is a schematic diagram of MuFT. From top of the page, there are Light Concentrating part(LiC), Fourier Interference part(FI) and Detection & Sampling part(DeS). The detected signal is transfered to computer after passing the electrical amplifier, noise filter and AD converter. The transferred data are analyzed by the appropriate data analysis system. Since the data is transformed into information of Polarimetry, Spectroscopy and Image in the data analysis system, the data analysis system is referred to PSI. In the followings, details of each components and present resources are explained.
LiC part first performs a division of wave front of the incident source signal, and guides the signal to the Fourier interference part. The interval and orientation of the baseline vectors, and pointing the objects are also controlled in this part. The antenna in usual radio interferometer and siderostat in optical interferometer are corresponding to this part.
In the case of using grounded telescopes, a large geometrical light path difference must be corrected by using long delay line. In our current system, the geometrical light path difference is canceled out by controlling the position of each telescopes so that the reference point of the targeted source is kept to be pointed along a bisector of the baseline vector perpendicular to the baseline vector. The same reference point must be on the center of the FOV.
As one of the example, we are currently using a heliostat as pointing and guiding system. It guides the light from the targeted source so that the incident light always comes down from the vertical direction for the observer who is sitting below the second mirror. Put the optical elements for performing division of wave front on the table below the second mirror, and perform the division of wave front. The baseline interval is controllable by controlling the positions of these optical elements. When very high spatial resolution is desired, using heliostat is not realistic solution since the base line interval is limited by the size of the heliostat. Something like two mirrors connected by one rail mounted on turn table could be a possible solution like as SPIRIT[6]. In the space, using multi-satellites could be an attractive solution.
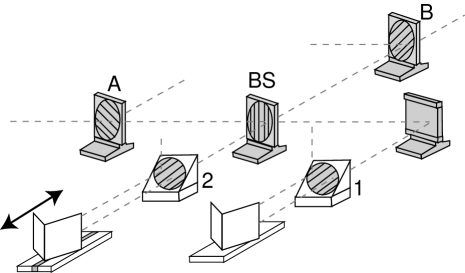 |
The Fourier Interference part is the instrument in which the divided light beams are recombined after modulating the one of the light path length and the hart of the MuFT system. It has two entrance windows to get two light beams guided from the light concentration part.
Wire grid polarizers are used as beam splitters and beam combiners. One of the example of the FI part is illustrated in Fig.2. Depending on the alignment of the wire grids 1 and 2, observables of the FI part is different. There are two basic alignment of the wire grids. When the direction of the wires of WG 1 and WG 2 are parallel as illustrated in Fig.2, Stokes parameters of I and Q are observables. This is referred to option 1. When the direction of the wires of WG1 and WG2 are orthogonal, Stokes parameters of U and V are observables. This is referred to option 2. By treating incident waves as vector waves, interferogram of each option can be expressed as follows,
| (1) | |||||
where corresponds how the direction of the WG1 and 2 are set. These results show that the MuFT is possible to measure all intensity distributions of 4 Stokes parameters for each frequency in wide band, eg. , , , . Since only three of 4 Stokes parameters are independent for completely polarized waves, systematic measurements errors could be self calibrated in MuFT by measuring all of 4 Stokes parameters for the completely polarized light beams. For the intensity measurement, the observations by the option 1 is enough.
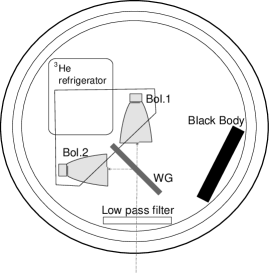 |
The DetS part which is optimized to MuFT, is illustrated in Fig.3. The most of the works on this developments were performed by Hamaji and summarized in his master thesis at Tohoku University. The difference of reflecting and transmitting signals by the output wire grid reproduces full mutual coherence function and removes the unwanted DC components. The DC fluctuations originated from the atmospheric fluctuation and the thermal fluctuation of the detector systems are common both for the transmitted and reflected components. Therefore, these fluctuations are expected to be removed out by taking the difference of both signals.
The PSI system performs control of MuFT, and analysis of acquainted data. Control of equipment is mainly built based on LabView. Specifically, control of source tracking and monitor of a baseline length vector, an operation mirror, control of direction of WG, acquisition of data are performed. For the analysis of acquisited data, it is built mainly based on IDL. Fourier transformation of the acquisited data in each baseline length vector is performed and processing using adjustment and the reference of data is performed and the data based on the whole data is compounded.
2.2 Advantages of MuFT
High sensitivity and wide band width interferometer in FIR
This system can use direct detectors as the focal plane detectors of the interferometer, like bolometer or Super-conductive Tunnel Junction detectors(STJ). They are the most sensitive detectors in mm, sub-mm and FIR wave bands since they are free from quantum limit of the noise which limits the sensitivity of the heterodyne detectors used in the usual interferometers in these wave bands. They also make possible very wide band observations. The band width of the system can be extended as large as one wants contrary to the severely limited band width of the usual interferometers which use heterodyne detectors. Since the wire grid has an uniform reflection and transmission rates for all frequencies in mm, sub-mm and FIR, the MuFT is suited to broad band observations.
Wide field of view
Constructing large format heterodyne spatial arrays are not yet feasible, since generator of the reference signal and associated electric circuit required to be mounted for each detectors are bulky and not amenable to automated production that uses integrated circuit technology. Therefore, yet a single detector is used in radio interferometers, including ALMA. It severely limits a FOV of the instruments. On the other hand, a large form spatial arrays of direct detectors are already operating. Developments of new type of direct detectors aiming a dramatically extension of the pixel number have been also progressed. Since MuFT can use direct detectors as the focal plane detector of interferometer, it dramatically extends the FOV of the mm and sub-mm interferometers. To develop this technique, a group in NASA is now performing laboratory experiments by using optical CCD. They refer this experiment Wide-field Imaging Interferometry Testbed (WIIT)[7].
Large dynamic range
When source intensity distribution is independent from the frequency, we can sum up all images obtained for different frequencies into single image. In other ward, a single baseline observation is equivalent to the various baseline interval observations. Long wave length see the object with low resolution. Short wave length see it with high resolution. Therefore, large dynamic range is retained efficiently.
Linear and Circular Poralimetry
The MuFT can measure all 4 components of Stokes parameters [8].
etc.
Since this is an interferometer, it is only sensitive to interference signal, in other word coherence signal. Spatial scale of the atmospheric fluctuation usually has a long wave length. Therefore, interferometer is usually insensitive for atmospheric fluctuation, in other word it is strong against the atmospheric fluctuation.
3 Experiments in Laboratory
|
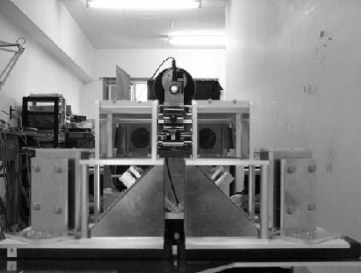
The results of the laboratory experiments conducted with the prototype FI part of MuFT, FT-0.1. We have been performing experiments in the laboratory aimed to verify the theoretical considerations of the MuFT and quantify the abilities of the MuFT. The two dimensional extended source imaging was performed using the black body emitter as the source. The parameters of these experiments are summarized in Table.1.
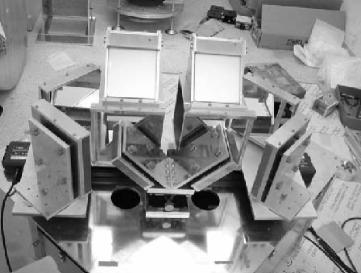
Light source is 1000 centigrade black body. As the collimator, a spherical mirror with a diameter of 80cm and curvature radius cm was used. The mirror is made of aluminum and coated with sapphire about 0.2m in depth. The transmission of the Sapphire coating is high against a submillimeter wave. The thickness of coating is small enough compared with wavelengths which we were interested in. Therefore it is not necessary to take the effect of absorption into consideration. Four trapezoid masks pattern are put in front of the black body aperture which are referred to A-D. The mask is made of aluminum and is handmade. An optical system is shown in Fig.4. Baseline length is varied from 18 to 28 cm for mask A and from 18 to 38 cm for masks B - D. These experiments were conducted in August, 2003(A), and February, 2004(B - D).
Firstly, Mercury Lamp was used for optical-axis adjustment since the detection of the mutual coherence signals of mercury lamp is much easier than that of black body. The optical-axis adjustment is performed by following procedure.
(1) Optical-axis is adjusted by using the laser beams of the sub interferometer in FI-0.1 at first. The source was put on the focus of the laser beams which reverses light path.
(2)Then, check by eyes whether the source is put on the appropriate position.
(3)And, height and distance of the source were adjusted so that amplitude of the source signals guided through each entrance WG (WG 1 and 2) by closing one of two light paths.
(4) The source position is searched at where the mutual coherence signal becomes maximum. Check whether the peak position of mutual coherence signals in the interferogram does not change as increasing the baseline length.
If a peak position moves as changing baseline length, the direction of the incident beam is inclined from the direction normal to the baseline and the source is not put on the center of the FOV. The procedures from (1) to (4) were performed iteratively several times. Since it was the optical system of off-axis of the collimator mirror, the black body source was inclined so that the plain of the exit window of the black body source is normal to the optical axis of the collimator mirror. The experiment was performed with an assumption that rotation of mask is equivalent to rotation in baseline plane. The rotation of the black body radiator by synchronizing the rotation of the mask is hard. So the black body is fixed. Since the surface intensity distribution of the black body radiator can be regarded as uniform and the emission from the different part of the black body can be regarded as incoherent, rotation of the mask can be treated as equivalent to the rotation of the source and the rotation in the baseline plane. In order to carry out imaging, it is necessary to take data at various points.
Baseline length sampled 18 to 28cm with 2cm spacing (set A) or 18cm to 38cm with 12cm spacing (set B). The mask rotation angles were changed with 15 or 30 degrees intervals. The number of the sampling points are 54 points in the case of set A and 18 points in the case of set B. The measurements were carried out with an operation mirror speed of 0.8 cm/s, and 20 or 10 scans per one sampling point.
The angle of rotation of baseline length and a mask was controlled by the number of pulses sent to an automatic x and rotation stage. The optimal operating temperature of the bolometer used for the experiment was 1.5K. The operating temperature of 1.5K is held by decompressing . Gain at the time of measurement was increased 1000 times. The noise was removed in RC circuit where cut off frequency of this circuit was 160Hz low-pass filter.
| Source | Black Body(1273K) | IR-563 |
| Source size | A : 9mm,11mm, 13mm(trapezoid ) | Masking for Al plate |
| B : 12mm, 20mm, 15mm | ||
| C : 6mm, 10mm, 14mm | ||
| D :6mm, 8mm, 10mm | ||
| Base line length | A : 18cm - 28cm (2 - 6 steps), | |
| B- D : 18cm - 38cm (3 steps) | ||
| Rotating angle | A : 15 - 30degrees /steps | |
| B - D : 30 degrees /steps | ||
| Total baseline number | A : 54, B : 20, C : 21, D : 18 |
4 RESULT
When the source intensity distribution does not depend on frequency, all images obtained for different frequencies are summed up into single image as discussed in the previous section. This is the large dynamic range merit of the MuFT. To show this merit with concrete experimental results, observed dirty images of 4 mask patterns after all the data in 5 - 30 cm-1 are summed up, are shown in Fig.5 bottom panels. The simulated dirty images for the same coverage and the same frequency range are also shown for comparison in the top panels. The simulated images are the expected images when the observations were performed with noise free.
All of the observed images are well reproducing the simulated images. These results have confirmed the capability of the simultaneous observations of source spectrum and images by the MuFT and the large dynamic range of the MuFT.
Gain and NEP of the prototype MuFT were estimated from the above results. Gain of the system was estimated from the above results to be [VoltJy] in the frequency ranges where the strong atmospheric absorption lines are absent. The system noise equivalent power was estimated to be [W/] based on the above experiments. This rather high system NEP may be determined by the noise power of the atmospheric emission as explained below. NEP of this detector system is [W/] where is a quantum efficiency of the bolometer. This is much lower than the system NEP. The NEP of 300 K atmospheric emission for this bolometer is about 2.3 . The reasons why takes such a high value are a large FOV of the det. system and a high cut off frequency of the low path filter mounted on the bolometer. The measured FOV of det. system is about 20∘. The current detector system absorbs all radiation below 3THz. Due to the arrangement of the wire grids in option 1, only one eighth of the input source radiation is reached to the detector system at most and another radiation is transmitted and reflected out when the beams hit the WGs. One the other hand, the noise atomospheric emission does not suffer this one eighth degradation since the everywhere around the bolometer is filled by 300K black body radiation in submm wavebands. The detection efficiency of detector system is about . Since the atmospheric noise emission was the dominant source of the system noise, the expected system noise equivalent power is . Although the obtained value is similar to the measured value, it is still a factor of several smaller than the measured NEP of the system. The may be able to attribute to the uncertainty in the FOV of the current detector and unknown quantum efficiency of the detector. A part of the discrepancy may also be due to still inaccurate adjustment of an optical system.


|


|
5 SUMMARY & DISCCUSION
In this research, we have developed a new instrument by applying the aperture synthesis technique to the Fourier Transform Spectrometer (FTS) – MuFT. MuFT is a system which makes possible the imaging and spectroscopy in a wide band by combining Wiener-Khinchine Formula which tells that a spectrum can be measured by the auto-correlation, and van Citter Zernike Formula which makes imaging possible by the mutual correlation. Since the polarizers are used as the beam splitter and combiner in this equipment, acquisition of polarization information is possible. Fundamentals of MuFT were considered, and the concrete composition of this equipment is shown.
Imaging experiment of the extended source using the blackbody of about 1273 K was conducted. Consequently, 2D source images for various frequencies in the wide band from about 5cm-1 to 30cm-1 were successfully obtained. Moreover, we have succeeded in reconstructing source image by summing up all the images obtained at different frequencies and shown the large dynamic range merit experimentally.
However, the following improvements are required for the optical system. The adjustment accuracy of optical system is low. For example, optical-axis adjustment with the light source and LiC carried out manually by observer’s eyes. A certain device which improves the accuracy of this portion is desired for the usage in actual astronomical observation. The new optical system which improves these points needs to be designed and manufactured. The base line length taken in this experiment was limited in the quite narrow range. It is necessary to also perform measurement by the long baseline. Moreover, we have not yet confirmed whether the same image can be observed by repeating the same experiment with the same mask and the same coverage. Actually, the phase of the obtained images for the masks B-D are shifted amount of from the expected images. The reason of this is still unresolved. Although all imaging experiments are conducted by trapezoid, imaging experiments with other types of the source, e.g. non-axis symmetric images, are also necessary.
The system noise level was measured to be . This is much higher than the intrinsic NEP of the bolometer of [W/]. The NEP of 300 K atmospheric emission for this bolometer is about 2.3 . By taking into account the efficiency of the optical system, that is less than , and the efficiency of the detector, that is about 0.1 to 0.3, discrepancy between the expected NEP of the system when the noise is limited by atmospheric emission and the measured NEP of the system, is reduced to a factor of several. So the high noise level of the current system may be explained by the atmospheric emission and a large loss of the incident light due to very low efficiency of optical systems and detectors which still contain large uncertainties.
We have also shown that measurement of the Stokes parameters of are possible for the point like quasimonochromatic wave source. However, for actually performing polarization observation, quantitive measurement of the Stokes parameters , and are required to be performed.
In order to determine the accuracy of imaging observations, the further supplementary examinations are required. The FOV of the system was measured in this research. However, identification of the factors which limits FOV is now on.
At B=18cm, and source size 10’,the system is possible to detect a source of T1300K and 10’ at source size with . Based on these results, we can estimate the observabilities by current system and improved system. Using these results at S/N 10, source size 10’, optical depth 1, and integration time 10 hours, the system is possible to detect a source of T 166K. Sources which satisfy these conditions are restricted to quite bright objects, such as the sun and the moon. While raising the observation experience value of this equipment using observation of these sources, we should develop improved equipment. For example, if the aperture size is increased to 50cm from 5cm or is lowered down to level, plenty of objects could get into observable. When such as 0.3K bolometer system is achieved, the system is possible to detect SZE of COMA galaxy cluster in 5 in each wave-band with bandwidth of [GHz] within an integration time of [s].
6 FUTURE
Finally, a future schedule is summarized. In a laboratory experiment, supplementary examination of two dimension imaging, estimate of accuracy, check the view for every frequency, identification of the noise origin, etc. Toward outdoor observations, LiC part must be corrected and optimized. Complete the development of 0.3K bolometer system. This improves the system NEP down to a level. The source guiding system and tracking system must be constructed.
We are planning to perform the observations from good mm and submm observation sites, such as Nobeyama or Atacama. In Atacama, the atmospheric window from 200GHz to 300GHz is very attractive for MuFT. An interesting result is expected if spectrally resolved imaging observations of SZ in this wide range and 150GHz bands are performed. Since we can use the system without thinking of time sharing with many observers, original imaging and spectroscopic observation of nearby sources are expected.
We are planning to construct ground base mm and submm observation system based on MuFT consisted of the aperture of 50cm telescopes, and maximum baseline length of a few m. The possibility of taking extensive FOV can also be cultivated by the formation of many elements of bolometer, STJ, or TES. An optical design for that is also advanced.
Applying this technique to space born mission is one of the best possibilities to extract the maximum ability of MuFT since there is no restriction on the band width from the atmospheric absorptions. The future application of this technique to the observations from the space could open new interesting possibilities in FIR astronomy.
Acknowledgements.
The research was financially supported by the COE program ”Exploring New Science by Bridging Particle-Matter Hierarchy” from Tohoku University, the Sasagawa Scientific Research Grant from The Japan Science Society and by the Grant-in-Aid for Scientific Research (116204010) of the Japan Society for the Promotion of Science.References
- [1] K. Itoh and Y. Ohtsuka, “Fourier-transform spectral imaging - Retrieval of source information from three-dimensional spatial coherence,” Optical Society of America Journal 3, pp. 94–100, Jan. 1986.
- [2] J.-M. Mariotti and S. T. Ridgway, “Double Fourier spatio-spectral interferometry - Combining high spectral and high spatial resolution in the near infrared,” Astronomy and Astrophysics 195, pp. 350–363, Apr. 1988.
- [3] D. H. Martin and E. Puplett, “Polarized Interferometric Spectrometry for the Millimetre and Submillimetre Spectrum,” Infrared Physics 10, 1969.
- [4] I. S. Ohta, Development of Astronomical Interferometer applying Fourier transform spectroscopy to aperture synthesis system in mm and sub-mm band. PhD thesis, Tohoku University, 2004.
- [5] J. C. Mather, S. H. Moseley, Jr., D. Leisawitz, E. Dwek, P. Hacking, M. Harwit, L. G. Mundy, R. F. Mushotzky, D. Neufeld, D. Spergel, and E. L. Wright, “The Submillimeter Frontier: A Space Science Imperative,” ArXiv Astrophysics e-prints , Dec. 1998.
- [6] J. C. Mather and D. Leisawitz, “The SPIRIT and SPECS Far-Infrared/Submillimeter Interferometry Missions,” The Institute of Space and Astronautical Science Report SP No. 14, p. 219-224. 14, pp. 219–224, Dec. 2000.
- [7] D. T. Leisawitz, B. J. Frey, D. B. Leviton, A. J. Martino, W. L. Maynard, L. G. Mundy, S. A. Rinehart, S. H. Teng, and X. Zhang, “Wide-field imaging interferometry testbed I: purpose, testbed design, data, and synthesis algorithms,” in Interferometry in Space. Edited by Shao, Michael. Proceedings of the SPIE, Volume 4852, pp. 255-267 (2003)., pp. 255–267, Feb. 2003.
- [8] M. Hattori, I. S. Ohta, H. Matsuo, and Y. Shibata, “The Application of MP-FTS to Aperture Synthesis,” The Institute of Space and Astronautical Science Report SP No. 14, p. 353-360. 14, pp. 353–360, Dec. 2000.