An Unveiling Event in the Type 2 AGN NGC4388:
a Challenge for a Parsec Scale Absorber
Abstract
We present two Rossi Xray Timing Explorer (RXTE) PCA observations of the type 2 Seyfert galaxy NGC 4388 caught in an unusual low X-ray absorption state. The observations were triggered by a detection in the 1.5-3 keV band of the RXTE All-Sky Monitor. NGC 4388 was found at a somewhat high continuum level (f(2-10 keV)=810-11erg cm-2s-1) and with a column density (N31022 cm-2), a factor 10 lower than normal. The second PCA observation, four hours later, gave N21021 cm-2 indicating, at the 3.1 level, variability so rapid puts the absorber on a few 100 Schwartzschild radii scale, similar to the Broad Emission Line Region, or smaller. This small scale creates difficulties for the parsec-scale obscuring torus paradigm of Unified Schemes for type 1 and type 2 AGNs.
1. Introduction
Optically NGC 4388 is a classical type 2 Seyfert galaxy (Huchra, Wyatt & Davis 1982) with permitted and forbidden emission lines of the same width (Khachikian & Weedman 1974). There is abundant evidence that many, and perhaps all, type 2 Active Galactic Nuclei (AGNs) are normal type 1 AGNs with both the characteristic broad emission lines and the optical to X-ray continuum obscured by a flattened torus of absorbing gas and dust (e.g. Mulchaey et al. 1994). This is the basis of the Unified Scheme for AGN (Antonucci 1993, Urry & Padovani 1995). NGC 4388 has been detected in X-rays for over 20 years (Table 1) and has always shown a column density, NH= 2-5 cm-2. The most common form of the Unified Scheme locates this absorption in a dusty torus at parsec distances from the central continuum (Krolik & Begelman 1988, Pier & Krolik 1992, 1993). However, Risaliti, Elvis & Nicastro (2002) found that 23/24 X-ray absorbed AGNs (1022 cmN31023 cm-2) showed NH variability by a factor 2-3. The best studied objects varied on the shortest accessible timescale of months, which is rather fast to be due to Keplerian motion at parsec radii and so raises questions about the nature of the obscuring torus.
Risaliti et al. suggested an alternative location in the cool outer parts of an accretion disk wind, echoing the model of Kartje, Königl & Elitzur (1999) who predicted just such a torus. This location predicts much faster NH variability, down to a timescale of days. In a simple model of Poisson variations in the number of obscuring clouds, , the amplitude of variability found by Risaliti et al., implies 5-10. In this case 0.1-1% of the time =0 and, in the Unified scheme, the central type 1 nucleus would then be unveiled.
The RXTE (Swank et al. 1998) All Sky Monitor (ASM, Remillard et al. 1997) is just sensitive enough to detect such low energy ‘unveiling events’. We thus began a Target of Opportunity (TOO) program with Rossi-XTE to obtain snapshot Proportional Counter Array (PCA, Swank et al. 1998) spectra of type 2 AGNs showing signs of a low energy detection in the RXTE ASM. Here we report the detection of a low NH ‘unveiling event’ in NGC 4388.
2. Observations and Data Reduction
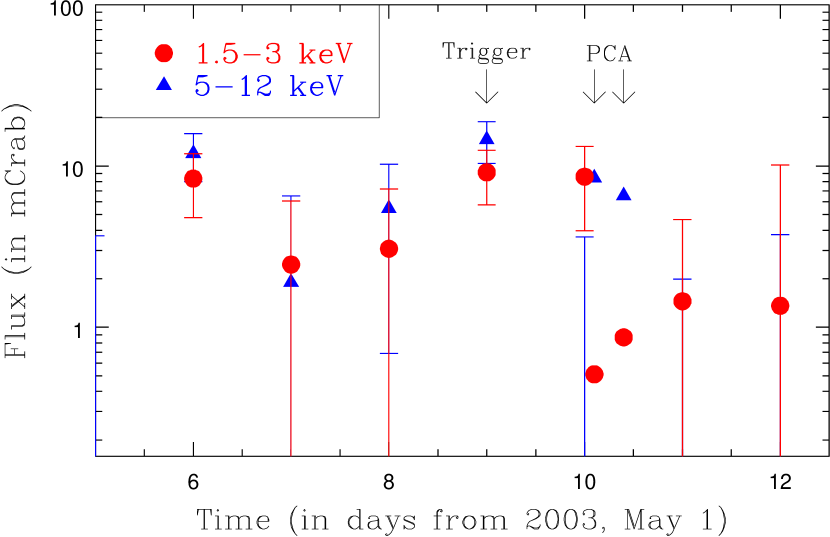
We monitored NGC 4388 with the RXTE ASM to search for detections in the soft 1.5 - 3 keV X-ray channel (‘a’). Normally NGC 4388 has a flux of 410-13erg cm-2s-1 in this band (Forman et al. 1979), while a detection requires a flux some 250 times larger (110-10erg cm-2s-1). Simply removing the large absorbing NH (2-51023cm-2) would increase the observed flux to 410-11erg cm-2s-1, a factor of 100, so that only a modest additional factor 2-3 increase in the emitted continuum would be needed to put NGC 4388 over the threshold for ASM detection. By contrast, an increase in the emitted continuum flux by a factor 100 would be unprecedented among the well studied type 1 AGN, where factors of a few to 10 variation are seen (Markowitz et al. 2003). Hence an ASM ‘a’ band detection is a good indicator of a low NH event. A triggering event of this type occured on 2003 May 9 (Fig. 1), shortly after another one (which is visible on the left of Fig. 1). One day after the ASM trigger NGC 4388 was observed twice with the RXTE PCA, for 1.9 ksec and 6.2 ksec, with a four hour gap between the two observations (Fig. 1).
We only consider data from PCU-2 for this analysis, as this is the
best-calibrated proportional counter unit (PCU) in the
RXTE/PCA111URLs
http://lheawww.gsfc.nasa.gov/users/keith/bkgd_status/status.html
http://heasarc.gsfc.nasa.gov/listserv/grodis/msg00066.html.
Data reduction tools from LHEASOFT version 5.2222URL http://heasarc.gsfc.nasa.gov/docs/software/lheasoft/ were used
to screen and prepare the event files and spectra. Data were taken in
”Standard 2” mode, which provides coverage of the full PCA bandpass
(2–60 keV) every 16 seconds. Only data from the top Xe-filled gas
layer in PCU-2 was used to make the source and background spectra, as
this gas layer has the lowest background. The standard RXTE
“good time interval” filtering was applied to the data. For the
non-imaging PCA accurate background subtraction is crucial for faint
sources like NGC 4388. The background spectra were made using the tool
pcabackest using the latest ‘faint source’ background model
(pca_bkgd_cmfaintl7_e5vv20031123.mdl, updated by RXTE in
November 2003). pcabackest calculates the predicted (dominant)
particle background every 16 s, and so tracks the variation of the
background around the orbit, thus taking into account the different
backgrounds in these two short observations. Redistribution matrix
files (rmfs) and ancillary response files (arfs) were made and
combined into a single instrumental response file using pcarsp.
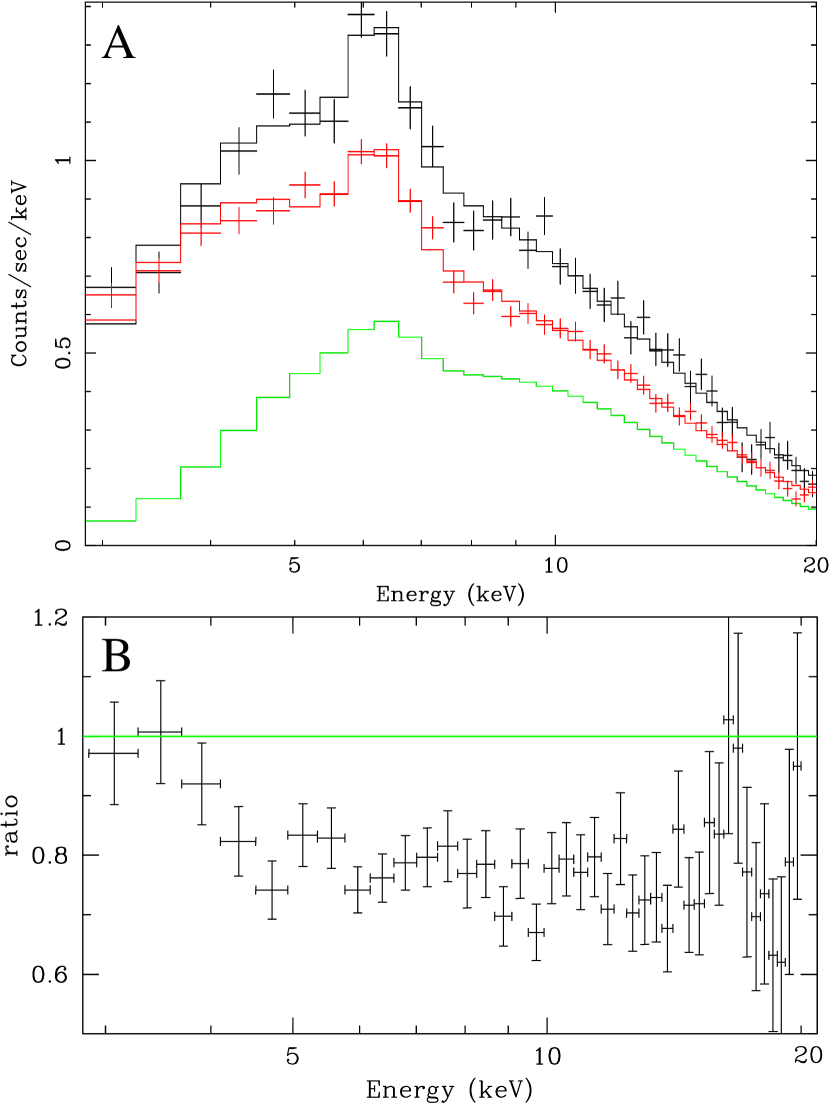
We added 0.6% systematic errors to our spectra using grppha, as we find that in many instances acceptable fits to the Crab can be obtained with 0.6% systematic errors. However, Poisson errors of 5% - 10% are dominant. The lowest channels in each of the PCUs routinely reveal strong deviations likely due to calibration uncertainties; in addition, the calibration of the PCUs is more uncertain above approximately 25 keV, and the spectra of faint sources like NGC 4388 become background-dominated in this regime. In fitting the spectra, then, we ignored energy range below 3 keV (channels 1-4) and above 20.0 keV. The PCA X-ray spectra are shown in Fig. 2a, where they are compared with a Chandra observation performed 14 months earlier. Fig. 2a shows that most of the variation is at low energies, 5 keV. In Fig. 2b we show the ratio between the two RXTE spectra, which indicates that the cut off in the spectra at low energies is due to a difference in NH.
To fit the PCA spectra we used XSPEC v.11.3333Arnaud K., & Dorman B., 2003, XSPEC 11.3 User Guide, URL http://heasarc.gsfc.nasa.gov/docs/xanadu/xspec/manual/manual.html. A model comprising: a power-law of slope , absorbed by a zero redshift NH, with a superimposed emission line near the 6.4 keV Fe-K line energy, was fit to the two PCA data sets and gave good (30/34 degrees of freedom for PCA-1 and 25/34 degrees of freedom for PCA-2. The low redshift of NGC 4388 (2535 km s-1 Huchra, Wyatt & Davis 1982) is indistinguishable from zero with the PCA. The Galactic NH (2.51020cm-2, Murphy et al. 1996) is negligible for the PCA energy range. The total flux in the kiloparsec scale X-ray nebula around NGC 4388 (Iwasawa et al. 2003) is also negligible (2.610-13erg cm-2s-1). The results are given in Table 1, together with fits to the same model, with the same minimum energy, for two unpublished observations from XMM-Newton, and for six data sets from the literature. The measured NH in the two PCA observations is cm-2 and cm-2, respectively (90% confidence). This rapid change between the two PCA observations in four hours is significant at the 3.2. I.e. there is a 0.14% chance that the NH value is the same in the two PCA observations.
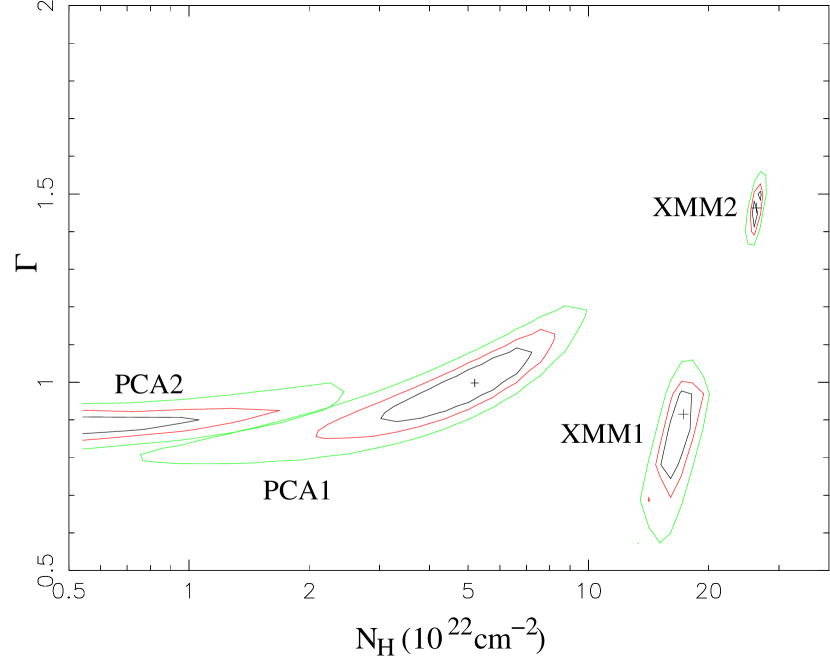
The PCA NH values are one and two orders of magnitude respectively lower than in all previous X-ray observations of this source. In particular the PCA-1 NH is 13 smaller than that measured by XMM-Newton 5 months earlier (XMM-2, Table 1). [The change in NH in the 5 months between XMM-1 and XMM-2 is significant at the 11 level.] The contour plot of Fig. 3 shows that the dramatic reduction in NH is not due to a degeneracy between and NH that is sometimes encountered in X-ray spectra. is flat (=0.8-0.9) in the PCA spectra compared both with most of the earlier observations and with unobscured type 1 AGNs (1.8, Nandra et al. 1997, Reynolds 1997, Perola et al. 2002). The XMM-1 observation (Table 1) also gave a flat , yet is heavily obscured, so a flat spectrum is not a property correlated with a low NH. The small (10 arcsecond) beam size of XMM-Newton (Jansen et al. 2001) effectively rules out the possibility that the flat PCA spectral slope is due to another source lying within the 1 sq.degree PCA field of view. The high 2-10 keV flux in the BeppoSAX-1 observation demonstrates that a similarly high flux does not reduce the observed NH. So we must be seeing bulk motion across our line of sight, as in Risaliti et al. (2002).
The NH variation is robust against reasonable changes in the model: (1) Adding a reflection component (PEXRAV model, Magdziarz & Zdziarski 1995) does not alter or . Even leaving all the parameters free, the best fit is obtained with a covering factor (R=) R=0. The 90% confidence upper limits are R0.8 for the first observation, and R for the second one. Fixing R to these upper limits we obtain column densities cm-2 and cm-2. (2) Adding a soft component, of course, does change the fit dramatically as this component affects only the lowest channels. For black body emission at typical soft excess temperatures of 0.3-1 keV the required 0.1-2 keV flux is 20 mCrab, or a luminosity of 51042erg s-1. This luminosity causes no physical problems although a 104 s variation requires an optically thick source (Elvis et al. 1991 ApJ 378, 537); a sphere of the implied area has a radius of only 1010 cm, 0.3 light-seconds. However such a large low energy flux is not suggested by the lowest energy PCA bins that were omitted from the fit.
The test prefers an emission line consistent with the 6.4 keV Fe-K line, but broadened by =0.42 keV (90% confidence), (i.e. FWHM = 2.38 = 1.0 keV, FWHM/E = 0.15). A broad line would make an origin for the line in a parsec-scale torus unlikely, and would argue for wind or accretion disk origin. The XMM-2 observation however, using the higher spectral resolution CCD EPIC detectors, gives a lower gaussian (7320 eV), though the line may be complex. The PCA-2 measured equivalent width of the line, 500 eV, is stronger than normal for a type 1 Seyfert, but less strong than can be found in Compton thick AGN (Levenson et al. 2002). Again XMM-2 gives a more normal EW (200 eV) for an AGN that is not Compton thick. The EW and of the PCA and XMM-1 are consistent but both disagree with the XMM-2 values.
Instrument N E EW Fe Lf Obs. Date Refh SL2-XRT 2.1 1.9 – – – 2.1 3.5 1985 Jul 29 1 ASCA-1 3.15 1.32 6.49 150 750 1.3 1.5 1994 Jul 04 2 ASCA-2 3.34 1.47 6.47 700 0.64 0.7 1995 Jun 21 2 BeppoSAX-1 3.80 1.58 6.46 233 2.5 3.5 1999 Jan 09 3 BeppoSAX-2 4.80 1.47 6.38 525 0.94 1.4 2000 Jan 03 3 Chandra 3.50 1.8j 6.36 440 0.36 0.6 2001 Jun 08 4 Chandra-0 2.50 1.25 6.36 165 2.9 2.8 2002 Mar 05 5k XMM-1 1.70 0.91 6.41 503 0.77 0.7 2002 Jul 07 5 XMM-2 2.61 1.46 6.44 73 204 2.0 2.2 2002 Dec 12 5 RXTE/PCA-1 0.52 0.99 6.34 503 7.2 4.0 2003 May 10g 5 RXTE/PCA-2 0.86 6.32 390 570 6.1 2.9 2003 May 10g 5
3. Discussion
We have found a factor 100 decrease in the column density toward the normally almost Compton thick (0.1-0.3) type 2 AGN NGC 4388. This decrease certainly occured in less than the 0.4 years from the earlier XMM-Newton observation. The obscuring material in type 2 AGNs is thus in a highly dynamic state, and warrants intensive monitoring. A few strongly Compton thick AGN have become almost Compton thin on a timescale of 2.5 - 5.5 years (Matt, Guainazzi & Maiolino 2002), but not on shorter timescales, and still with residual column densities of 1023cm-2 even in the low absorption state, in 3 out of 4 cases. NGC 4388 is the only known case of an AGN in which a substantial X-ray opacity changes to an undetectable value (0.001).
Moreover, it is likely that the decrease in obscuring column density coincided with the 2-day ‘flare’ seen in the RXTE ASM, so that the flare is primarily an ‘unveiling event’. Without X-ray spectra through the rise of the ASM flux, however, we cannot be certain. Between the two PCA observations we saw evidence, at 3.2, for a change of NH in four hours.
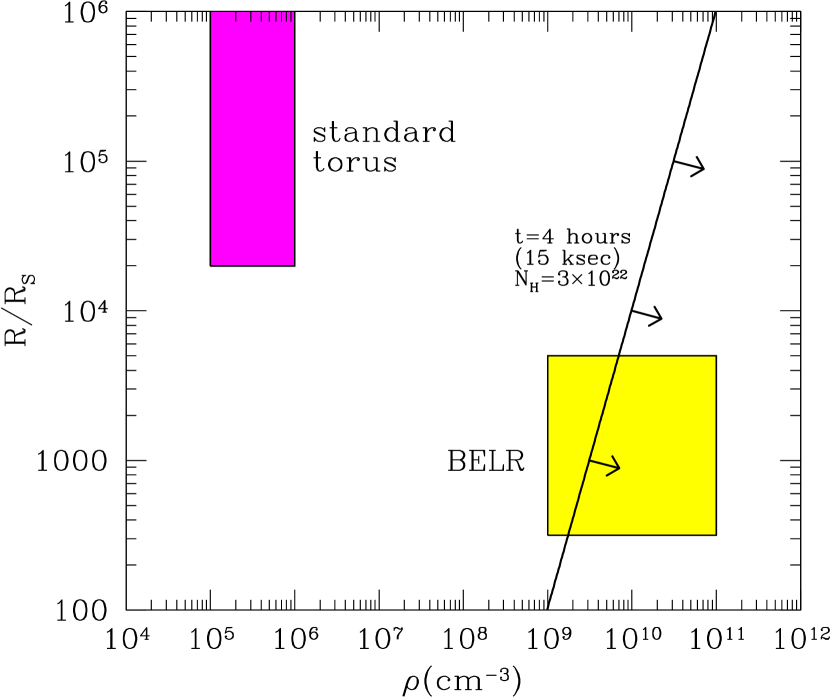
The probable short timescale (either 2 days or 4 hours) of the column density variations has strong implications for the location of the obscuring matter. Assuming that the absorption is due to clouds in Keplerian motion around the central source, and interpreting the 4 hour time lag between the two observations as the crossing time of a cloud implies a distance from the center R, where is the density in units of 1010 cm-3, RS is the Schwartzschild radius, and is the timescale in units of four hours (Risaliti et al. 2002). If NGC 4388 has an Eddington ratio of 0.1 then the black hole mass is 106 - 107M⊙. Scaling from the K-band bulge magnitude gives a similar mass. This implies that the absorber is at a distance typical of the Broad Emission Line ‘clouds’ (BELRs), or smaller, and is of similar density. Only if a high density ( cm-3) is assumed can a parsec distant absorber produce changes on the observed timescale (Fig. 4). A similar conclusion applies to the Seyfert 1.5 Galaxy NGC 4151, from the detection of a in a time interval of ksec during a BeppoSAX observation (Puccetti et al. 2003).
This result is a challenge to the parsec scale usually attributed to the obscuring torus. For spherical isolated clouds, the high density implies small ( cm) cloud sizes:(1) The expansion time for a 100 K ( 1 km s-1) cloud from 1010cm to 1011cm is only 106 s,, far shorter than the orbital time. But the large pressure needed to confine them ( K cm-3) cannot be provided by self-gravity. (2) A hot confining medium would produce thermal emission much greater than the observed AGN bolometric luminosity (assuming a layer of 1 parsec thickness, L erg s-1, where and are the density and temperature in units of 107 K and 107 cm-3, respectively, Rybicki & Lightman 1979). (3) The NH through a confining medium would be 10 cm-2 = 10. So all continuum variations shorter than a few years would be smeared out by Thomson scattering, contrary to observations (Table.1). (4) Individual clouds would cover only a small fraction, 10-6, of the X-ray emitting source, whose dimensions are cm for a black hole of mass . If hundreds of clouds are needed to cover the X-ray source, no NH variation by more than a few percent can be observed with significant probability.
To produce large variations in NH compatible with 5-10 needs clouds of a diameter within a factor of a few of the continuum source size. This implies a density of 109cm-3. This is just compatible with a radius 100 given a 4 hour variation (Fig.4). If the absorbers are part of a wind crossing our line of sight (Elvis 2000) then sheet-like structures (Arav et al. 1998) become plausible, and this allows larger radii.
The great majority (99%) of the obscuring gas in NGC 4388 occurs at small radii, and the most likely scenario is that Broad Emission Line clouds are drifting across our line of sight in NGC 4388 leading to large changes in NH. Similar behavior has been seen in some type 1 AGN, involving an N1023cm-2 over 100d at the radius of the BELR (Lamer, Uttley & Miller 2003). Since we have no simultaneous optical spectra we do not know whether the bulk of the dust, which absorbs the optical and UV photons, lies on the same small scale. The closest dust could be to the continuum is the sublimation radius (Barvainis 1987) which, in NGC 4388 at 1042 erg s-1 (2-10 keV), is 71016cm (0.02 pc), or 210 (fig.4). The dust:gas ratio in AGN is typically a factor 10 below the Milky Way value (Maccacaro et al. 1982, Maiolino et al. 2001), so that a separate dusty absorber is allowed. Unveiling events in type 2 AGN, such as the one reported here for NGC 4388, put strong constraints on Unified Models for AGN, and seem to point to a different view of the obscuring torus.
References
- Antonucci (1993) Antonucci, R. 1993, ARA&A, 31, 473
- Arav et al. (1998) Arav, N., Barlow, T. A., Laor, A., Sargent, W. L. W., & Blandford, R. D. 1998, MNRAS, 297, 990
- Barvainis (1987) Barvainis R., 1987, ApJ, 412, 513.
- Elvis (2000) Elvis M., 2000, ApJ, 545, 63.
- Forster, Leighly, & Kay (1999) Forster, K., Leighly, K. M., & Kay, L. E. 1999, ApJ, 523, 521
- Hanson, Skinner, Eyles, & Willmore (1990) Hanson, C. G., Skinner, G. K., Eyles, C. J., & Willmore, A. P. 1990, MNRAS, 242, 262
- Huchra, Wyatt, & Davis (1982) Huchra, J. P., Wyatt, W. F., & Davis, M. 1982, AJ, 87, 1628
- Iwasawa et al. (2003) Iwasawa K., Wilson A.S., Fabian A.C. & Young A.J., 2003, MNRAS, 345, 369.
- Jansen et al. (2001) Jansen, F. et al. 2001, A&A, 365, L1
- Kartje, Königl, & Elitzur (1999) Kartje, J. F., Königl, A., & Elitzur, M. 1999, ApJ, 513, 180
- Khachikian & Weedman (1974) Khachikian, E. Y. & Weedman, D. W. 1974, ApJ, 192, 581
- Krolik & Begelman (1988) Krolik, J. H. & Begelman, M. C. 1988, ApJ, 329, 702
- Lamer, Uttley & McHardy (2003) Lamer G., Uttley P. & McHardy I.M., 2003, MNRAS, 342, L41.
- Levenson et al. (2002) Levenson N., et al. 2002, ApJ, 573, L81.
- (15) Magdziarz P. & Zdziarski A.A., 1995, MNRAS, 273, 837
- Markowitz et al. (2003) Markowitz A., Edelson R., Vaughan S., Uttley P., George I.M., Griffiths R.E., Kaspi S., Lawrence A., McHardy I., Nandra K., Pounds K.A., Reeves J., Schurch N., Warwick, R.
- Matt, Guainazzi & Maiolino (2002) Matt G., Guainazzi M. & Maiolino R., 2002, MNRAS 342, 422
- Murphy et al. (1996) Murphy E.M., Lockman F.J., Laor A. & Elvis M., 1996, ApJS, 105, 369.
- Nandra et al. (1997) Nandra, K., George, I. M., Mushotzky, R. F., Turner, T. J., & Yaqoob, T. 1997, ApJ, 476, 70
- Perola et al. (2002) Perola, G. C., Matt, G., Cappi, M., Fiore, F., Guainazzi, M., Maraschi, L., Petrucci, P. O., & Piro, L. 2002, A&A, 389, 802
- Pier & Krolik (1992) Pier, E. A. & Krolik, J. H. 1992, ApJ, 399, L23
- Pier & Krolik (1993) Pier, E. A. & Krolik, J. H. 1993, ApJ, 418, 673
- (23) Puccetti, S., Risaliti, G., Fiore, F., Elvis, M., Nicastro, F., Perola, G.C., Capalbi, M. 2003, Proc. of the BeppoSAX Symposium, The Restless High-Energy Universe, E.P.J. van den Heuvel, J.J.M. in ’t Zand, and R.A.M.J. Wijers (Eds), astro-ph/0311446
- Remillard & Levine (1997) Remillard, R. A. & Levine, A. M. 1997, All-Sky X-Ray Observations in the Next Decade, 29
- Reynolds (1997) Reynolds, C. S. 1997, MNRAS, 286, 513
- Risaliti (2002) Risaliti, G. 2002, A&A, 386, 379
- Risaliti, Elvis, & Nicastro (2002) Risaliti, G., Elvis, M., & Nicastro, F. 2002, ApJ, 571, 234
- Rybicki & Lightman (1979) Rybicki G. & Lightman A.P., 1979, Radiative Processes in Astrophysics [Wiley, New York].
- Tammann et al. (1999) Tammann, G. A., Sandage, A., & Reindl, B. 1999, proceedings of the 19th Texas Symposium on Relativistic Astrophysics and Cosmology, held in Paris, France, Dec. 14-18, 1998. Eds.: J. Paul, T. Montmerle, and E. Aubourg (CEA Saclay), astro-ph/9904360
- Swank (1998) Swank, J. H. 1998, The Active X-ray Sky: Results from BeppoSAX and RXTE, 12
- Urry & Padovani (1995) Urry, C. M. & Padovani, P. 1995, PASP, 107, 803