Methane Abundance Variations toward the Massive Protostar NGC 7538 : IRS9111Some of the data presented herein were obtained at the W.M. Keck Observatory, which is operated as a scientific partnership among the California Institute of Technology, the University of California and the National Aeronautics and Space Administration. The Observatory was made possible by the generous financial support of the W.M. Keck Foundation. 222Based on observations with ISO, an ESA project with instruments funded by ESA Member States (especially the PI countries: France, Germany, the Netherlands and the United Kingdom) and with the participation of ISAS and NASA.
Abstract
Absorption and emission lines originating from the C-H stretching manifold of gas phase CH4 were discovered in the high resolution (=25,000) infrared L band spectrum along the line of sight toward NGC 7538 : IRS9. These observations provide a diagnostic of the complex dynamics and chemistry in a massive star forming region. The line shapes resemble P Cygni profiles with the absorption and emission components shifted by with respect to the systemic velocity. Similar velocity components were observed in CO at 4.7 , but in contrast to CH4, the CO shows deep absorption due to a high velocity outflow as well as absorption at the systemic velocity due to the cold outer envelope. It is concluded that the gas phase CH4 abundance varies by an order of magnitude in this line of sight: it is low in the envelope and the outflow (X[CH4]), and at least a factor of 10 larger in the central core. The discovery of solid CH4 in independent ground and space based data sets shows that methane is nearly entirely frozen onto grains in the envelope. It thus appears that CH4 is formed by grain surface reactions, evaporates into the gas phase in the warm inner regions of protostellar cores and is efficiently destroyed in shocks related to outflows.
Subject headings:
infrared: ISM — ISM: molecules — ISM: abundances — stars: formation — stars: individual (NGC 7538: IRS9) — astrochemistry1. Introduction
Among the suite of molecules observed in interstellar and
circum-protostellar media333see the compilation at
http://www.cv.nrao.edu/$∼$awootten/allmols.html, methane is
relatively poorly studied. CH4 has no permanent dipole moment, and
therefore cannot be observed by pure rotational transitions at radio
wavelengths. Its strongest fundamental () ro-vibrational
transitions, i.e. the C-H stretching and the C-H
bending modes, occur at 3.32 and 7.67 , respectively. Strong
telluric absorption at these wavelengths hinders interstellar CH4
studies. Gas and solid phase CH4 have been positively identified
at 7.67 in three sight-lines: the massive protostars NGC 7388 :
IRS9, W 33A, and GL 7009 S (Lacy et al., 1991; Boogert et al., 1996, 1997, 1998; Dartois et al., 1998).
CH4 was detected only in the solid state in low resolution Infrared Space Observatory (ISO) observations at 7.67 toward
low mass protostars (White et al., 2000; Gürtler et al., 2002; Alexander et al., 2003), the
Galactic Center (Chiar et al., 2000), and an external galactic nucleus
(Spoon et al., 2001). A recent low resolution Spitzer Space Telescope
spectrum shows absorption by solid CH4 toward the young, low mass
protostar IRAS 08242+5100 (Noriega-Crespo et al., 2004; Boogert et al., 2004).
Observations of CH4 provide insight into the basic principles of astrochemical networks. In the presence of atomic C and H, CH4 is rapidly formed on cold grains, just as H2O is formed from atomic O and H (e.g. Brown, Charnley, & Millar 1988). Perhaps surprisingly, the observed gas and solid state CH4 abundances are low, not more than a few percent with respect to CO and H2O (Lacy et al., 1991; Boogert et al., 1998). This points to relatively low atomic C abundances at the time of CH4 formation, when most C is already locked up in CO. In this same scenario the high CH3OH abundances in several lines of sight may be explained by hydrogenation of abundantly present CO (Dartois et al., 1999; Pontoppidan et al., 2003), and large CO2 abundances by oxidation of CO. The dominance of a CO- and O-based, rather than C-based, chemistry is stressed by the profiles of solid CO2 absorption bands which show an intimate mixture of CO2, CH3OH, and H2O in the ices (Gerakines et al., 1999; Boogert et al., 2000). Nevertheless, even at relatively low abundances methane is proposed to be the starting point of a rich chemistry leading to the complex organic molecules observed in dense clouds like the TMC-1 ridge (Markwick, Millar, & Charnley, 2000). To further test the role of CH4 in interstellar chemistry, basic diagnostics, such as gas phase abundances, gas/solid phase abundance ratios, gas phase temperatures and abundance gradients need to be measured in more lines of sight.
In this work we report the discovery of absorption and emission features arising from the 3.32 C-H stretching mode of gas and solid phase CH4. A previous attempt to detect CH4 at this wavelength was unsuccessful and indicated an abundance of with respect to H in the Orion BN object (Knacke et al., 1985). We study the line of sight toward the massive protostar NGC 7538 : IRS9, because its high radial velocity of (e.g. van der Tak et al. 2000) facilitates the separation of telluric and interstellar lines. NGC 7538 : IRS9 is a well studied massive protostar, known for its large ice and gas columns (Whittet et al., 1996; Mitchell et al., 1990) and a prominent molecular outflow (Mitchell, Maillard, & Hasegawa 1991). The R(0) and R(2) lines of the bending mode of gas phase CH4 and solid state CH4 were detected in this source by Lacy et al. (1991). Unambiguous confirmations of these detections were obtained with space based observations (Boogert et al., 1996, 1998). Here we independently confirm the presence of CH4 by detecting many lines from the 3.32 stretching mode as well as the ice band. The high spectral resolution of these observations permits a line profile analysis in which we determine gas phase conditions in the various environments along the line sight, such as the envelope, the hot core, and the outflow. This, in turn, elucidates the formation and destruction pathways of CH4 in these different environments.
The Keck/NIRSPEC and ISO/SWS observations are discussed in § 2, and presented in § 3.1. A profile analysis of the gas phase absorption and emission CH4 lines, in conjunction with previously reported high resolution CO observations, is presented in §§ 3.2.1 and 3.2.2. The ice band profile is discussed and compared with the C-H bending mode in § 3.3. The implications of these results on the formation and evolution history of the CH4 molecule in protostellar environments are discussed in § 4.1. The origin of the low velocity, warm gas, responsible for the P Cygni-like line profiles, is further constrained in § 4.2. We conclude with future prospects in § 5.

2. Observations
2.1. Keck/NIRSPEC R=25,000 Spectroscopy
The high resolution L band spectrum of the massive protostar NGC 7538 : IRS9 was obtained with the NIRSPEC spectrometer (McLean et al., 1998) at the Keck II telescope atop Mauna Kea. Observations were made on five different nights with clear and dry weather conditions: UT 2002 December 17 and 18, 2003 July 10 and 11, and 2003 November 2. NIRSPEC was used in the echelle mode with the 0.43 slit, providing a resolving power of (12 ). The 2.9–4.1 region was almost fully covered in five echelle settings, each covering five Nyquist sampled wavelength orders of on the 10242 pixel array. Two small regions centered on 2.97 and 3.12 were not covered. The on-source integration time per setting was 20 minutes. Several CH4 ro-vibrational lines as well as the solid CH4 band at 3.32 were observed multiple times to verify their reality. At for NGC 7538 : IRS9, the Doppler velocity with respect to earth was 53.5, 82.4, and 64.0 for the three observing runs. This proved to be sufficient to separate interstellar and telluric CH4 lines and guarantees their reality. The spectra presented in this paper are an average of all the data. The data were reduced in a standard way, using IDL routines (Boogert, Blake, & Tielens 2002). Atmospheric absorption features were divided out using the standard star HR 8585 (A1V), which is bright (=3.78) and reasonably close to NGC 7538 : IRS9 (an airmass of 1.20-1.30 versus 1.34 for NGC 7538 : IRS9). The spectral shape and hydrogen absorption features in the standard star were divided out with a Kurucz model atmosphere. The hydrogen absorption profiles in the Kurucz model are accurate to 1-2%, and residuals can be seen near strong lines. This does not affect the region of main interest for this paper (3.15–3.65 ), except perhaps near 3.297 due to the HI Pf line. Overall, a good telluric correction was achieved, resulting in signal-to-noise values of 110 in the region of CH4 at 3.32 , at the bottom of the H2O ice band at 3.0 and at wavelengths . Strong atmospheric lines, i.e. with less than 50% of the maximum transmission in each setting, leave residuals and were removed from the final spectrum. The spectra were wavelength calibrated on the atmospheric emission lines, using an atmospheric model spectrum (P. van der Valk and P. Roelfsema, priv. comm.). All orders were subsequently combined by applying relative multiplication factors. For the analysis of the emission lines (§3.2.1), the spectrum is flux calibrated by scaling to the continuum brightness of the data presented in Whittet et al. (1996). Finally, in conjunction with the CH4 features, we analyze Keck/NIRSPEC M band CO lines in NGC 7538 : IRS9, previously published in Boogert et al. (2002).
2.2. ISO/SWS R=1,500 Spectroscopy
The 3.26-3.38 spectral region of NGC 7538 : IRS9 was observed multiple times in the high resolution R=1,500 AOT06 mode of the Short Wavelength Spectrometer on board the Infrared Space Observatory (ISO/SWS; Kessler et al. 1996; de Graauw et al. 1996). From the ISO archive we have selected the longest integrations in this wavelength range, corresponding to TDT numbers 39002336 (UT 11 Dec 1996), 75101049 (UT 05 Dec 1997), and 85200455 (UT 16 Mar 1998). All observations were part of the ICE_BAND/DWHITTET guaranteed time program, and have not been previously published. The combined on-target integration time in the 3.26-3.38 region amounts to 5219 seconds. The individual data sets were processed with SWS Interactive Analysis and calibration files version 10.1 in April 2003 at SRON/Groningen. The three AAR products were combined and the detector scans were aligned to the mean using second order polynomials. Then, in this highly oversampled spectrum, data points deviating more than 3 from the mean per resolution element were removed. Finally, the data points were averaged and re-sampled to an R=1,500 Nyquist sampled grid. The resulting S/N is 100, but significantly poorer at the outer 0.015 edges.
3. Results
3.1. Features in the 3.1-3.6 Spectral Region
The L band spectrum of NGC 7538 : IRS9 is dominated by the deep absorption band of the O-H stretching mode of H2O ice (Willner et al., 1982; Whittet et al., 1996). Its peak optical depth at 3.0 is . The most prominent substructure in the long wavelength wing of H2O is the well known, yet unidentified, 3.47 absorption band (Allamandola et al., 1992; Brooke, Sellgren, & Smith, 1996; Dartois et al., 2002). We applied a smooth spline continuum to extract this band on an optical depth scale (Fig. 1). The results were verified by applying low order polynomials to continuum regions described in previous studies (e.g. Brooke, Sellgren, & Geballe 1999). The absorption shape is in good agreement with the low resolution spectrum of Allamandola et al. (1992), as is the presence of a sub-band at 3.53 , attributed to the C-H stretching mode of solid CH3OH. A previously undetected absorption band is apparent by a downturn in the continuum slope at 3.32 . Although it is in a spectral region badly affected by the telluric CH4 Q-branch, its presence is confirmed in Keck/NIRSPEC observations on different dates. In addition, a feature at the same wavelength is found in the space based ISO/SWS spectrum (Fig. 1). We thus conclude that this feature is real and is due to the stretching mode of solid CH4 (§3.3). Not immediately obvious in Fig. 1 but clearly detected upon close inspection (Fig. 2) are P, Q, and R-branch lines of gas phase CH4. It is the first time that the 3.32 ice and gas features are detected in a circum-protostellar environment.
A number of additional features, not further discussed in this paper, are visible in the high resolution Keck/NIRSPEC spectrum. Although they are reproduced in observations at different dates, they are entirely new and need to be confirmed in a larger sample of sources, or, as for solid CH4, in independent data. A weak feature at 3.36 coincides with the C-H stretch modes of ethanol (Allamandola et al., 1992) and ethane (Boudin, Schutte, & Greenberg 1998). Interestingly, another band of ethane at 3.47 seen in laboratory ices appears to be present in NGC 7538 : IRS9 as well. Finally, weak absorptions at 3.47 and 3.41 are also close to the C-H stretch mode of single bonded carbon in CH and CH2 groups in aliphatic hydrocarbons, normally seen in diffuse lines of sight only (e.g. Pendleton et al. 1994).
3.2. Gas Phase Line Profiles at R=25,000
3.2.1 Gas Phase CH4
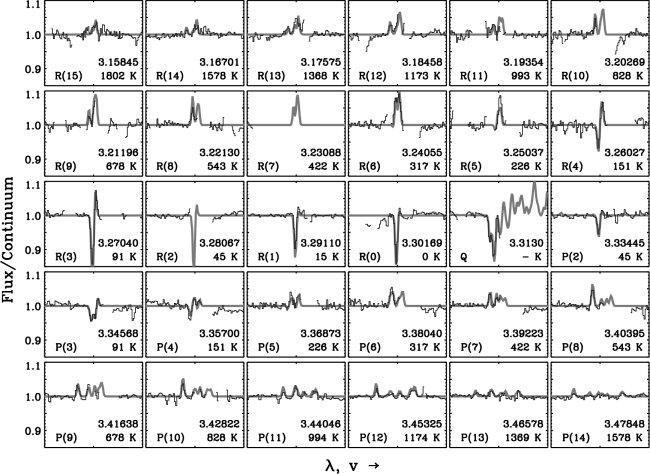
Ro-vibrational absorption and emission lines of gaseous CH4 are clearly detected toward NGC 7538 : IRS9 (Fig. 2). Although the telluric CH4 lines are deep, the large blue-shift of NGC 7538 : IRS9 with respect to the earth (§ 2.1) separates many interstellar lines well. The lines appear mostly in absorption up to lower energy levels with , and entirely in emission above . Intermediate levels have P Cygni-like line profiles, i.e. red-shifted emission and blue-shifted absorption. Such line profiles are usually associated with expanding envelopes (see §4.2, however). Note that for multiple emission and absorption peaks appear for each level. These line splittings are intrinsic to the CH4 molecule and result from rotation-vibration interactions with the spin manifolds of the four equivalent H nuclei. Thus E–, F-, and A–type multiplets occur with spin statistical weights of =2, 3, and 5 respectively.
| a | linesb | c | d | |
|---|---|---|---|---|
| % | 10-21 | |||
| R(15) | 3.15812–3.15864 | 11 | 84 | 5.2 (1.1) |
| 3.15767–3.15792 | 3 | 13 | 3.3 | |
| R(14) | 3.16677–3.16720 | 13 | 73 | 3.8 (0.7) |
| 3.16626–3.16665 | 5 | 26 | 1.5 (0.4) | |
| R(13) | 3.17545–3.17595 | 13 | 81 | 9.0 (0.8) |
| 3.17498–3.17534 | 4 | 16 | 4.3 (0.8) | |
| R(12) | 3.18435–3.18485 | 14 | 74 | 13.6 (3.0) |
| 3.18390–3.18428 | 4 | 26 | 4.8 (0.5) | |
| R(11) | 3.19295–3.19325 | 2 | 21 | 3.8 (1.5) |
| R(10) | 3.20211–3.20253 | 3 | 34 | 3.5 (1.0) |
| R(9) | 3.21178–3.21229 | 6 | 78 | 10.7 (3.0) |
| 3.21146–3.21179 | 2 | 22 | 3.0 (0.8) | |
| R(8) | 3.22087–3.22118 | 3 | 47 | 4.8 (0.8) |
| R(6) | 3.24014–3.24080 | 6 | 100 | 25.1 (1.5) |
| R(5) | 3.25019–3.25064 | 4 | 100 | 12.5 (1.4) |
| R(4) | 3.26017–3.26054 | 4 | 100 | 7.5 (1.0) |
| R(3) | 3.27035–3.27063 | 3 | 100 | 6.6 (0.5) |
| R(1) | 3.29105–3.29127 | 1 | 100 | 1.5 (0.5) |
| R(0) | 3.30165–3.30187 | 1 | 100 | 1.5 (0.6) |
| P(2) | 3.33435–3.33463 | 2 | 100 | 1.8 (0.4) |
| P(3) | 3.34573–3.34600 | 3 | 45 | 2.1 (0.5) |
| P(4) | 3.35708–3.35736 | 1 | 23 | 1.9 (0.6) |
| 3.35679–3.35703 | 3 | 77 | 1.9 (0.9) | |
| P(5) | 3.36860–3.36901 | 2 | 45 | 4.8 |
| 3.36814–3.36860 | 2 | 55 | 4.5 (0.6) | |
| P(6) | 3.37967–3.38022 | 3 | 48 | 7.8 (0.8) |
| P(7) | 3.39182–3.39230 | 2 | 42 | |
| 3.39138–3.39176 | 2 | 32 | 3.5 (0.4) | |
| P(8) | 3.40379–3.40411 | 1 | 14 | 1.6 |
| 3.40318–3.40370 | 3 | 48 | 6.8 (0.4) | |
| P(9) | 3.41577–3.41613 | 2 | 18 | |
| 3.41509–3.41560 | 2 | 22 | 4.1 (0.4) | |
| P(10) | 3.42719–3.42772 | 3 | 35 | 4.2 (0.7) |
| P(11) | 3.44128–3.44172 | 3 | 30 | 3.2 (0.4) |
| 3.44072–3.44109 | 1 | 11 | 1.6 (0.2) | |
| 3.44009–3.44057 | 3 | 37 | 3.9 (0.2) | |
| 3.43944–3.43982 | 2 | 22 | 2.0 (0.2) | |
| P(12) | 3.45380–3.45441 | 4 | 43 | 4.7 (0.3) |
| 3.45313–3.45347 | 2 | 13 | 1.4 (0.3) | |
| 3.45252–3.45296 | 2 | 16 | 1.1 (0.4) | |
| 3.45175–3.45208 | 3 | 27 | 1.9 (0.3) | |
| P(13) | 3.46664–3.46711 | 3 | 23 | 1.1 (0.4) |
| 3.46566–3.46629 | 3 | 31 | 0.8 (0.3) | |
| 3.46501–3.46548 | 3 | 28 | 1.8 (0.3) | |
| 3.46406–3.46457 | 2 | 17 | 0.8 (0.3) | |
| P(14) | 3.47952–3.48004 | 3 | 22 | 1.9 (0.4) |
| 3.47814–3.47899 | 4 | 35 | 0.6 (0.3) | |
| 3.47757–3.47796 | 2 | 16 | ||
| 3.47659–3.47707 | 3 | 27 | 1.7 (0.4) | |
| a integration region after correction for 8 red-shift | ||||
| b number of blended lines in integration interval | ||||
| c percentage of emission with respect to total emission for this upper level | ||||
| d errors in brackets | ||||
The observed lines are analyzed using the 2001 update of the HITRAN 2000 database (Rothman et al., 2003; Brown et al., 2003). All HITRAN transitions contributing to each observed interstellar line are identified and the number of transitions responsible for at least 90% of the line strength is indicated in column 3 of Tables 1 and 2. For example, at the resolution of our observations, the P(11) transition is split in 4 separate emission lines, which are composed of some 9 strong transitions. The contribution of each observed line to the total emission or absorption per level is indicated in column 4 of Tables 1 and 2 and is calculated in the optically thin limit as
| (1) |
where is the product of the rotation (2+1) and nuclear spin () statistical weights and is the corresponding Einstein coefficient for transition at rotational level . The summation over is for all transitions in the wavelength range of an observed emission line (column 2 in Tables 1 and 2) while the summation over is for all transitions at rotational level . For several levels only part of the emission or absorption is observed as some components lie in poor atmospheric regions. For example, only half the R(8) line flux is seen and for the Q-branch the clearly detected absorption component represents only a few percent of the total Q-branch absorption. Finally, the observed emission line fluxes listed in Table 1 are corrected for the underlying H2O absorption using a wide coverage ISO/SWS spectrum (Whittet et al., 1996). The resulting continuum flux of 1.5 Jy is corrected for foreground extinction using the Galactic extinction law (Draine, 2003) and the derived in §4.2. Thus, the observed line fluxes are scaled to an unextincted continuum flux of 23.7 Jy.

In order to derive basic physical parameters, we construct a rotation diagram for the CH4 emission lines. The Boltzmann equation of a single transition at upper rotational level is
| (2) |
where and are the column density and the energy of the upper level of a single multiplet component respectively. Assuming that collisional excitation is applicable, includes a vibrational excitation energy of 4348 K (Lide, 1994). and are the total CH4 column density and rotational temperature. Throughout this paper we take the ro-vibrational partition function from the HITRAN database, which is applicable at K (Fischer et al., 2003). At lower temperatures we calculate from lines in the HITRAN database. In the optically thin limit, the flux of a partial transition is obtained by summation over all multiplet lines
| (3) |
and thus the observed relates to eq. 2 as
| (4) |

| a | linesb | c | eq. widthd | |
| % | ||||
| R(4) | 3.26003–3.26031 | 3 | 77 | 10.0 (1.4) |
| R(3) | 3.27019–3.27051 | 3 | 100 | 12 (1) |
| R(1) | 3.29092–3.29121 | 1 | 100 | 12.7 (0.4) |
| R(0) | 3.30151–3.30179 | 1 | 100 | 17.6 (1.0) |
| Q | 3.31234–3.31296 | 4 | 2 | 35 (6) |
| P(2) | 3.33423–3.33453 | 2 | 100 | 6.5 (0.8) |
| P(3) | 3.34530–3.34584 | 3 | 100 | 12.3 (0.7) |
| P(4) | 3.35660–3.35694 | 3 | 61 | 5.9 (0.8) |
| a integration region after correction for 6 blue-shift | ||||
| b number of blended lines in integration interval | ||||
| c percentage of absorption with respect to total absorption for this lower level | ||||
| d errors in brackets | ||||
Here we make use of the fact that the upper energy level and transition frequency are nearly the same for all multiplet lines (to within 0.1%). is the size of the emitting region, for which we assume the value of 4.3 sterad derived from CO emission lines, two orders of magnitude smaller than the solid angle corresponding to the 0.42′′ wide slit (§ 4.2). The rotation diagram constructed from the observed CH4 emission lines indicates a rotational temperature of 600 K (Fig. 3). Although is well constrained, the derived column density of is accurate to within a factor of 3 only (3 errors).
To further illustrate the goodness of fit, to investigate possible optical depth effects and to model the complex blend of CH4 absorption and emission lines, we have also constructed single temperature LTE models. The level populations are calculated according to eq. 2. Emission line fluxes and absorption equivalent widths at any optical depth are calculated following Genzel (1992), and Spitzer (1978) respectively, applying the Voigt function for the line profiles. The observed line profiles are fitted by adding a single temperature red-shifted emission model to a single temperature, blue-shifted, absorption model. We find that a blue-shift of 6 and a red-shift of 8 are needed, and that both components are unresolved at the spectral resolution of 12 . The validity of the temperature and column density derived from the emission line rotation diagram is confirmed by the relatively low model line optical depth; for example, at a Doppler parameter of =1 , , and =600 K, the peak optical depth is 0.33 (in the R(8) line). The absorption column is well constrained to (CH4)=3 at =5515 K for intrinsic line widths of =0.5–3 (Table 4). The narrowest lines are optically thick (=5 at =0.5 ), while they are optically thin for . We take =3 as a preferred value throughout this paper, because the larger line widths are usually preferred toward NGC 7538 : IRS9 (Mitchell et al., 1990; Boonman & van Dishoeck, 2003), but values of are inconsistent with the unresolved CH4 lines observed. The physical parameters derived from the CH4 stretching mode are in good agreement with the parameters from the bending mode at 7.67 in lower resolution spectra (Lacy et al., 1991; Boogert et al., 1998).
Finally, absorption or emission lines of the 13CH4 and CH3D isotopes have not been detected. Study of the 13CH4 lines is complicated, because the isotope wavelength shift is comparable to the separation of levels and thus the 13CH4 and 12CH4 lines are blended. The column density upper limits are a factor of 3–7 smaller compared to the CH4 column density. At 12C/13C and H/D isotope ratios of at least 50 in dense clouds (Wilson & Rood, 1994; Ceccarelli et al., 2001), these upper limits are not significant.
3.2.2 Gas Phase CO
| eq. widthb | ||
| R(18) | 2 (1) | … |
| R(17) | 5 (2) | … |
| R(16) | 3 (1.1) | … |
| R(15) | 6.5 (2) | … |
| R(13) | 10 (2) | … |
| R(12) | 16 (3) | … |
| R(11) | 12 (4) | 4.5 |
| R(10) | 16 (3) | 4.5 |
| R(9) | 18 (5) | 5 (1) |
| R(7) | 30 (8) | 2.2 (1.0) |
| R(6) | 30 (2) | 3.9 (1.2) |
| R(5) | 41 (3) | 4.7 (1.2) |
| R(4) | 71 (4) | 5.6 (1.0) |
| R(3) | 71 (4) | 5.2 (0.8) |
| R(2) | … | 13.7 (1) |
| R(0) | 55 (3) | 10 (2) |
| P(1) | 55 (2) | 6.4 (1.5) |
| P(2) | 56 (3) | … |
| P(3) | 74 (2) | … |
| P(4) | 27 (2) | … |
| P(18) | 15 | … |
| P(19) | 3.4 (0.4) | … |
| P(21) | 2.5 (0.8) | … |
| P(22) | … | |
| a transitions not listed have not been observed, are in a poor atmospheric region, or are blended with a brighter isotope | ||
| b errors in brackets | ||

At first glance, the line profiles of the fundamental ro-vibrational CO transitions at 4.7 , as published in Mitchell et al. (1990) and Boogert et al. (2002), look similar to those of CH4. They show P Cygni profiles as well, in , , and perhaps even the isotope, with the strength of emission versus absorption increasing for higher levels. Upon closer inspection, however, the absorption profiles of CO and CH4 differ. The low- isotopic CO lines peak at 0 , compared to –6 for CH4 (Fig. 4a). Higher- CO lines ( K), on the other hand, are dominated by absorption at blue-shifted velocities , which is absent in CH4 (Fig. 4b). This provides clues to the formation and evolution history of CH4 (§ 4.1), and in this context it is relevant to quantify the physical conditions of the absorbing and emitting CO gas as well (Table 4).
We analyzed the R=25,000 Keck/NIRSPEC spectrum of Boogert et al. (2002) and arrive at different conclusions compared to Mitchell et al. (1990, 1991). First, and most importantly, in the Keck/NIRSPEC data blue-shifted absorption at 16 is seen up to -levels as high as 20, but only up to in Mitchell et al. (1991). In the rotation diagram constructed from the integrated absorption equivalent widths, this high velocity gas is responsible for the linear part above energies of 100 K (Fig. 5; Table 3). From this a column density of ()=3.5 at a temperature of K (3) is derived. The column density is comparable to that found by Mitchell et al. (1991), but is a factor of 10 higher in the Keck/NIRSPEC data. A second difference is that lines are detected in the high S/N Keck/NIRSPEC data. The / absorption line ratios of corresponding levels are equal to the interstellar isotope ratio of 6.9 at large Galactocentric radii (Wilson & Rood, 1994) within a 20% error margin (see the data points in the rotation diagram; Fig. 5). An important consequence is that reliable CO column densities can be derived, and thus reliable CH4 abundances in the various velocity ranges (§4.1). The steep part of the rotation diagram, corresponding to gas at velocities of –8 to +11 , indicates 20 K and a column density of ()=3.5 , which is a factor of 4 less compared to that found by Mitchell et al. (1990). This is due to our factor of 2 smaller measured equivalent widths and, presumably, lower assumed line opacity.
For the emission lines, the observed / peak strength ratio is at intermediate upper levels of 7-15. Using the standard radiative transfer equation, the peak optical depth of the emission lines, can be derived from
| (5) |
3.3. The Solid CH4 Absorption Bands
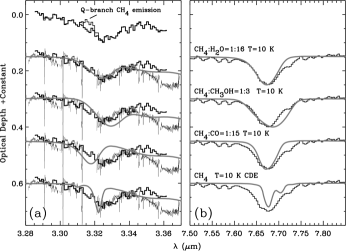
Solid CH4 has been detected by its C-H bending mode at 7.67 in ISO/SWS observations of NGC 7538 : IRS9 (Boogert et al., 1996). The peak position and width of the interstellar band are well fitted with an amorphous, low temperature (10 K) laboratory ice in which CH4 is diluted in an H2O matrix. This same laboratory ice gives an excellent fit to the new 3.32 absorption feature detected in the Keck/NIRSPEC and ISO/SWS spectra, not only in peak position and width, but also to the peak optical depth of 0.1. We thus attribute this interstellar band in its entirety to the C-H stretching mode of solid CH4 in an H2O–rich ice (Fig. 6). A mismatch with the observed ISO/SWS spectrum on the low wavelength wing is attributed to emission by the strong Q-branch of gaseous CH4 (Fig. 6). Indeed, a better match is obtained after subtracting the model constructed from the observed P and R-branch lines from the ISO/SWS spectrum (§3.2.1). In contrast, contamination of gas phase emission to the 7.67 ice band is small because the continuum emission at this wavelength is more than an order of magnitude brighter compared to the continuum at 3.32 (Whittet et al., 1996). Indeed, a weak inflection at 7.66 is due to Q-branch absorption. Simultaneous fits of the C-H stretch and bend modes highlight the good fit of CH4:H2O ices (Fig. 6). Pure CH4 ices and mixtures with CO, otherwise highly abundant in this line of sight (Tielens et al., 1991; Boogert et al., 2002), can be excluded at a high confidence level. Note that the C-H stretching mode of CH4 better discriminates between polar and apolar ices than does the bending mode. Mixtures with other high-dipole molecules, such as NH3 and CH3OH, do not provide equally good fits compared to H2O, but at present we cannot exclude combinations of these polar species.
4. Discussion
| Species | Locationa | Phaseb | d,e | Notes | |||
| K | 10-6 | ||||||
| CH4 | outflow | gas/abs. | 16 | 270 | assumed | ||
| CH4 | core | gas/abs. | 6 | 5515 | 0.30.1 | =0.5–3 | |
| CH4 | envelope | gas/abs. | 0 | 20 | assumed | ||
| CH4 | core | gas/em. | +8 | 600100 | 0.58 | 1.9 | sterf |
| CH | envelope | ice/abs. | … | … | 1.3 | 2.1 | … |
| CO | outflow | gas/abs. | 16 | 270100 | 3510 | 100 | opt. thin |
| CO | core | gas/abs. | 6 | 55 | 100 | assumed | |
| CO | envelope | gas/abs. | 0 | 207 | 3510 | 100 | opt. thin |
| CO | core | gas/em. | +8 | 500150 | 3010i | 100 | sterf |
| COj | envelope | ice/abs. | … | … | 182 | 36 | … |
| a assumed location from velocity, see also §§4.1 and 4.2; b in gas or ices, in emission or absorption; c velocity w.r.t. systemic =57 ; d errors are 3; e assuming /CO=1 from Lacy et al. 1994; f solid angle derived from CO emission; g Boogert et al. 1998; h ice abundance with respect to CO gas+ice abundance in envelope; i uncertainty in column dominated by uncertainty in line opacity; j Boogert et al. 2002 | |||||||
4.1. Astrochemical Implications
The detections of both the 3.32 stretch and the 7.67 bend modes firmly establish the presence of both gaseous and solid CH4 in the interstellar medium. The gas+solid state abundance averaged along the line of sight of the massive protostar NGC 7538 : IRS9 is X[CH4]=, and the absorption gas/solid state abundance ratio is 0.23. A combined high resolution CO/CH4 line profile analysis shows that the abundance as well as the gas/solid state abundance ratio of CH4 vary locally by an order of magnitude, however (Table 4). An ice+gas abundance of a few is found in the outer envelope (systemic velocity), the inner envelope (–6 ) and the compact emission component (+8 ). In the outer envelope, at 20 K the coldest component along the line of sight, at least 90% of the CH4 is frozen on grains. Within the envelope a segregation is present as well; CH4 is intimately mixed with H2O and CH3OH rather than with CO. In the warm, low velocity inner regions of NGC 7538 : IRS9, CH4 is mostly present in the gas phase. These enhanced abundances strongly contrast to the absence of CH4 in the massive, high velocity –16 , warm ( K) outflow seen in CO (X[CH4]).
These new results provide clues to the formation and evolutionary history of CH4, refining previous scenarios (Lacy et al., 1991; Boogert et al., 1998). In time dependent pure gas phase models, such as the ‘standard’ dense cloud model of Lee, Bettens, & Herbst (1996) and the UMIST model of Millar, Farquhar, & Willacy (1997), gas phase CH4 abundances of a few 10-6 are achieved after 105 years. Although this is comparable to the observed abundances, there are strong arguments against a gas phase origin: the low gas/solid state ratio and the intimate mixture between CH4 and H2O in the ices in the envelope. For comparison, CO, a typical gas phase product, has an order of magnitude larger gas/solid phase ratio compared to CH4, even in the cold gas phase. H2O on the other hand is formed by hydrogenation of oxygen on the grains at low temperatures (e.g. Jones & Williams 1984), and a low gas/solid state ratio is observed (Boonman & van Dishoeck, 2003). It is thus likely that CH4 was formed on grain surfaces by hydrogenation of atomic C, at the same time as H2O was formed from atomic O. The low observed CH4 abundance points to a formation time when most of the C was already locked up in CO (Boogert et al., 1998).
The gas phase CH4 abundance in the –6 and +8 components is comparable to the solid state abundance in the envelope. The CH4 may thus have been released from the grains in the inner regions near the protostar. Because CH4 is diluted in an H2O–rich ice (Fig. 6), its sublimation temperature is close to that of H2O, 90 K (Tielens & Whittet, 1996; Hiraoka et al., 1998). The temperature of the +8 emission component is indeed well above 90 K. The gas at –6 , however, has a temperature of 5515 K only. While in one massive protostar, W 33A, CH4 gas at K was detected (Boogert et al., 1998), a lower temperature of 50 K was also measured in another line of sight, GL 7009S (Dartois et al., 1998). We speculate that the icy mantles did not thermally evaporate as a result of protostellar radiative heating, but by a mild shock that has briefly heated the grains above 90 K. Subsequently the gas has cooled radiatively or adiabatically as the inner NGC 7538 : IRS9 core expands outwards with a (current) velocity of 6 .
Shocks may have had a profound impact on the higher velocity gas. CH4 is absent at velocities of 16 and above, where warm CO ( K) is very abundant. After release from the grains, CH4 must have efficiently chemically reacted. The observed CO velocities up to 35 point to the presence of non-destructive C-type shocks. These shocks have been well studied in the context of molecular chemistry. At initial densities of 105 , shocks with velocities of 15–35 have peak temperatures of 500-2500 K (Bergin, Neufeld, & Melnick 1998). At such high temperatures, and at the low expected shock pressures444 bar assuming a factor of 2 density enhancement at a maximum temperature of 2500 K for a 35 shock (Kaufman & Neufeld, 1996; Bergin et al., 1998), CH4 is rapidly driven into CO (Prinn & Fegley, 1989). The occurrence of a C shock therefore explains the absence of CH4 in the outflow of NGC 7538 : IRS9. The importance of shock chemistry in high mass cores was deduced from low gas/solid CO2 abundance ratios as well (Charnley & Kaufman, 2000), and by the abundance ratios of S bearing species (Hatchell & Viti, 2002). One distinct characteristic of shock chemistry is the formation of H2O at temperatures above 250 K (e.g. Bergin et al. 1998). H2O columns comparable to CO are expected, i.e. 2.8 for the NGC 7538 : IRS9 outflow (Table 4). This is a factor of 3.5 larger than the upper limit to the gas phase H2O abundance derived from ISO/SWS 6 spectra (Boonman & van Dishoeck, 2003). High resolution 6 spectra are required to further investigate the presence of H2O in the line of sight of NGC 7538 : IRS9, the effect of blended emission and absorption components and the relation to shocks and outflows.
4.2. Nature of the Low Velocity Warm Gas
The elevated temperature of the low velocity, 6-8 , absorption and emission components seen both in CO and CH4 locates this gas in the inner regions of the protostellar core. The present observations further constrain the origin of this material.
The area of the radiating physical body can be calculated by matching the column density derived from the isotope ratio (§ 3.2.2) to the emission line fluxes. The measured line fluxes need to be corrected for continuum absorption by foreground material. We derive a 4.7 continuum extinction magnitude of using the interstellar extinction law of Draine (2003) and an optical extinction of 6020. The latter is derived from the / relation of Bohlin, Savage, & Drake (1978) and the average line of sight hydrogen column density from this work (Table 4) and that from the silicate absorption band (Tielens et al., 1991). The extinction corrected line fluxes are thus matched at a solid angle of 4.3 sterad. At the distance to NGC 7538 : IRS9 of 2.8 kpc (Crampton, Georgelin, & Georgelin, 1978) this corresponds to a radius of 70 AU. The similarity of CO and CH4 velocities and emission line widths (Fig. 4c) indicates that both molecules are present in this same volume.
The CO and CH4 gas detected on these scales may well be related to the dense material that was inferred on scales of AU from unresolved 3 millimeter continuum interferometer images (van der Tak et al., 2000). This intense emission is unrelated to the envelope, and instead may originate from a dense shell or circumstellar disk. The P Cygni-like line profiles in both CO and CH4 may suggest that an expanding envelope is the preferred geometry. In these line profiles the absorption component is red-shifted by the shell expansion velocity, and the emission component is centered at the systemic velocity and is broadened by twice the expansion velocity. Mitchell et al. (1991) argue that the CO emission component is blue-shifted due to the effect of deep absorption by foreground material at the systemic velocity. This hypothesis can be tested by the profiles of the highest transitions, which should not have foreground contributions. We find that even the lines from the highest rotational levels of CO are blue shifted by +8 (Fig. 4c). Furthermore, the CH4 emission lines peak at this same velocity and are also unresolved. Perhaps the NGC 7538 : IRS9 core moves within its envelope by 8 and the observed peak of the emission line is the center of the P Cygni profile. In this scenario the shell expansion velocity is 14 and an emission line width of 28 is expected. Such broad lines are inconsistent with the observations as well. We conclude that the line profiles are not true P Cygni type profiles and thus are inconsistent with a spherically symmetric expanding envelope. It is unclear what the relation is between the 55 K absorbing gas seen at 6 and the 500 K emitting gas at +8 . More detailed dynamical models of circumstellar disks, accretion flows and outflows are required. The possibility of photon excitation needs to be considered as well. As noted in Mitchell et al. (1991) the similarity of CO absorption and emission line profiles between a number of massive protostars suggests that these lines trace a fundamental property of their inner cores. This is strengthened by the similarity of the CH4 line profiles.
5. Conclusions and Future Work
Using high resolution L and M band spectroscopy we have shown that the gas phase CH4 abundance varies considerably in the line of sight of the massive protostar NGC 7538 : IRS9. This is a result of specific molecule formation and destruction processes: CH4 is formed on grain surfaces and subsequently evaporated from the grains in the inner regions of the protostar. Both evaporation by photon heating and by shocks likely have played roles. CH4 efficiently ‘burns’ to CO in the highest velocity shocked regions. The gas phase CH4/CO abundance ratio is thus a sensitive tracer of shock chemistry. High spectral resolution observations of other species, in particular H2O at 6 , are required to further test the importance and nature of shock chemistry in high mass star forming regions. The Stratospheric Observatory For Infrared Astronomy (SOFIA) will offer this opportunity in the near future (Lacy et al., 2002). Observations of the 3.32 CH4 stretch mode in more lines of sight require high radial velocities ( ) or temperatures that populate the highest levels to avoid saturated telluric lines. In this respect, the 7.67 bending mode may be more suited. Future observations of CH4 toward low mass protostars are particularly exciting, as the CH4/CO ratio is a sensitive tracer of protoplanets. In the relatively low pressure solar nebula low CH4/CO abundances occur. The higher pressure in protoplanetary sub-nebulae, however, favors higher CH4/CO ratios (Prinn & Fegley, 1989). Variations of the CH4 abundance between solar system comets possibly trace such physical condition gradients in the early protoplanetary disk (Gibb et al., 2003).
References
- Alexander et al. (2003) Alexander, R. D., Casali, M. M., André, P., Persi, P., & Eiroa, C. 2003, A&A, 401, 613
- Allamandola et al. (1992) Allamandola, L.J, Sandford, S.A., Tielens, A.G.G.M., & Herbst, T.M. 1992, ApJ, 399, 134
- Bergin et al. (1998) Bergin, E. A., Neufeld, D. A., & Melnick, G. J. 1998, ApJ, 499, 777
- Bohlin, Savage, & Drake (1978) Bohlin, R. C., Savage, B. D., & Drake, J. F. 1978, ApJ, 224, 132
- Boogert et al. (1996) Boogert, A. C. A., et al. 1996, A&A, 315, L377
- Boogert et al. (1997) Boogert, A. C. A., Schutte, W. A., Helmich, F. P., Tielens, A. G. G. M., & Wooden, D. H. 1997, A&A, 317, 929
- Boogert et al. (1998) Boogert, A. C. A., Helmich, F. P., van Dishoeck, E. F., Schutte, W. A., Tielens, A. G. G. M., & Whittet, D. C. B. 1998, A&A, 336, 352
- Boogert et al. (2000) Boogert, A.C.A., Ehrenfreund P., Gerakines, P.A., Tielens, A.G.G.M., Whittet, D.C.B., et al. 2000, A&A, 353, 349
- Boogert et al. (2002) Boogert, A. C. A., Blake, G. A., & Tielens, A. G. G. M. 2002, ApJ, 577, 271
- Boogert et al. (2004) Boogert, A. C. A., et al. 2004, ApJS, 154, in press
- Boonman & van Dishoeck (2003) Boonman, A. M. S. & van Dishoeck, E. F. 2003, A&A, 403, 1003
- Boudin et al. (1998) Boudin, N., Schutte, W. A., & Greenberg, J. M. 1998, A&A, 331, 749
- Brooke, Sellgren, & Smith (1996) Brooke, T. Y., Sellgren, K., & Smith, R. G. 1996, ApJ, 459, 209
- Brooke et al. (1999) Brooke, T. Y., Sellgren, K., & Geballe, T. R. 1999, ApJ, 517, 883
- Brown, Charnley, & Millar (1988) Brown, P. D., Charnley, S. B., & Millar, T. J. 1988, MNRAS, 231, 409
- Brown et al. (2003) Brown, L. R., et al. 2003, Journal of Quantitative Spectroscopy and Radiative Transfer, 82, 219
- Ceccarelli et al. (2001) Ceccarelli, C., Loinard, L., Castets, A., Tielens, A. G. G. M., Caux, E., Lefloch, B., & Vastel, C. 2001, A&A, 372, 998
- Charnley & Kaufman (2000) Charnley, S. B. & Kaufman, M. J. 2000, ApJ, 529, L111
- Chiar et al. (2000) Chiar, J. E., Tielens, A. G. G. M., Whittet, D. C. B., Schutte, W. A., Boogert, A. C. A., Lutz, D., van Dishoeck, E. F., & Bernstein, M. P. 2000, ApJ, 537, 749
- Crampton, Georgelin, & Georgelin (1978) Crampton, D., Georgelin, Y. M., & Georgelin, Y. P. 1978, A&A, 66, 1
- Dartois et al. (1998) Dartois, E., D’Hendecourt, L., Boulanger, F., Jourdain de Muizon, M., Breitfellner, M., Puget, J.-L., & Habing, H. J. 1998, A&A, 331, 651
- Dartois et al. (1999) Dartois, E., Schutte, W., Geballe, T. R., Demyk, K., Ehrenfreund, P., & D’Hendecourt, L. 1999, A&A, 342, L32
- Dartois et al. (2002) Dartois, E., d’Hendecourt, L., Thi, W., Pontoppidan, K. M., & van Dishoeck, E. F. 2002, A&A, 394, 1057
- de Graauw et al. (1996) de Graauw, T., et al. 1996, A&A, 315, L49
- Draine (2003) Draine, B. T. 2003, ARA&A, 41, 241
- Fischer et al. (2003) Fischer, J., Gamache, R. R., Goldman, A., Rothman, L. S., & Perrin, A. 2003, Journal of Quantitative Spectroscopy and Radiative Transfer, 82, 401
- Genzel (1992) Genzel, R. 1992, in The Galactic Interstellar Medium, ed. D. Pfenniger & P. Bartholdi (Berlin: Springer), 275
- Gerakines et al. (1999) Gerakines, P.A., Whittet, D.C.B., Ehrenfreund, P., Boogert, A.C.A., Tielens, A.G.G.M., et al. 1999, ApJ, 522, 357
- Gibb et al. (2003) Gibb, E. L., Mumma, M. J., dello Russo, N., Disanti, M. A., & Magee-Sauer, K. 2003, Icarus, 165, 391
- Gürtler et al. (2002) Gürtler, J., Klaas, U., Henning, T., Ábrahám, P., Lemke, D., Schreyer, K., & Lehmann, K. 2002, A&A, 390, 1075
- Hatchell & Viti (2002) Hatchell, J. & Viti, S. 2002, A&A, 381, L33
- Hiraoka et al. (1998) Hiraoka, K., Miyagoshi, T., Takayama, T., Yamamoto, K., & Kihara, Y. 1998, ApJ, 498, 710
- Jones & Williams (1984) Jones, A. P. & Williams, D. A. 1984, MNRAS, 209, 955
- Kaufman & Neufeld (1996) Kaufman, M. J. & Neufeld, D. A. 1996, ApJ, 456, 250
- Kessler et al. (1996) Kessler, M. F., et al. 1996, A&A, 315, L27
- Knacke et al. (1985) Knacke, R. F., Noll, K. S., Geballe, T. R., & Tokunaga, A. T. 1985, ApJ, 298, L67
- Lacy et al. (1991) Lacy, J. H., Carr, J. S., Evans, N. J., Baas, F., Achtermann, J. M., & Arens, J. F. 1991, ApJ, 376, 556
- Lacy et al. (1994) Lacy, J. H., Knacke, R., Geballe, T. R., & Tokunaga, A. T. 1994, ApJ, 428, L69
- Lacy et al. (2002) Lacy, J. H., Richter, M. J., Greathouse, T. K., Jaffe, D. T., & Zhu, Q. 2002, PASP, 114, 153
- Lee, Bettens, & Herbst (1996) Lee, H.-H., Bettens, R. P. A., & Herbst, E. 1996, A&AS, 119, 111
- Lide (1994) Lide, D. R., 1994, CRC Handbook of Chemistry and Physics (75th ed.; Boca Raton: CRC Press)
- Markwick, Millar, & Charnley (2000) Markwick, A. J., Millar, T. J., & Charnley, S. B. 2000, ApJ, 535, 256
- McLean et al. (1998) McLean, I.S., Becklin, E.E., Bendiksen, O., Brims, G., & Canfield, J. 1998, Proc. SPIE, 3354, 566
- Millar, Farquhar, & Willacy (1997) Millar, T. J., Farquhar, P. R. A., & Willacy, K. 1997, A&AS, 121, 139
- Mitchell et al. (1990) Mitchell, G.F., Maillard, J.-P., Allen, M., Beer, R., & Belcourt, K. 1990, ApJ, 363, 554
- Mitchell et al. (1991) Mitchell, G. F., Maillard, J.-P., & Hasegawa, T. I. 1991, ApJ, 371, 342
- Noriega-Crespo et al. (2004) Noriega-Crespo, A., et al. 2004, ApJS, 154, in press
- Pendleton et al. (1994) Pendleton, Y. J., Sandford, S. A., Allamandola, L. J., Tielens, A. G. G. M., & Sellgren, K. 1994, ApJ, 437, 683
- Pontoppidan et al. (2003) Pontoppidan, K. M., Dartois, E., van Dishoeck, E. F., Thi, W.-F., & d’Hendecourt, L. 2003, A&A, 404, L17
- Prinn & Fegley (1989) Prinn, R. G., & Fegley, B. 1989, in: “Origin and Evolution of Planetary and Satellite Atmospheres”, eds. S. K. Atreya, J. B. Pollack, M. S. Matthews, The University of Arizona Press, p. 78
- Rothman et al. (2003) Rothman, L. S., et al. 2003, Journal of Quantitative Spectroscopy and Radiative Transfer, 82, 5
- Sandford & Allamandola (1988) Sandford, S.A., & Allamandola, L.J. 1988, Icarus, 76, 201
- Sandford et al. (1991) Sandford, S. A., Allamandola, L. J., Tielens, A. G. G. M., Sellgren, K., Tapia, M., & Pendleton, Y. 1991, ApJ, 371, 607
- Schutte et al. (1996) Schutte, W. A., Gerakines, P. A., Geballe, T. R., van Dishoeck, E. F., & Greenberg, J. M. 1996, A&A, 309, 633
- Spitzer (1978) Spitzer, L. 1978, Physical Processes in the Interstellar Medium (New York: Wiley)
- Spoon et al. (2001) Spoon, H. W. W., Keane, J. V., Tielens, A. G. G. M., Lutz, D., & Moorwood, A. F. M. 2001, A&A, 365, L353
- Tielens et al. (1991) Tielens, A.G.G.M., Tokunaga, A.T., Geballe, T.R., & Baas, F. 1991, ApJ, 381, 181
- Tielens & Whittet (1996) Tielens, A. G. G. M. & Whittet, D. C. B. 1996, IAU Symp. 178: Molecules in Astrophysics: Probes & Processes, 178, 45
- van der Tak et al. (2000) van der Tak, F.F.S., van Dishoeck, E.F., Evans, N.J., & Blake, G.A. 2000, ApJ, 537, 283
- White et al. (2000) White, G. J., et al. 2000, A&A, 364, 741
- Whittet et al. (1996) Whittet, D.C.B., Schutte, W.A., Tielens, A.G.G.M., Boogert, A.C.A., de Graauw, T., et al. 1996, A&A, 315, 357
- Willner et al. (1982) Willner, S. P., et al. 1982, ApJ, 253, 174
- Wilson & Rood (1994) Wilson, T.L., & Rood, R.T. 1994, ARA&A, 32, 191