Formation of Globular Clusters in Galaxy Mergers
Abstract
We present a high-resolution simulation of globular cluster formation in a galaxy merger. For the first time in such a simulation, individual star clusters are directly identified and followed on their orbits. We quantitatively compare star formation in the merger to that in the unperturbed galaxies. The merging galaxies show a strong starburst, in sharp contrast to their isolated progenitors. Most star clusters form in the tidal features. With a mass range of –, they are identified as globular clusters. The merger remnant is an elliptical galaxy. Clusters with different mass or age have different radial distributions in the galaxy. Our results show that the high specific frequency and bimodal distribution of metallicity observed in elliptical galaxies are natural products of gas-rich mergers, supporting a merger origin for the ellipticals and their globular cluster systems.
Subject headings:
galaxies: interactions — galaxies: star clusters — galaxies: starbursts — galaxies: evolution — stars: formation1. INTRODUCTION
Interactions and mergers drive galactic evolution and cause starbursts. In the past decade, the Hubble Space Telescope (HST) has unveiled evidence for the formation of massive star clusters or young globular clusters in merging galaxies, such as NGC 7252 (Whitmore et al. 1993), the Antennae Galaxy (Whitmore & Schweizer 1995), NGC 3597 (Holtzman et al. 1996), and NGC 3921 (Schweizer et al. 1996), as reviewed by Whitmore (2001).
There have been several theoretical models for the formation of globular clusters (GCs), including primary models where clusters form before galaxies (e.g Peebles & Dicke 1968), secondary models where clusters form with galaxies (e.g. Fall & Rees 1985; Harris & Pudritz 1994), tertiary models where clusters form after galaxies, such as in mergers (Ashman & Zepf 1992), and unified models (Elmegreen & Efremov 1997). Models have been reviewed by Harris (1991); Ashman & Zepf (1998), and Carney & Harris (2001). The HST observations have prompted particular interest in the merger scenario. There have been many numerical simulations of galaxy mergers (Toomre & Toomre 1972; White 1978; Farouki & Shapiro 1982; Barnes & Hernquist 1992; Hernquist 1992; Mihos & Hernquist 1994, 1996; Dubinski et al. 1999; Springel & White 1999; Springel 2000; Naab & Burkert 2001; Barnes 2002), but only a few focus on GC formation in mergers. These include semi-analytical models (Beasley et al. 2002), combined N-body and smoothed particle hydrodynamics (SPH) simulations (Bekki & Chiba 2002; Bekki et al. 2002), and adaptive-grid cosmological simulations (Kravtsov & Gnedin 2003). In these models individual GCs are not identified and directly followed. In addition, the star formation history of the merger is not compared to that of the isolated progenitors.
We here model GC formation in both isolated disk galaxies and their mergers using N-body/SPH simulations. Absorbing sink particles are used to directly represent individual massive young star clusters. In § 2 we briefly describe our computational method. We discuss the burst of GC formation during the merging event in § 3, and compare with the evolution of the isolated galaxy. We then focus on the cluster mass and age distribution at the end of the merger in § 4, and summarize in § 5.
2. NUMERICAL METHOD
We use the publicly available SPH code GADGET (Springel et al. 2001), and implement absorbing sink particles that do not interact hydrodynamically (Bate et al. 1995) to directly measure the mass of gravitationally collapsing gas. To represent GCs, we allow sinks to form when the local density exceeds 1000 cm-3 (Bromm & Clarke 2002). Our galaxy model consists of a dark matter halo, and a disk of stars and isothermal gas. We follow the analytical work by Mo et al. (1998) and the numerical implementation by Springel & White (1999) and Springel (2000). Our simulations meet three numerical criteria, the Jeans resolution criterion (Bate & Burkert 1997), the gravity-hydro balance criterion for gravitational softening (Bate & Burkert 1997), and the equipartition criterion for particle masses (Steinmetz & White 1997). We adopt a halo concentration parameter , a spin parameter , and Hubble constant km s-1 Mpc-1 (Springel 2000).
The galaxy model studied here initially has rotational velocity = 100 km s-1 at the virial radius where the overdensity is 200, and a virial mass of . Total mass in the disk and in the disk gas as fraction of the virial mass are and , respectively. An isothermal equation of state with sound speed km s-1 is used. The total particle number for each single galaxy is , with , , and for disk gas and stars, and halo dark matter, respectively. The corresponding gravitational softening lengths are kpc, kpc, and kpc. The spatial resolution of the gas is thus 10 pc, and the mass per gas particle is . This is two orders of magnitude better resolution than the models of Bekki et al. (2002).
We perform two simulations. One follows the evolution of the isolated galaxy described above, and the other is an equal-mass, head-on merger of two such galaxies. The two galaxies are on a parabolic orbit and are separated initially by a distance of 300 kpc. In the merger run, , with gas particles and corresponding other particle numbers. The simulations are followed for up to 5 Gyr.
3. STARBURSTS IN THE MERGING EVENT
3.1. Where Do Globular Clusters Form?
Our single galaxies begin marginally stable to gravitational instability (Rafikov 2001), with initial Toomre instability parameter for gas . Stars form slowly but steadily, mostly in the center. In the merger event, the galaxies first collide at Gyr, then separate to kpc at Gyr, fall back, and finally merge at Gyr. Vigorous starbursts occur in each of the two close encounters.
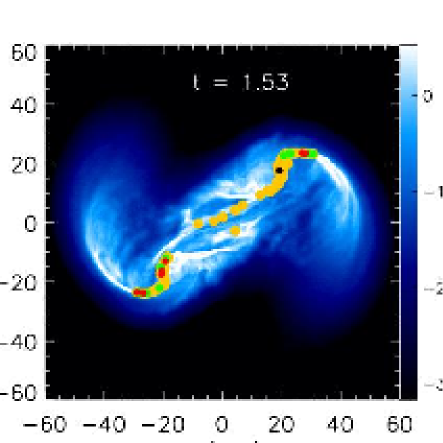
Most clusters form during the first close encounter at 1.4–1.7 Gyr. To estimate their stellar masses, we make the assumption that individual sink particles represent regions of dense molecular gas. Observations by Rownd & Young (1999) and Wong & Blitz (2002) suggest that the local star formation efficiency in molecular clouds remains roughly constant. We assume that 35% of the mass of each sink particle forms stars, and will show in future work that a range of 20–50% is consistent with the observed Schmidt law. Using this assumption, the cluster mass range is to . We therefore identify these clusters as newly formed GCs.
Figure 1 shows that during the first encounter GCs form in the extended tidal features where the gas reaches high density, in agreement with observations (Whitmore & Schweizer 1995; Zhang et al. 2001). The derived mass range agrees well with spectroscopic estimates by Mengel et al. (2002) of some young clusters in the Antennae Galaxy.
3.2. Comparison Between Merger and Isolated Galaxy
Figure 2 compares star formation in the isolated galaxy with the galaxy merger. In the isolated galaxy, stars start to form at Gyr when gravitational instability increases the gas density. The cluster number and mass slowly increase as the galaxy maintains marginal stability. During the merging event, the gas density is locally increased by shocks and tidal forces, leading to starburst behavior. The cluster formation rate increases dramatically, particularly in the first encounter when more gas is available. At the end of the simulation, for the isolated galaxy and 417 for the merger.
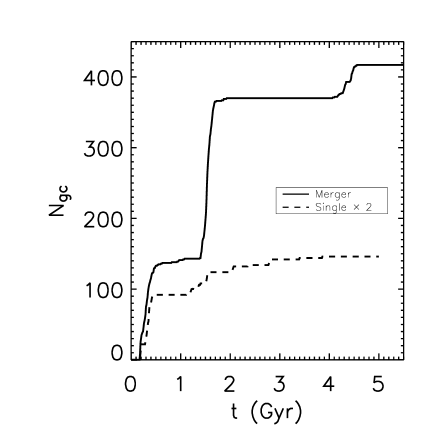

The specific frequency (Harris & van den Berg 1981) of GCs in a galaxy is , where is the total number of GCs, and the V-band absolute magnitude of the host galaxy, log(). We use the method of Bekki et al. (2002) to estimate in our models by assuming , as in the Milky Way. In order to account for the cluster destruction mechanisms described by Spitzer (1987); Gnedin & Ostriker (1997), and Fall & Zhang (2001), we assume a 10% survival rate of our clusters. Our final derived value of depends linearly on this. Each single galaxy has a stellar mass of , so we can derive mag, so . Similarly, the elliptical merger remnant has , which gives mag, and . These values are consistent with observations. For example, the Milky Way-like spiral M31 has (Barmby & Huchra 2001), while typical ellipticals have (Harris 1991; McLaughlin 1999). These estimates do depend on the stellar mass-to-light ratio of the galaxies (e.g. Larsen et al. 2002; Rhode & Zepf 2004) and survival rate of the clusters (Spitzer 1987; Gnedin & Ostriker 1997; Fall & Zhang 2001; Whitmore 2004). Nevertheless, they reflect the difference between isolated disk galaxies and mergers, and suggest that mergers can explain the considerably higher specific frequency of GCs observed in elliptical galaxies.
4. MERGER REMNANT
Star formation during the merger leads to rapid gas depletion. By Gyr the two merging galaxies have transformed into an elliptical galaxy, whose stellar distribution is shown in Figure 3. Three distinct populations of GCs form at different epochs, those formed during the two close encounters are almost coeval, as they form over a very short period during the encounters.
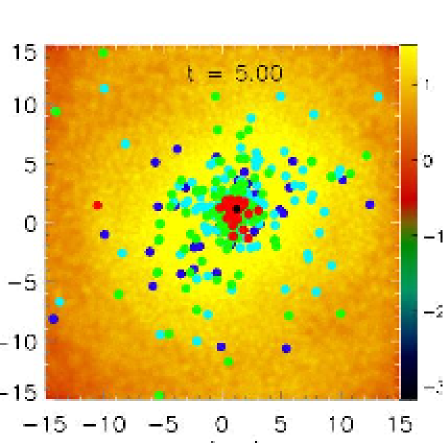
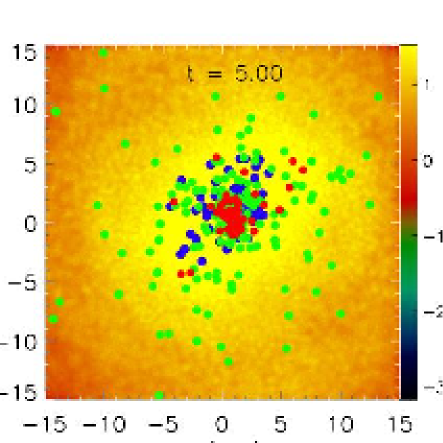
Figure 3 shows the GC system is centered on the stellar spheroid. Massive GCs are concentrated towards the center of the elliptical galaxy that remains after the merger, while less massive ones are found at greater radii as well. Old GCs formed prior to the first encounter and the youngest GCs formed in the second encounter are concentrated towards the center of the galaxy, while GCs formed in the first encounter are also found at large radii. The oldest GCs in our simulation are also the most massive, and quickly sink towards the center by dynamical friction. The youngest ones occur in the galactic center because remaining gas assembles there during the final merger. During the first encounter, on the other hand, GCs form in the tidal tails with greater angular momentum, and so have a broad radial distribution.
If we assume a metallicity-age relation such that older GCs have lower metallicities (Rich et al. 2001), we clearly see a bimodal metallicity distribution. Young, high-metallicity GCs are centrally concentrated, while older, lower-metallicity GCs extend to larger radii, in agreement with observations (Djorgovski & Meylan 1994). The isolated galaxy forms clusters slowly and steadily, so age, as well as metallicity, follow a smooth distribution. There is no bimodality. Our results thus support the arguments of Ashman & Zepf (1992) and Kundu & Whitmore (2001) that mergers are required to produce a bimodal distribution.
5. SUMMARY
We present high-resolution simulations of star cluster formation in both a single galaxy and a major merger, using a three-dimensional SPH code that includes absorbing sink particles to represent massive star clusters. This allows direct identification of individual clusters and tracking of their orbital evolution over several gigayears. The merging galaxies show bursts of massive star cluster formation, in sharp contrast to the steady but slow formation in an isolated galaxy. Most new clusters form in the tidal tails and bridges between the merging galaxies. They are identified as progenitors of globular clusters, although it should be emphasized that we do not include dynamical destruction of clusters (e.g. Spitzer 1987; Gnedin & Ostriker 1997; Fall & Zhang 2001) in the simulations. Dynamical destruction will change the number and mass of GCs, affecting our derived specific frequency (where we accounted for it very crudely) and spatial distribution. Inclusion of a destruction model to determine the evolution of our cluster particles will be necessary to fully address these questions.
The estimated specific globular cluster frequency in the elliptical galaxy resulting from the merger exceeds by a factor of 3 that in an isolated galaxy with the same parameters as the merging galaxies, most of the enhancement being in metal-rich GCs. This supports the idea that the higher of metal-rich GCs observed in ellipticals is produced by mergers. However, elliptical galaxies also show higher for metal-poor GCs. Early mergers could explain this, though other mechanisms have also been proposed (Rhode & Zepf 2004). Clusters formed during different phases of the merger have distinct radial distributions. The spatial distribution of metal-poor old clusters formed before the first encounter as well as of metal-rich younger clusters from the final encounter is centrally concentrated, while clusters formed in the first encounter are more widely dispersed. This suggests the observed multimodal metallicity distribution of globular clusters in elliptical galaxies is the direct result of merger processes.
References
- Ashman & Zepf (1992) Ashman, K. M., & Zepf, S. E. 1992 ApJ 384, 50
- Ashman & Zepf (1998) Ashman, K. M., & Zepf, S. E. 1998 Globular Cluster Systems (Cambridge University Press)
- Barmby & Huchra (2001) Barmby, P. & Huchra, J. P. 2001 AJ 122, 2458
- Barnes (2002) Barnes, J.E. 2002 MNRAS 333,481
- Barnes & Hernquist (1992) Barnes, J.E., & Hernquist, L. 1992 ARA&A 30, 705
- Bate et al. (1995) Bate, M., Bonnell, I., & Price, N. 1995 MNRAS 277, 362
- Bate & Burkert (1997) Bate, M. R. & Burkert, A. 1997 MNRAS 288, 1997
- Beasley et al. (2002) Beasley, M. A. et al. 2002 MNRAS 333, 383
- Bekki & Chiba (2002) Bekki, K. & Chiba, M. 2002 MNRAS 335, 1176
- Bekki et al. (2002) Bekki, K. et al. 2002 MNRAS 335, 1176
- Bromm & Clarke (2002) Bromm, V. & Clarke, C. 2002 ApJ 566, 1
- Carney & Harris (2001) Carney, B. W., & Harris, W. E. 2001 Star Clusters (Springer)
- Djorgovski & Meylan (1994) Djorgovski, S. & Meylan, G. 1994 ApJ 108, 1292
- Dubinski et al. (1999) Dubinski, J., Mihos, C.J., & Hernquist, L. 1999 ApJ 526, 607
- Elmegreen & Efremov (1997) Elmegreen, B. G., & Efremov, Y. N. 1997 ApJ 480, 235
- Fall & Rees (1985) Fall, S. M., & Rees, M. J. 1985 ApJ 298, 18
- Fall & Zhang (2001) Fall, S. M., & Zhang, Q. 2001 ApJ 561, 751
- Farouki & Shapiro (1982) Farouki, R., & Shapiro, S.L. 1982 ApJ 259, 103
- Gnedin & Ostriker (1997) Gnedin, O. Y. & Ostriker, J. P. 1997 ApJ 474, 223
- Harris (1991) Harris, W. E., 1991 ARA&A 29, 543
- Harris & Pudritz (1994) Harris, W. E. & Pudritz, R. E. 1994 ApJ 429, 177
- Harris & van den Berg (1981) Harris, W. E. & van den Berg, S., 1981 AJ 86, 1627
- Hernquist (1992) Hernquist, L. 1992 ApJ 400, 460
- Holtzman et al. (1996) Holtzman, J.A. et al. 1996 AJ 112, 416
- Klessen & Burkert (2000) Klessen, R. S., & Burkert, A., 2000 ApJS, 128, 287
- Kravtsov & Gnedin (2003) Kravtsov, A. V. & Gnedin, O. Y. 2003 astro-ph/0305199
- Kundu & Whitmore (2001) Kundu, A. & Whitmore, B. C. 2001 AJ 121, 2950
- Larsen et al. (2002) Larsen, S. S. et al. 2002 AJ 124, 2615
- McLaughlin (1999) McLaughlin, D. E. 1999 AJ, 117, 2398
- Mengel et al. (2002) Mengel, S. et al. 2002 A&A 383, 137
- Mihos & Hernquist (1994) Mihos, C.J. & Hernquist, L. 1994 ApJ 427, 112
- Mihos & Hernquist (1996) Mihos, C.J. & Hernquist, L. 1996 ApJ 464, 641
- Mo et al. (1998) Mo, H. J., Mao, S., & White, S. D. M. 1998 MNRAS 295, 319
- Naab & Burkert (2001) Naab, T. & Burkert, A. 2001 ApJ 555, 91
- Peebles & Dicke (1968) Peebles, P. J. E., & Dicke, R. H. 1968 ApJ 154, 891
- Rafikov (2001) Rafikov, R. R. 2001 MNRAS 323, 2001
- Rich et al. (2001) Rich, R. M., Shara, M. M. & Zurek, D. 2001 AJ 122, 842
- Rhode & Zepf (2004) Rhode, K. L. & Zepf, S. E. 2004 AJ 127, 302
- Rownd & Young (1999) Rownd, B. K., & Young, J. S. 1999 AJ 118, 670
- Schweizer et al. (1996) Schweizer, F. et al. 1996 AJ 112, 1839
- Spitzer (1987) Spitzer, L., Jr. 1987 Dynamical Evolution of Globular Clusters (Princeton: Princeton Univ. Press)
- Springel (2000) Springel, V. 2000 MNRAS 312, 859
- Springel & White (1999) Springel, V. & White, S. M. D. 1999 MNRAS 307, 162
- Springel et al. (2001) Springel, V., Yoshida, N. & White, S. D. M. New Astron. 6, 79
- Steinmetz & White (1997) Steinmetz, M. & White, S. D. M. 1997 MNRAS 288, 545
- Toomre & Toomre (1972) Toomre, A., & Toomre J. 1972 ApJ 178, 623
- White (1978) White, S.D.M. 1978 MNRAS 184, 185
- Whitmore et al. (1993) Whitmore, B. et al. 1993 AJ 106, 1354
- Whitmore & Schweizer (1995) Whitmore, B. & Schweizer, F. 1995 AJ 109, 960
- Whitmore et al. (1999) Whitmore, B. et al. 1999 AJ 118, 1551
- Whitmore (2001) Whitmore, B. astro-ph/0012546
- Whitmore (2004) Whitmore, B. astro-ph/0403709
- Wong & Blitz (2002) Wong, T. & Blitz, L. 2002 ApJ 569, 157
- Zhang & Fall (1999) Zhang, Q. & Fall, S. M. 1999 ApJ 527, 81
- Zhang et al. (2001) Zhang, Q., Fall, S. M. & Whitmore, B. 2001 ApJ 561, 727