The potential of INTEGRAL for the detection of high redshift GRBs
We discuss INTEGRAL’s capabilities to detect a high redshift population of Gamma-Ray Bursts (GRBs) in comparison to other high-energy missions. Emphasis is done on the study of the relative capabilities of IBIS on board INTEGRAL with respect to SWIFT and HETE 2 for detecting a high redshift population of GRBs. We conclude that, if the GRB rate is proportional to the star formation rate, INTEGRAL’s capabilities for studying GRBs are complementary to the ones of missions like SWIFT and HETE 2, specially devoted to prompt localisations of GRBs. Whereas SWIFT and HETE 2 would detect a higher number of GRBs than INTEGRAL, IBIS might be able to detect high redshift () GRBs, unreachable for SWIFT and HETE 2. We discuss the relevance of performing near-infrared (NIR) observations of the INTEGRAL GRBs and the strategy that large class telescopes might follow.
Key Words.:
gamma rays: bursts1 Introduction
Gamma-Ray Bursts (GRBs) appear as brief ( s duration s) flashes of cosmic high-energy photons, emitting the bulk of their energy above MeV. Among the thousands of GRBs detected in -rays since 1967 (Klebesadel et al. Kleb73 (1973)) only GRBs have been identified at optical wavelengths111See http://www.mpe.mpg.de/jcg/grbgen.html.. For of them spectroscopic redshifts have been measured, ranging from (Galama et al. Gala98 (1998)) to (Andersen et al. Ande00 (2000)).
A canonical model has emerged for powering long GRBs (durations s): collapse of a massive star onto a black hole. This leads to an intense flash of -ray photons followed by an expanding fireball which emits radiation at lower frequencies (Woosley Woos93 (1993)). The spectroscopic association of GRB 030329 with the type Ic SN 2003dh supports strongly this framework (Hjorth et al. Hjor03 (2003); Stanek et al. Stan03 (2003)). Short GRBs (durations s) have not shown yet a conclusive optical counterpart (see Castro-Tirado et al. Cast02 (2002) for a further discussion).
We know today that most long duration GRBs originate at . In fact, it is thought that their intrinsic brightness would allow us to detect these events at epochs corresponding to the formation of the earliest stellar populations. Thus, they may be used as probes into the first stages of star formation and their spectra may reveal the early heavy-element enrichment of the interstellar medium (ISM). GRBs originated by the exploding primitive population of stars are suggested to be detectable up to redshifts (Lamb & Reichart Lamb00 (2000)).
ESA’s INTEGRAL satellite offers unique capabilities for the detection of GRBs thanks to its high sensitivity and imaging capabilities at -rays, -rays and optical frequencies. INTEGRAL is the first -ray spacecraft that combines imaging instruments of high precision and a continuous real time telemetry link. Developments in the GRB field over the past few years have made increasingly clear that INTEGRAL, and specially the IBIS222Imager on board the INTEGRAL satellite. -ray imager, could make a significant contribution. IBIS is the coded mask telescope on board INTEGRAL dedicated to imaging over a wide ( keV MeV) energy range (Ubertini et al. Uber03 (2003)). To date, neither of the three classical INTEGRAL GRBs (considering GRB 031203 as an -ray flash) with optical counterparts identified have had their redshift measured (Götz et al. Gotz03 (2003); Castro-Tirado et al. Cast03 (2003); Masetti et al. Mase04 (2004)).
In Sect. 2 we perform a rough comparison of INTEGRAL’s sensitivity with respect to other -ray and -ray missions-instruments. Sect. 3 studies in more detail the capabilities of the most sensitive high-energy missions-instruments (INTEGRAL/IBIS, HETE 2/WXM and SWIFT/BAT) to detect high redshift GRBs. Further, in Sect. 4 we focus on the INTEGRAL/IBIS and SWIFT/BAT relative number of high redshift GRB detections. As an ado, Sect. 5 makes emphasis on the relevance of the near-infrared (NIR) observations to detect high redshift afterglows. Last, Sect. 6 presents the conclusions of our study.
2 Sensitivity comparisons: INTEGRAL expectations
In Table 1 we provide the main performances of a number of different space missions/instruments with capabilities for GRB research. The missions/instruments are divided in two groups depending on their energy range. In the first group the INTEGRAL/IBIS sensitivity is normalized with respect to the Burst Alert Telescope (BAT) -ray instrument on board SWIFT.333Launch scheduled for the second half of 2004. Hereafter, when we refer to SWIFT we will focus only on BAT (which provides the GRB triggers for the mission) and not on the -ray and /Optical Telescopes on board SWIFT. See Gehrels et al. (Gehr04 (2004)) for further details. In the second group the INTEGRAL/JEM-X444Joint European Monitor for -rays, on board INTEGRAL. and SAX/WFC555Wide Field Cameras on board BeppoSAX. rough sensitivities are given compared to the HETE 2/WXM666The Wide -ray Monitor is the most sensitive instrument on board HETE 2. The rest of the HETE 2 instrumentation will not be considered. one. Because we concentrate on determining the relative number of detections for several missions/instruments (see Sect. 4) we will not perform a dedicated calculation of the individual instrumental sensitivities; that goes beyond the scope of our study (see Band Band03 (2003) for a detailed analysis).
| Mission/Instrument | Area | Coverage | Energy band | Orbit | Relative |
| cm2 | of str. | (keV) | efficiency | sensitivity† | |
| SWIFT/BAT | 5200 | 15 to 150 | 0.6 | 1.0 | |
| INTEGRAL/IBIS (ISGRI) | 3000 | 15 to 150 | 0.8 | 3.0 | |
| HETE 2/WXM | 360 | 13 | 2 to 25 | 0.5 | 1.0 |
| INTEGRAL/JEM-X | 1000 | 0.1 | 2 to 35 | 0.8 | 19.0 |
| SAX/WFC | 530 (2) | 2 (2) | 2 to 30 | 0.5 | 3.1 |
| Half coded field of view (FOV). | |||||
| Estimate based on the recipe. | |||||
In order to compare the sensitivities of different missions Band (Band03 (2003)) made emphasis on the need of expressing them in terms of a common energy band. Band (Band03 (2003)) determined the peak photon flux threshold (hereafter named , measured in ph cm-2 s-1), for several detectors, including HETE 2/WXM, SAX-WFC and SWIFT/BAT. INTEGRAL/IBIS and INTEGRAL/JEM-X were not considered in that study. In Band (Band03 (2003)) all the detection thresholds are normalised to the keV energy band, making several assumptions about the detectors’ properties (accumulation time, detector response matrix, background model) and GRBs’ spectra.777In Band (Band03 (2003)) the GRB spectra are described by the Band function (Band et al. Band93 (1993)), where the photon number flux is given by: where , and determines the maximum of given by . and are the photon spectral indexes at frequencies below and above .
Based on Figs. 5 and 7 in Band (Band03 (2003)) we assumed detection thresholds of ph cm-2 s-1 for HETE 2/WXM and ph cm-2 s-1 for SWIFT/BAT. These two thresholds are valid for a broad range of values of around several hundreds of keV, (a typical range for GRBs) and refer to the keV energy band. We note that is the spectral maximum in the (or equivalent ) representation. Many studies have reported results in the keV band, mainly because this band corresponded to the sensitivity range of BATSE888The Burst And Transient Source Experiment; it operated on board the Compton Gamma-Ray Observatory between 1991 and 2000.. Thus, in the present work we decided to carry out the sensitivity comparisons in a common keV reference energy band. The election of another energy band is arbitrary and it would not affect our results, since it would only introduce a constant multiplicative factor on the values calculated for each mission-instrument (as well as on the luminosity, , as it will be shown in equation 2).
Setting (see Sect. 3), we calculated a flux ratio . For a power law spectrum this detection threshold ratio is independent of (which would correspond to a constant straight line in Fig. 1 of Band Band03 (2003)). By transforming the assumed keV thresholds, the derived keV sensitivities for HETE 2/WXM and SWIFT/BAT become ph cm-2 s-1 and ph cm-2 s-1, respectively. We note that those sensitivity values refer to the peak flux.
Estimates carried out for the IBAS999INTEGRAL Burst Alert System sensitivity yield a threshold of ph cm-2 s-1 for INTEGRAL/IBIS (the ISGRI part) in the keV energy band (Mereghetti et al. Mere03 (2003)). Hereafter we assume a conservative INTEGRAL/IBIS sensitivity limit of ph cm-2 s-1, which corresponds to ph cm-2 s-1, assuming . Therefore, the INTEGRAL/IBIS capabilities to detect high redshift GRBs relative to SWIFT/BAT (presented in Sect. 4) have to be considered as a pessimistic estimate of the actual INTEGRAL/IBIS potential.
An alternative, simplified way to verify the photon peak flux thresholds for the instruments not considered by Band (Band03 (2003)) (like INTEGRAL/IBIS and INTEGRAL/JEM-X) would be to assume that the sensitivity threshold for a GRB is proportional to the square-root of the background count rate and inversely proportional to the square-root of the detector area. Thus we have , where is the sky coverage and is the detector area. This assumption would yield a sensitivity ratio of between INTEGRAL/IBIS and SWIFT/BAT (see Table 1) and, therefore, a threshold of ph cm-2 s-1.
In principle, the most reliable comparison that can be done in Table 1 is between SWIFT/BAT and INTEGRAL/IBIS (the ISGRI part), because they are based on very similar detector technologies (CdZnTe in SWIFT/BAT, CdTe in INTEGRAL/IBIS) and share a similar energy band. This simple estimate is a factor of two lower than the ph cm-2 s-1 threshold assumed for INTEGRAL/IBIS. Hence, it supports the use of this threshold as a conservative upper limit of the real INTEGRAL/IBIS sensitivity.
From the above estimates it is evident that INTEGRAL/IBIS will be the most sensitive GRB detector (at least in the 15 150 keV energy band) ever flown and not likely to be matched, sensitivity wise, by any other mission within the coming decade.
Rescaling the HETE 2/WXM threshold with the recipe we obtain a sensitivity of ph cm-2s-1. However, the difference in detector technologies of INTEGRAL/JEM-X with respect to HETE 2/WXM makes this number an uncertain estimate of the actual INTEGRAL/JEM-X sensitivity. Furthermore, the on flight INTEGRAL/JEM-X performances have been changed during the first months of the INTEGRAL mission, so its real sensitivity is well above ph cm-2s-1. Besides, the reduced number of bursts that INTEGRAL/JEM-X will detect (a very few a year) does not support performing a specific calculation aimed at studying its capabilities for high redshift bursts.
3 Detectability of a high redshift population of GRBs
We have selected the most sensitive missions-instruments (present: INTEGRAL/IBIS, HETE 2/WXM, and future: SWIFT/BAT) to calculate their capabilities of detecting a high redshift population of bursts. To estimate the number of GRBs that these missions-instruments will detect we assume that:
-
•
GRB spectra can be described by power laws (). After exploring the impact of on the final results (which do not change qualitatively) and for simplicity, we have assumed a value of , typical of GRBs (van Paradijs et al. Vanp00 (2000)).
-
•
The GRB rate is proportional to the star formation rate (SFR) in the Universe. The SFR considered is the one given by Rowan-Robinson (Rowa99 (1999), Rowa01 (2001)) for and the one calculated by Gnedin & Ostriker (Gned97 (1997)) for (see Fig. 1).

Figure 1: The plot shows the SFR in the Universe as a function of the redshift. The dashed line represents the SFR derived from numerical simulations for (Gnedin & Ostriker Gned97 (1997)). The solid line shows the SFR at the region based on observational estimates (Rowan-Robinson Rowa99 (1999), Rowa01 (2001)). The transition between the two regions has been smoothed. -
•
The GRB peak (isotropic) photon luminosity function is given by:
being the peak photon luminosity and the luminosity function index. , determine the width of the luminosity function. We have assumed a value of .
-
•
Although the effect of several Universe models has been checked, we choose to use the most popular cosmological parameters in this paper: , , H km s-1 Mpc-1.
For the above assumptions the differential GRB detection rate at a given peak photon flux in a detector (ph cm-2s-1) is given by the following convolution integral:
| (1) |
where is the efficiency of the orbit, is the instrumental coverage of the sky and is the GRB detection rate if they were standard candles, i.e., , being the comoving volume. The value of the proportionality constant is unknown. Fig. 2 displays as well as the detection thresholds of several high-energy missions-instruments.

The relationship between , and is given by the following expression:
| (2) |
where is the comoving distance. In our calculations different values of , Lmin, Lmax, , and are considered. Variations of , , and do not change the final result qualitatively. On the other hand, the variations of , are more relevant for determining the number of high redshift GRB detections. We consider the pessimistic case of a relatively faint and narrow luminosity function defined by ph s-1 and ph s-1. The and values used in our study correspond to the narrowest among the ones used by Lamb & Reichart (Lamb00 (2000)), and consistent with the observed peak photon luminosity distribution (the measured is at least times wider; Stern et al. Ster02 (2002))101010 Our and values are also in agreement with the empirical peak photon luminosity function used as reference by Lamb & Reichart (Lamb00 (2000)); . The assumption of a wider would broaden the Gaussian like curves (both solid and dashed) displayed in Fig. 2, extending their tails to higher values and therefore enhancing the number of GRBs detected at very high redshift.
We can calculate the contribution to (1) by GRBs with redshift larger than (see dashed curves of Fig. 2), using:
where is a step function that vanishes unless . Obviously, , and . Last, we can calculate the number of GRBs detected above a given instrumental peak photon flux threshold that have redshifts larger than :
Not knowing the proportionality constant of (1), we can not derive an absolute value for . However, we can determine the relative quantity , which provides us the proportion of detections that have a redshift larger than (see Fig. 3).

4 INTEGRAL/IBIS vs SWIFT/BAT; comparison of the number of GRB detections
Fig. 3 shows the relative number of detections (given by ), as a function of the redshift, for HETE 2/WXM, SWIFT/BAT and INTEGRAL/IBIS. As it is shown, of the GRBs detected by INTEGRAL/IBIS will have a redshift larger than . For SWIFT/BAT the population will be of the total number of detections. In the case of INTEGRAL/IBIS the tail of extends even up to redshifts of . SWIFT/BAT and HETE 2/WXM will detect a closer population of bursts, specially HETE 2/WXM. HETE 2/WXM is the less sensitive GRB mission, being constrained to detect bursts with redshifts . This prediction is in agreement with the maximum redshift measured for a HETE 2/WXM GRB.111111Among the 12 HETE 2/WXM GRBs with confirmed spectroscopic redshifts to date, the maximum redshift is reached for GRB 030323 at (Vreeswijk et al. Vree04 (2004)). Therefore we will not consider HETE 2/WXM in the following study, aimed at calculating the relative number of GRB detections as a function of the redshift. We will concentrate on comparing INTEGRAL/IBIS and SWIFT/BAT capabilities. Besides, as we previously noted, the similar energy range and detector technologies of INTEGRAL/IBIS and SWIFT/BAT suggest a reliable comparison.
For determining the relative number of detections between two missions, A and B, the following calculation has to be performed:
| (3) |
This function will give the relative number of GRB detections with . We have applied (2) to derive the detection ratio between INTEGRAL/IBIS and SWIFT/BAT as a function of the GRB population redshift () .
As it is shown in Fig. 4, for . In other words, at low redshifts the large field of view (FOV) of SWIFT/BAT, in comparison to INTEGRAL/IBIS, dominates the number of detections. On the other hand, for , INTEGRAL/IBIS sensitivity becomes the dominating factor and . Thus, from the point of view of the ground based strategy of detecting afterglows, it might be more efficient to observe INTEGRAL/IBIS GRBs than to observe SWIFT/BAT bursts. If we are interested in using GRBs to study the reionisation epoch that occurred at (Loeb & Barkana Loeb01 (2001)), then it would be relevant to prioritise the follow up of INTEGRAL/IBIS GRBs. Nonetheless we emphasise that INTEGRAL/IBIS high redshift detectability predictions are based on low number statistics, so they are subjected to large fluctuations.
The self consistency of our procedure can be checked by studying the prediction of expression (3) for the particular case when . If we consider , then gives us the fraction of GRBs detected with , i.e., considering all the detections independently of their redshifts. We predict a value of for the fraction of the total number of GRBs detected by INTEGRAL/IBIS compared to SWIFT/BAT (see Fig. 4 at ). The number of GRBs currently detected by INTEGRAL/IBIS is GRB per month (Mereghetti et al. Mere03 (2003)), whereas the last updated estimates for the SWIFT/BAT detection rate yield GRBs per year (Heyl Heyl03 (2003)). This gives a fraction of for the number of detected GRBs, in agreement with our prediction.
Although INTEGRAL/JEM-X FOV and sensitivity are less suitable than the ones of INTEGRAL/IBIS to detect GRBs, the spectral peak of the high redshift GRBs (usually at keV) will be in the detection range of INTEGRAL/JEM-X. So given that INTEGRAL/JEM-X is co-aligned with INTEGRAL/IBIS, it might be also useful to detect the redshifted prompt -ray component.

5 NIR observations for INTEGRAL GRBs
The most significant inconvenience to follow up INTEGRAL GRB afterglows is the large fraction of the mission’s time devoted to scan the extincted Galactic centre/plane. An additional problem (not specific to INTEGRAL like the previous one) for detecting high redshift GRBs comes from the Ly- blanketing effect that strongly attenuates the radiation observed at Å. Both drawbacks can be mitigated if ground based searches are carried out in the NIR, specially in the -band, where the Galactic extinction drops by a factor compared to the optical, and the Ly- blanketing problem is eliminated up to very high redshifts ().
There are further advantages to searching for high redshift afterglows in the NIR. Because of their fading behaviour (typically, GRB afterglows decay following a power law of the form , where is the time since the onset of the -ray event and the decay index) the time dilation effect increases the observed flux at a fixed time of observation after the GRB. Thus current and future ground based NIR facilities could be able to detect high redshift afterglows that are invisible in the optical bands.
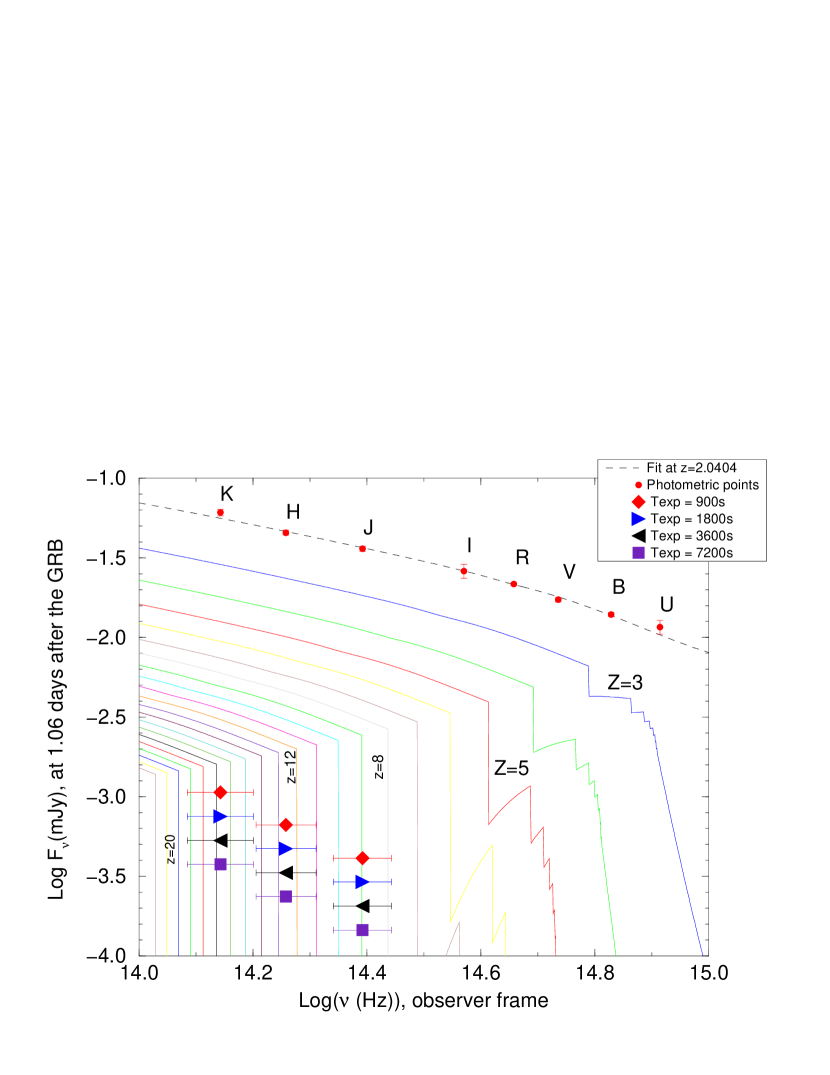
As an example, in Fig. 5 we display the very well sampled spectral energy distribution (SED) of the GRB 000301c afterglow (Jensen et al. Jens01 (2001)) for different redshifts, once the Ly- blanketing absorption has been modeled (Madau Mada95 (1995)). The photometric point flux densities (; see dashed line in Fig. 5) have been fitted following an expression of the form , where is the afterglow power law spectral index and is the absorption in the GRB host galaxy at a frequency of . has been parameterised in terms of following a typical SMC extinction law (Pei Pei92 (1992)). For illustration purposes we have overplotted, for different exposure times, the -band 5 sensitivities foreseen for the Espectrógrafo Multiobjeto Infrarrojo (EMIR) (Balcells Balc98 (1998)), currently being build for the 10 m Gran Telescopio Canarias (GTC) (Rodríguez Espinosa et al. Rodr98 (1998))121212For additional information, please, visit the following sites: http://www.ucm.es/info/emir/index_e.html, and also: http://www.gtc.iac.es/..
We would like to emphasise several points. First, this simple redshifting exercise does not require any assumption on the star formation rate, luminosity function, etc…Second, the GRB 000301c afterglow was not specially bright, so an intense afterglow (like GRB 990123; Castro-Tirado et al. Cast99 (1999)) could be detectable even at higher redshifts. Third, the photometric points displayed in the figure correspond to a fairly late epoch observation (they were acquired days after the burst, time measured in the observer’s frame), so afterglows observed a few hours (even minutes) after the burst would be reachable by smaller facilities (i.e., NIR robotic telescopes like REM; Zerbi et al. Zerb01 (2001), Zerb03 (2003)).
As it is shown in Fig. 5, rapid NIR observations of afterglows performed with 10 m class telescopes (e.g., the GTC equipped with EMIR) would be dominated by the Ly- blanketing effect since, above a given exposure time threshold ( s for the particular case of GRB 000301c and the GTC), the detectability is basically independent of the exposure time employed in the observations.
At high redshifts the observer would be sampling the part of the afterglow synchrotron spectrum where the extinction of the GRB environment is expected to be severe. Thus one of the mayor problems to predict the NIR detectability of a high redshift afterglow would come from the, so far unknown, extinction law and dust content describing both the local GRB environment and the large scale line of sight properties within the host galaxy. Furthermore, the opacity in the environment close to the GRB progenitor might be time dependent. Hence, a detailed quantitative prediction of the number of afterglows detected in the NIR (beyond the scope of this work) would require modeling the physical processes describing the absorption of the afterglow radiation and its evolution at different scales (from several AU to kpc) around the GRB progenitor.
6 Discussion and conclusions
In the present paper we study the capabilities of several missions-instruments to detect high redshift GRBs. At low and moderately high redshifts () the large FOV of SWIFT/BAT, compared to the instrumentation on board INTEGRAL, dominates the number of GRB detections. Nonetheless, the better sensitivity of IBIS makes INTEGRAL more efficient detecting GRBs beyond .
In the most popular cosmological models, the first sources of light began at a redshift of and reionised most of the Universe by (Loeb & Barkana Loeb01 (2001)). Thus the study of the Ly- forest, present in the high redshift INTEGRAL/IBIS afterglow spectra, might constrain the epoch of such reionisation (Gunn & Peterson Gunn65 (1965)), probing the ionisation state of the intergalactic medium (IGM) as a function of redshift. According to our estimates this kind of studies will be less productive if SWIFT/BAT (even more HETE 2/WXM), rather than INTEGRAL/IBIS, GRBs are followed up.
Further, optical/NIR spectroscopy of high redshift afterglows would provide additional information on the primitive IGM and ISM. High resolution spectroscopy of high redshift afterglows might reveal metal absorption lines, which could trace the metal enrichment history of the Universe. In principle this is the same technique as the one used for studying the damped Ly- systems (DLAs), which are located in the line of sight of quasars. However GRBs are cleaner probes than quasars, because a brief phenomenon such as a GRB would not modify the state of the environment at large distances as quasars do (the Strömgren sphere of high redshift quasars is of the order of Mpc; White et al. Whit03 (2003)). GRBs would allow to study the ISM of basically unaltered host galaxies, highly ionised if they had harboured a quasar during at least one million years. Moreover, GRBs are brighter (although for a short time) than quasars, so GRBs can probe the ISM of dustier galaxies.
Theoretical studies show that the birthrate of Population III stars produces a peak in the SFR in the Universe at redshifts , while the birthrate of Population II stars produces a much larger and broader peak at redshifts (Valageas & Silk Vala99 (1999)). If GRBs are produced by the collapse of massive stars, they are expected to occur at least at and possibly up to . The mere detection of very high redshift GRBs would give us for the first time direct confirmation of the existence of the earliest stellar generations.
Rapid NIR observations are a complementary strategy to study high redshift INTEGRAL/IBIS GRBs. -band observations performed with current and planned ground based NIR facilities might detect GRBs up to the theoretical limit imposed by the Ly- blanketing (). Realistically however the upper limit ought to be decreased due to possible absorption present in the GRB host galaxy.
In conclusion, the INTEGRAL/IBIS’s capabilities for studying GRBs are complementary to the ones of missions-instruments like SWIFT/BAT and HETE 2/WXM, specially devoted to prompt localizations of GRBs. Whereas SWIFT/BAT and HETE 2/WXM would detect more GRBs than INTEGRAL/IBIS, the latter might detect high redshift GRBs unreachable to the earlier. Future works might invert the logical outflow followed in the present paper. Once spectroscopic redshifts have been measured for a large sample of GRBs (and therefore the number of detected GRBs as a function of redshift is known), the equations could be inverted in order to obtain the SFR evolution with redshift. INTEGRAL, and specially IBIS, could be a very valuable tool to trace the SFR rate in the early Universe.
Acknowledgments
We thank our anonymous referee for fruitful and constructive comments. We are very grateful to David L. Band for helpful information used to determine the instrumental thresholds.
References
- (1) Andersen, M.I., Hjorth, J., Pedersen, H., et al. 2000, A&A, 364, L54.
- (2) Balcells, M., 1998, Ap&SS, 263, 361.
- (3) Band, D.L., Matteson, J., Ford, L., et al. 1993, ApJ, 413, 281.
- (4) Band, D.L., 2003, ApJ, 588, 945.
- (5) Castro-Tirado, A.J., Zapatero-Osorio, M.R., Caon, N., et al. 1999, Science, 283, 2069.
- (6) Castro-Tirado, A.J., Castro Cerón, J.M., Gorosabel, J., et al. 2002, A&A, 393, L55.
- (7) Castro-Tirado, A.J., Gorosabel, J., Guziy, S., et al. 2003, A&A, 411, L315.
- (8) Galama, T.J., Vreeswijk, P.M., van Paradijs, J., et al. 1998, Nature, 395, 670.
- (9) Gehrels, N., Chincarini, G., Giommi, P., et al. 2004, ApJ, in press, [astro-ph/0405233].
- (10) Gnedin, N.Y., & Ostriker, J.P., 1997, ApJ, 486, 581.
- (11) Götz, D., Mereghetti, S., Hurley, K., et al. 2003, A&A, 409, 831.
- (12) Gunn, J.E., & Peterson, B.A., 1965, ApJ, 142, 1633.
- (13) Heyl, J.S., 2003, ApJ, 592, 401.
- (14) Hjorth, J., Sollerman, J., Møller, P., et al. 2003, Nature, 423, 847.
- (15) Jensen, B.L., Fynbo, J.P.U., Gorosabel, J., et al. 2001, A&A, 370, 909.
- (16) Klebesadel, R.W., Strong, I.B., &, Olson, R.A., 1973, ApJ, 182, L85.
- (17) Lamb, D.Q., & Reichart, D.E., 2000, ApJ, 536, L1.
- (18) Loeb, A., & Barkana, R., 2001, ARA&A, 39, 19.
- (19) Madau, P., 1995, ApJ, 441, 18.
- (20) Masetti, N., Palazzi, E., Rol, E., et al. 2004, GCN Circ. # 2515.
- (21) Mereghetti, S., Götz, D., Borkowski, J., Walter, R., & Pedersen, H., 2003, A&A, 411, L291.
- (22) Pei, Y.C., 1992, ApJ, 395, 130.
- (23) Rodríguez Espinosa, J.M., Álvarez, P., & Sánchez, F., 1998, Ap&SS, 263, 355.
- (24) Rowan-Robinson, M., 1999, Ap&SS, 266, 291.
- (25) Rowan-Robinson, M., 2001, ApJ, 549, 745.
- (26) Stanek, K.Z., Matheson, T., Garnavich, P.M., et al. 2003, ApJ, 591, L17.
- (27) Stern, B.E., Tikhomirova, Ya., & Svensson, R., 2002, ApJ, 573, 75.
- (28) Ubertini, P., Lebrun, F., Di Cocco, G., et al. 2003, A&A, 411, L131.
- (29) Valageas, P., & Silk, J., 1999, A&A, 347, 1.
- (30) van Paradijs, J., Kouveliotou, C., & Wijers, R.A.M.J., 2000, ARA&A, 38, 379.
- (31) Vreeswijk, P.M., Ellison, S.L., Ledoux, C., et al. 2004, A&A, 419, 927.
- (32) White, R.L., Becker, R.H., Fan, X., & Strauss, M.A., 2003, AJ, 126, 1.
- (33) Woosley, S.E., 1993, ApJ, 405, 273.
- (34) Zerbi, F.M., Chincarini, G., Ghisellini, G., et al. 2001, AN, 322, 275.
- (35) Zerbi, F.M., Chincarini, G., Ghisellini, G., et al. 2003, SPIE, 4841, 737.