THE MISSING LUMINOUS BLUE VARIABLES AND THE BISTABILITY JUMP
Abstract
We discuss an interesting feature of the distribution of luminous blue variables (LBVs) on the H-R diagram, and we propose a connection with the bistability jump seen in the winds of early-type supergiants. There appears to be a deficiency of quiescent LBVs on the S Doradus instability strip at luminosities between 5.6 and 5.8. The upper boundary, interestingly, is also where the temperature-dependent S Doradus instability strip intersects the bistability jump at about K. Due to increased opacity, winds of early-type supergiants are slower and denser on the cool side of the bistability jump, and we postulate that this may trigger optically-thick winds that inhibit quiescent LBVs from residing there. We conduct numerical simulations of radiation-driven winds for a range of temperatures, masses, and velocity laws at =5.7 to see what effect the bistability jump should have. We find that for relatively low stellar masses the order of magnitude increase in the wind density at the bistability jump leads to the formation of a modest to strong pseudo photosphere that might alter a star’s apparent position on the HR diagram. The effect is strongest for LBVs approaching 10 M⊙, where the pseudo-photospheres are sufficiently extended to make an early B-type star appear as a yellow hypergiant. Thus, the proposed mechanism will be most relevant for LBVs that are post-red supergiants (curiously, the upper boundary at 5.8 coincides with the upper luminosity limit for red supergiants). Further work is obviously needed, especially with regard to a possible evolutionary connection between the “missing” LBVs and the most luminous red supergiants and yellow hypergiants. Specifically, yellow hypergiants like IRC+10420 and Cas occupy the same luminosity range as the “missing” LBVs, and show apparent temperature variations at constant luminosity. If these yellow hypergiants do eventually become Wolf-Rayet stars, we speculate that they may skip the normal LBV phase, at least as far as their apparent positions on the HR diagram are concerned.
1 INTRODUCTION
The post-main sequence evolution of massive stars with is very different from that of stars with lower mass, and is still poorly understood. An important difference observationally is that massive stars evolve at nearly constant bolometric luminosity, traveling back and forth across the upper Hertzsprung-Russel diagram (HRD). Unlike low-mass stars, two stars at the same position on the upper HRD may be in different stages of their lives, sometimes even on the same evolutionary track, so observationally the situation can be misleading. Many evolutionary sequences have been proposed to explain a star’s journey from the main-sequence to the He-rich and mass-depleted Wolf-Rayet (WR) phase, including transition phases when a star is classified as a blue supergiant (BSG), red supergiant (RSG), yellow hypergiant (YHG), B[e] supergiant, P Cygni-type star, Of star, WNL star, etc. (see reviews by Chiosi & Maeder 1986; Langer 1989; Langer et al. 1994; de Jager 1980). Post-main-sequence evolutionary tracks vary depending on mass and luminosity; for example, stars with 5.8 may not become RSGs (Humphreys & Davidson 1994, HD hereafter; Chiosi & Maeder 1986; Maeder & Meynet 1987; Stothers & Chin 1994, 1999). Perhaps the most critical evolutionary phase – when a star may shed a great deal of mass in a short time period before becoming a WR star – is when it is classified as a luminous blue variable (LBV).
The term “luminous blue variable” (Conti 1984) refers to a specific class of unstable stars, even though most of the upper left part of the HRD would seem to qualify (see Wolf et al. 1999). LBVs (also called S Dor stars or Hubble-Sandage variables) exhibit a particular kind of instability, which causes a star to brighten at optical wavelengths ( 1–2 magnitudes) as a result of a shift in the bolometric flux from the UV to the optical (see reviews by HD; van Genderen 2001). The trigger of these events is not understood, but the furious mass loss and generally-unstable nature of LBVs results because they have lost considerable mass already, while evolving at constant L. This has increased their L/M ratio so that they may be in dangerous proximity to an opacity-modified Eddington limit in their outer layers (Appenzeller 1986, 1987, 1989; Lamers & Fitzpatrick 1988; HD; Ulmer & Fitzpatrick 1998).
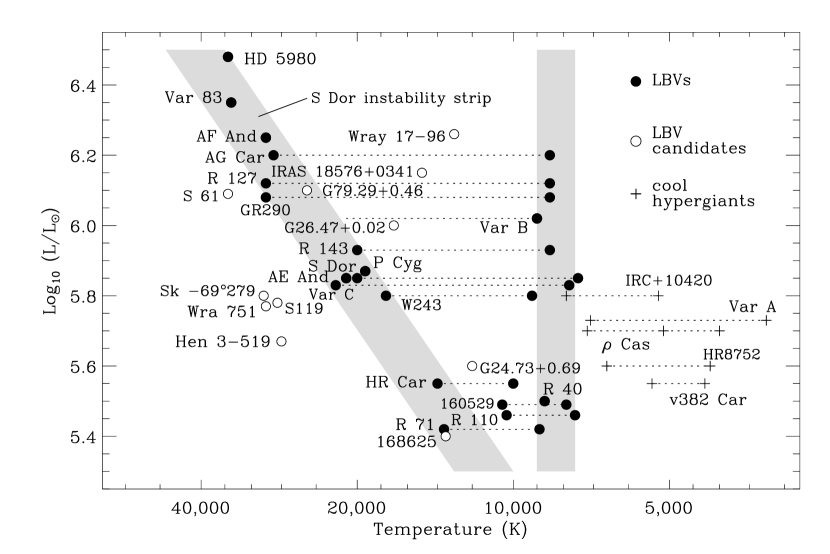
Here we focus on the behavior of “normal” LBVs in their quiescent state between outbursts. In quiescence, LBVs generally reside along the S Doradus instability strip, shown by the diagonal shaded area in Figure 1 (see Wolf 1989; HD). We point out a distinct lack of LBVs in the range , and – more importantly – we postulate a link between these missing LBVs and the “bistability jump” in the line-driven winds of luminous stars (Vink, de Koter, & Lamers 1999; Lamers, Snow, & Lindholm 1995). In §2 we review the basic ideas behind the bistability jump, and in §3 we discuss how this jump may affect quiescent LBVs. Then, in §4 we investigate numerically whether our idea has a theoretical foundation, and finally in §5 we speculate about consequences of our proposed connection for general aspects of evolution atop the HRD.
2 THE BISTABILITY JUMP
Luminous early-type stars have optically-thin line-driven winds (Lucy & Solomon 1970; Castor, Abbott, & Klein 1975; Cassinelli 1979; Pauldrach et al. 1986; Kudritzki & Puls 2000), and show a discontinuity in their wind properties near spectral type B1, at effective temperatures around 21 000 K. The ratio drops by a factor of two, from 2.6 for stars on the hot side, to 1.3 for stars with spectral types later than B1 (Lamers et al. 1995). This observed bifurcation is referred to as the “bistability jump”. The drop in velocity toward cooler temperatures is accompanied by an increase in the mass-loss rate by a factor of 5, and an increase in the wind’s “performance number” by a factor of 2 to 3 (Vink et al. 1999). The jump in wind parameters is caused by an increase in the driving effect of Fe iii lines below the sonic point as the effective temperature decreases (Vink et al. 1999).
This mechanism may also apply to individual stars with spectral types near B1. Pauldrach & Puls (1990) introduced the bistability mechanism in an effort to describe the curious behavior and physical state of P Cygni’s wind. P Cygni is an LBV that suffers minor shell ejection episodes, perhaps due to excursions back and forth across the bistability jump (Pauldrach & Puls 1990; Lamers et al. 1985); if this is true, P Cygni will be important for our discussion below. Additionally, bistability may play a role as temperature varies with latitude on a rapidly-rotating star with gravity darkening; Lamers & Pauldrach (1991) proposed the bistability mechanism as an explanation for the creation of outflowing disks around B[e] stars (see also Pelupessy et al. 2000).
Vink & de Koter (2002) showed that the winds of LBVs are indeed line driven, and that the bistability mechanism may play a role in their unusual variability and consequent excursions across the HRD. Since LBVs are already unstable due to high L/M values, and since quiescent LBVs have a range of temperatures from 10 000 to 35 000 K, we might expect the bistability jump to impact the mass-loss behavior of LBVs in their quiescent state as well, when they reside along the S Dor instability strip. In this paper, we propose that this is indeed the case, as outlined below.
3 THE MISSING LBVS ON THE S DOR INSTABILITY STRIP
Figure 1 shows the positions on the HRD of well-studied LBVs in the Milky Way and nearby galaxies, as well as some related stars; it borrows from similar diagrams presented by Wolf (1989), HD, and de Jager (1998), but includes additional stars and updated values from the literature. LBVs generally reside in the shaded areas of the diagram, either along the diagonal quiescent S Doradus instability strip (Wolf 1989) or along the constant-temperature vertical stripe while in outburst (see Davidson 1987). These trends would not be noticed if we included any and all stars in the upper HRD; instead we have selected only relatively rare and unstable stars thought to be at a particular evolutionary stage. From the literature, we have limited Figure 1 to include three types of stars: 1) confirmed LBVs that have exhibited S Dor-type variability, 2) candidate LBVs known to have spatially-resolved circumstellar shells,111Many stars like Ofpe/WN9 stars are sometimes considered LBV candidates based only on their spectral type, but do not have visible circumstellar material. and 3) cool hypergiants that have exhibited dramatic changes in effective temperature and spectral type over the last few decades. We should also note that a range of different values for temperature and luminosity are sometimes given by various authors for the same LBVs at quiescence; temperature values typically differ by a few thousand K, and luminosities generally disagree by 0.1 dex, and sometimes more. We chose not to plot error bars in Figure 1 for clarity, and we needed to make some judicious choices about which values to take from the literature; in some cases suitable averages were adopted. However, in general, these choices do not undermine the main points of this paper.
Figure 1 seems to support the existence of the diagonal S Dor instability strip, where most LBVs reside when they are not at maximum visual brightness. It is often remarked (e.g., HD; de Jager 1998; Stothers & Chin 1996, 1999) that LBVs come in two flavors: the “classical” or high-luminosity LBVs (like AG Car, R127, an R143) and the relatively low-luminosity LBVs (like HR Car and R71).
However, one might choose to characterize this bifurcation somewhat differently – here we point out a distinct gap in the otherwise continuous S Dor instability strip. In particular, no confirmed LBVs are observed with bolometric luminosities between =5.6 and 5.8. An obvious but intriguing coincidence is that the upper boundary of this gap at =5.8 is also the observed upper luminosity limit for RSGs and YHGs on the right side of the HRD (e.g., HD). One might surmise a possible connection between the luminosity gap on the S Dor instability strip and this upper luminosity limit; namely, that stars below =5.8 for some unknown reason can evolve to the red side of the HRD, and hence do not become normal LBVs — or eventually become LBVs with higher L/M ratios than they would otherwise have had. It is not the purpose of this paper to investigate why these less luminous stars can become RSGs (see Lamers & Fitzpatrick 1988; Ulmer & Fitzpatrick 1998). Instead we offer an independent potential explanation for why stars in this luminosity range might be inhibited from appearing on the S Dor instability strip — a reason to expect the apparent gap below =5.8. Possible implications are discussed later in §5.
Since the S Dor instability strip is diagonal, one might wonder if the “gap” below =5.8 is really a luminosity effect, or if it is instead linked more directly to the characteristic temperature of the star or opacity in its wind. In this context, one can see that the upper boundary of this gap at =5.8 is precisely where the S Dor instability strip crosses the bistability jump, observed to occur in the winds of blue supergiants at temperatures around 21 000 K. Is this just a coincidence, or is it possible that the bistability mechanism is important in accounting for the “missing” quiescent LBVs? To the upper left of this critical juncture, classical LBVs have powerful line-driven stellar winds and are observed to suffer occasional outbursts because they are already unstable, perhaps due to their proximity to the opacity-modified Eddington limit. As we move down the instability strip, how should we expect LBVs to behave as we approach and then cross the bistability jump where the mass-loss rate is expected to increase and the winds are expected to suddenly become slower and more opaque? It is instructive to consider the observed behavior of LBVs and related stars near this critical juncture at =5.8 and K.
P Cygni, for instance, is just above this limit. Its wind is unstable to small perturbations, and it was after studying P Cyg’s wind that Pauldrach & Puls (1990) first proposed the bistability mechanism.
S Dor and Var C are also just above the critical luminosity of , and their apparent temperatures in quiescence place them very close to the bistability jump. S Dor is unusual compared to other LBVs in that it is more often observed in the cooler, maximum-light phase and is rarely seen in the hotter quiescent phase (HD; Wolf 1989).
W243 is a newly-identified LBV in the cluster Westerlund 1 (Clark & Negueruela 2004). A recent spectrum of this star is almost identical to IRC+10420, implying that it may have formed a cool pseudo photosphere, although this is not a unique interpretation.
No LBVs are seen just below , but several unstable YHGs exist in the same luminosity range as the hypothetical gap on the S Dor instability strip, such as the famous stars IRC+10420 and Cas (Humphreys et al. 2002; de Jager 1998). These stars have high mass-loss rates and dense stellar winds with unstable convective atmospheres. Qualitatively like LBVs, the YHGs exhibit curious changes in apparent temperature at constant bolometric luminosity on timescales of years to decades. The lower boundary to the LBV gap is less well-defined, but there seem to be plenty of LBVs below , while there are no known YHGs below this luminosity. All the YHGs are on the cool side of the vertical stripe (at K) that marks the position of LBVs at maximum light. Is there a connection between the YHGs and the “missing” LBVs (de Jager 1989)? Is there a connection with the so-called “Yellow Void” proposed by de Jager? We offer some motivated speculation in §5.
All but one of the candidate LBVs with shells found within the luminosity range of the LBV gap are found on the hot side of the bistability jump, even though properties of the nebulae around candidates are similar to those of confirmed LBVs (e.g., Clark et al. 2003a; Smith 2002; Pasquali et al. 1999).
Let us make the cautionary remark that LBVs are rare objects, and consequently, that Figure 1 suffers from low number statistics. So, is the LBV “gap” at real? Uncertainties in L are typically 0.1 dex, which would be enough to make the gap quite dubious — but to do so, errors would need to conspire in such a way as to systematically lower the luminosities of the classical LBVs, and to systematically raise the luminosities of LBVs below . For a few objects, uncertainties in L and T are considerably worse because of assumptions like the adopted distance or reddening.222For example, some authors have given a luminosity for HR Car as high as or 5.8 (for a large distance of 5.4 to 6 kpc; Shore et al. 1996; Hutsemekers & van Drom 1991), placing it within the LBV gap that we have described here, although lower values closer to are often given as well. These higher luminosities are somewhat problematic, though, because then HR Car’s relatively low temperature at quiescence would not fit into the S Dor instability strip. On the other hand, the deficit of LBVs also holds for extragalactic LBVs, where the distances (and bolometric luminosities) are more reliable than in our own Galaxy. In any case, it is plausible that some LBVs may eventually be found to reside within the “gap”, and the present uncertainties do not yet support a claim that the gap is a pure void with a complete absence of any LBVs. Instead, we tentatively interpret the gap as signifying a real deficiency of LBVs — a location in the HRD where LBVs are less likely to be seen. Conditions in their atmospheres/winds make this difficult, but perhaps not impossible as it also depends on factors like their L/M ratio, rotation, and metallicity. Nevertheless, observations (Figure 1) do seem to support a deficit of LBVs at . This is especially true when we consider that for any normal initial mass function, LBVs should be more numerous at lower L, since LBVs extend to luminosities as low as .
Thus, we propose that the LBV gap just below occurs in part because that is where the S Dor instability strip crosses the bistability jump. The increased mass-loss rates and lower wind velocities expected on the cool side of the jump may prevent these already-unstable stars from existing there; they may have persistently dense winds with cooler pseudo photospheres, for example. This hypothesis is investigated numerically in the following section, where we constrain the conditions required for it to apply. Although various comments we made above concerning the two flavors of LBVs and the apparent gap or division at might have been noticed before and discussed in different terms (e.g., HD, de Jager 1998; Humphreys et al. 2002), we believe that the specific connection with the bistability jump is a genuinely new suggestion.
4 MASS LOSS PREDICTIONS FOR THE MISSING LBVs
In this section we present predictions of the mass-loss rates for LBV-type stars with a luminosity typical for the LBV gap, i.e. with . Previously, theoretical mass loss rates for LBVs have been derived by Vink & de Koter (2002) with the aim of investigating the role of the bistability mechanism on the mass loss behavior of these stars during their excursions across the HRD. Here we use the same prediction method, which we briefly summarize below.
4.1 Method
In our method the mass-loss rate follows from tracking the radiative energy loss of photons (to be precise: photon packages) traveling through a model atmosphere in a Monte-Carlo simulation, and equating the loss of photon energy to the gain in kinetic energy of the outflowing gas. From an outside observer’s point of view, this decrease of radiative energy occurs when photons transfer momentum (and energy) in interactions with moving ions in the flow. An iterative process is used to find the model in which the input mass loss is equal to that found from the global radiative to kinetic energy conversion. This value is the predicted mass-loss rate. Details of the Monte-Carlo method are given in Abbott & Lucy (1985), de Koter et al. (1997), and Vink et al. (1999).
The model atmospheres used in the process are calculated using the non-LTE code isa-wind. The inner boundary of the atmosphere is chosen to be at a Rosseland optical depth of 20 - 25, i.e. sufficiently large to assure thermalization of the radiation field. The density stratification gradually changes from being dominated by the equation of hydrostatic equilibrium in the inner regions, to being dominated by the stellar wind at and beyond the sonic point (see below). The chemical species for which the statistical equilibrium equations are solved explicitly are H, He, C, N, O, and Si. The adopted abundances of these species account for surface helium enrichment and CNO processed material, and are the same as used in Vink & de Koter (2002). For a full description of isa-wind, we refer the reader to de Koter et al. (1993, 1997).
Some important line driving elements, i.e. iron and to a lesser extent sulfur (see also Sim 2004), are not explicitly accounted for but are treated in a generalized form of the “modified nebular approximation” described by Lucy (1987, 1999). This simplified treatment may result in a (systematic) shift of the temperatures at which the dominant ionization state of these species change relative to full non-LTE calculations. Indications that such an offset may indeed exist have been presented by Vink et al. (1999). These authors identify the occurrence of strong changes in the terminal velocity and ionization of the winds of OB supergiants at spectral type B1 (corresponding to the bistability jump at 21 000 K; Lamers et al. 1995) to be a result of the transition of the dominant iron ionization from Fe iv to iii. However, they predict this jump to be at 25 000 K, i.e. at an effective temperature that is K higher than the observed temperature of the jump. Simulations over a wide range of wind densities show that the Fe iv/iii ionization balance is mostly sensitive to temperature, and not to density. Consequently, the predicted bi-stability jump was found to comprise only the narrow range of kK (Vink et al. 2000). One may therefore expect that for the somewhat denser winds of LBVs, the offset will be similar to – or slightly larger than – the maximum B supergiant offset of 5 500 K. Indeed, for the LBV AG Car a temperature offset of about 6 000 K was found (Vink & de Koter 2002). We note that for O-type stars, where Fe iv is dominant for all spectral sub-types, we find good agreement between predicted and observed mass loss behavior (see e.g. Vink et al. 2000; Benaglia et al. 2001; Herrero et al. 2002; Repolust et al. 2004). As we anticipate that the modified nebular approximation causes only an offset in the predicted temperature of the bistability jump, we will apply a corrective shift K to our predictions. This is intended only to guide the reader in order to facilitate a meaningful comparison with the observed bistability jump in B1 supergiants and in AG Car.
Our mass loss prediction method is distinct from the approach in which the line force is parameterized in terms of force multipliers (e.g. Castor, Abbott & Klein 1975; Kudritzki et al. 1989). The main advantages of our approach are the self-consistent treatment of the ionization stratification and the fact that it accounts naturally for multiple photon scattering processes. A disadvantage of our method may be that we do not de facto solve the momentum equation, i.e. the predicted mass loss values depend to some extent on the adopted velocity stratification above the stellar photosphere. For the supersonic part of the wind we assume the standard -type velocity law, which below the sonic point connects smoothly to the velocity structure implied by hydrostatic equilibrium (see de Koter et al. 1997 for details). A value of has been found to yield excellent results in modeling the spectra of O star winds (e.g. Puls et al. 1996), and is assumed here. The predicted mass-loss rates are found to be rather insensitive to this wind acceleration parameter for in the range 0.7 – 1.5 (Vink et al. 2000). Note that a value of has been considered too low for dense winds; infrared observations by Barlow & Cohen (1977) indicate a more extended wind acceleration in P Cygni. Also, the extremely dense winds of Wolf-Rayet stars appear to favor more gradual wind acceleration (i.e. larger value of ), at least for the outer wind (see Hillier 2003 for a discussion).
We specified the terminal velocity by adopting values for the ratio / of 1.3, 2.0, and 2.6. Note that Lamers et al. (1995) determined a ratio of 2.6 for Galactic supergiants of spectral type earlier than B1, and a ratio of 1.3 for supergiants of spectral type later than B1 (see also Kudritzki & Puls 2000).
4.2 Predictions of mass loss for LBVs with =5.7
We define a grid of models having input temperatures between 11 000 and 35 000 K. For a fixed luminosity =5.7, the input radius then follows from the relation . As the inner boundary is chosen to be deep in the stellar photosphere (see above) this input temperature does not reflect the actual effective temperature, nor does reflect the actual stellar radius. We define the stellar radius and effective temperature at the point where the thermalization optical depth measured in the center of the photometric band (at 5555 Å) equals (see Schmutz et al. 1990 and de Koter et al. 1996 for detailed discussions). Both and are therefore output quantities. For stars with relatively modest mass fluxes, such as normal O stars, the winds will be optically thin and will only be marginally less than . However, for LBVs, which may lose mass at rates of , there may be a significant difference between these two temperatures. If the wind is so strong that the visible light originates from layers near or beyond the regime of rapid wind acceleration the star is considered to have a “pseudo-photosphere”. Wolf-Rayet stars show such optically thick winds.
The formation of pseudo photospheres in LBVs may be favored by the relatively low mass of these stars, as this will 1) increase the photospheric scaleheight, and 2) lead to a larger mass loss (see below). Stothers & Chin (1996) estimate the mass of LBV stars with =5.7 to be roughly 17 . As this value is uncertain we consider masses that range between 10 and 25 .
Predictions of LBV mass loss are presented in Figure 2 for masses of 25, 20, 15, and 12 . Results are shown for three different ratios of /. The four panels clearly show that for fixed temperature the mass-loss rate increases with decreasing stellar mass. Vink & de Koter (2002) found for masses 30 down to 10 ; these new results agree. Note that for normal O stars the predicted slope is shallower (i.e -1.3; Vink et al. 2000). Also visible in Figure 2 is a gradual shift of the location of the bistability jump towards higher for lower / and stellar mass. This is because these models have a higher wind density. The Saha-Boltzmann ionization equilibrium (as formulated in the modified nebular approximation) then implies that recombination will occur at a somewhat higher temperature.
Let us inspect the panel for = 15 a bit closer, as this is closest to the typical LBV mass derived by Stothers & Chin for =5.7. Following the curve the mass loss rate increases by a factor of more than two at the predicted location of the bistability jump between model A at kK and model B at 25 kK. Given the observed characteristics of the bistability jump (at 21 kK, see above), / is expected to decrease from 2.6 to 1.3. Thus, switching over to the curve with / = 1.3 (model C) the total increase in over the bistability jump is about a factor 5. Even more relevant is that the wind density increases by a factor of 10. These properties of the bistability jump are similar to those predicted by Vink et al. (1999) and are explained by changes in the line driving properties of iron (see § 4.1).
The key question is: can this large increase in density make the winds of LBVs optically thick and cause the formation of a “pseudo-photosphere”?
4.3 The formation of pseudo-photospheres
De Koter et al. (1996) assessed whether changes in wind properties could explain the visual magnitude changes of to 2 mag observed in LBV stars. On the basis of a parameter study they concluded that pseudo-photospheres are unlikely to form in LBVs. However, they did not investigate in detail the effect of an order of magnitude change in the wind density of a star that is extremely close to its classical Eddington limit at =1, where and is due to pure electron scattering. Figure 4 shows the result for such calculations in terms of the change in effective temperature as a function of stellar mass, for two values. We verified, by decreasing the wind density by an order of magnitude, that the temperature is fairly representative for the effective temperature of the star if the bistability jump would not occur. We see that the lower the mass, the closer the star gets to its Eddington limit.
To gain insight into the wind optical thickness of the 15 star below the jump (A), and above the jump (C) (note that model B is an intermediate step only), we plot the thermalization optical depth of these models against their wind velocities in Figure 3. The hot model (A) only reaches the point where exceeds in the photosphere, where the wind velocity is smaller than 2 km/s. However, this situation is rather different for the cooler model C with enhanced mass loss. In model C the thermalization depth is reached at 19 km/s, i.e. at a velocity above that of the sound speed (16 km/s). This implies that model C starts to form an optically thick wind, which may lead to the formation of a (modest) pseudo photosphere.
Figure 4 explores the issue whether the size of the forming pseudo-photosphere is large enough to create the LBV gap. The top panel for = 25 kK shows that for a current mass that is below about 12 (corresponding to ) the star will rapidly form an extended optically thick wind envelope as the star crosses the bistability jump, reaching down to an effective temperature of 13 kK for a mass of 10.5 . For = 17.5 kK a similar lower limit to the effective temperature is found, again for . Though we tried to compute models for even lower mass, these failed to converge as a result of their proximity to the Eddington limit.
As stated above, an offset of about –6 000 K should be applied to have the predicted temperature of the bistability jump match the observed value. Naively applying this shift would bring the effective temperature at the low temperature side of the bistability jump to about 7 000 K, which agrees well with the location of the yellow hypergiants. At about this temperature the extinction of a gaseous medium reaches a maximum, so this may be expected to represent the maximum redward shift such a star may achieve (Davidson 1987; Appenzeller 1986). Therefore, for masses even lower than 10.5 the stars would remain in the same region of the Hertzsprung-Russell diagram. Note that stars at the observed temperature of the bistability jump have a core radius somewhat larger than do stars at the predicted location of the jump. Therefore, the mass flux at the high wind density side of the jump is expected to be only about half of what we predict. This does not change our conclusions in a significant way.
One may bring forward arguments that favor the formation of a pseudo photosphere that is even more extended than predicted in our calculations. Both observational and theoretical indications exist that at least some LBVs may show relatively slow wind acceleration, i.e. a value (Ignace et al. 2003). Though this does not have a strong effect on the mass loss rate (see Vink et al. 2000), it does lead to a further increase of the photospheric radius for a star that already shows signs of pseudo photosphere formation (the thermalization optical depth of such a model (model D; ) is plotted in Fig. 3). One could even envision the situation that the initial formation of a (modest) pseudo photosphere may lead to a runaway effect, i.e. a progressively slower velocity law (equivalent to a progressively larger ). A test of this scenario requires time-dependent hydrodynamic modeling of the outer stellar envelope and wind, and is beyond the scope of this paper.
The above results suggest the following sequence of events: unstable hot stars in the S Doradus instability strip below would find themselves positioned at the low temperature side of the bistability jump. Compared to quiescent LBVs at higher luminosity, their wind density would increase by up to an order of magnitude. This may lead to the formation of a pseudo photosphere, pushing the star toward cooler temperatures, and into the regime in which the yellow hypergiants are observed, causing the gap in the S Dor instability strip presented in Figure 1. Consequences of this scenario are discussed in more detail below.
5 DISCUSSION
Proceeding with the assumption that the “gap” is a real feature of LBVs on the HRD, we seek an explanation for why it may exist. In this paper we have hypothesized that the gap is a consequence of the bistability jump — namely, that at temperatures below about 21 000 K, an abrupt change in the behavior of the line-driving mechanism makes the winds of LBVs unstable enough that they may develop pseudo photospheres and are then pushed toward cooler apparent temperatures on the HRD. For LBVs on the S Dor instability strip, the bistability jump at 21 000 K occurs at 5.8.
5.1 Optically-Thick Winds and the Bistability Jump
To test the above hypothesis, we have conducted numerical simulations of line-driven stellar winds for LBVs at =5.7. Such a luminosity is consistent with the evolutionary track of an initially 40 star (Maeder & Meynet 1987, 1988; Stothers & Chin 1996). Our simulations show (Fig. 2) that the bistability jump does play a significant role at =5.7, for a range of stellar masses, with higher mass-loss rates on the cool side of the bistability jump. We find that for current masses above 20 , LBVs do not form optically thick winds. In the mass range between 15 and 20 we find indications that they are on the verge of forming pseudo photospheres or indeed that their atmospheres become optically thick at the base of the wind. For even lower masses LBVs form extended pseudo photospheres (Fig. 4). Table 2 also gives the classical electron-scattering Eddington ratio for each model. In LBVs, it has long been thought that an opacity-modified Eddington limit may play a role, so that atmospheres become unstable at 80% or 90% of the classical limit, instead of at =1 (e.g. HD; Appenzeller 1989; Lamers & Fitzpatrick 1988; Ulmer & Fitzpatrick 1998). Indeed, for =5.7 we find that severe pseudo photospheres develop for . This fact may give critical clues to their evolutionary state, as discussed below in §5.2. Additionally, our results show that on the cool side of the bistability jump, stars with as low as 0.5 are on the verge of having optically-thick winds. Note that P Cygni, for which the bistability mechanism was first introduced to explain the variability of its stellar wind (which is not the same as forming a true extended pseudo photosphere), has .
For masses of 15-20 , pseudo photospheres are quite weak, with temperature shifts of only about 1 000 K at . If LBV masses fall in this range for =5.7, then we would need to invoke a “runaway” effect to explain the “gap”. As hinted earlier, the temperature drop of the initial pseudo photosphere might cause a drop in the wind speed and perhaps an increase in opacity, which in turn, might increase the mass-loss rate, making the wind even more optically thick. Similar ideas have been discussed in the past with regard to the outbursts of LBVs (Appenzeller 1986, 1987, 1989; Davidson 1987; HD). Perhaps a different instability proposed in connection to the “Yellow Void” (de Jager 1998; see below) would then become relevant. Presumably such a runaway would continue until the temperature fell to about 7 500 K (see Davidson 1987; Appenzeller 1986), when much of the atmosphere would recombine and the opacity would drop. Again, this is only relevant for relatively high LBV masses — if a total of can be shed by the star by the time it leaves the RSG phase, then our calculations show that invoking such a “runaway” is unnecessary.
The mass dependence (or rather, the L/M-dependence) of the instability due to the bistability jump is probably the reason why other stars seen in this region of the HRD are apparently immune. For instance, several B[e] stars reside near =5.7 with spectral types of B0 to B3 (Zickgraf et al. 1986). Despite their high luminosity, these hot supergiants show little photometric or spectroscopic variability, indicating that they are not subject to the same instability that affects LBVs. Perhaps they have not yet lost enough mass to raise their L/M ratios to a critical level. It is interesting, however, that the bistability jump may affect their complex, latitude-dependent stellar winds (Zickgraf et al. 1986 Lamers & Pauldrach 1991; Pelupessy et al. 2000).
5.2 The “Missing” LBVs as Post-RSGs
Log is the luminosity where the S Doradus instability strip intersects the bistability jump at 21 000 K, and it is also the limit above which no RSGs or YHGs are seen on the cool side of the HRD (HD). Is this just a coincidence, or perhaps, are the two phenomena related?
We have shown that at , LBVs on the S Dor instability strip may develop pseudo photospheres because of the heightened opacity in their atmospheres on the cool side of the bistability jump — but this only seems to be important for sufficiently low masses such that 0.5 (preferably 0.8), or for 10-15 . This mass range agrees well with that expected for a post-RSG of the same luminosity. For an O star with initial mass 40 that evolves directly to the LBV phase, it is unlikely that its would be high enough to allow the order of magnitude jump in wind density at the bistability limit to form a significant pseudo photosphere. Instead, after heavy mass loss during the RSG phase, a star with this initial mass would have decreased to below 20 (Maeder & Meynet 1987, 1988) — in good agreement with our constraints. This suggests strongly that the “missing” LBVs need to be post-RSG in order for our proposed mechanism to work, and would thereby explain the apparent “coincidence” of the gap and the upper luminosity limit for RSGs.
What about LBVs above and below the gap? While stars above do not become RSGs, they are expected to lose considerable mass, perhaps in an Car-like giant eruption (Maeder 1989; Chiosi & Maeder 1986; Stothers & Chin 1999), before becoming a classical LBV. However, when they do finally settle down to become normal quiescent LBVs on the S Dor instability strip, they are on the hot side of the bistability jump where the wind density is much lower. The low-luminosity LBVs may be stable enough to exist on the S Dor instability strip — despite being on the cool side of the bistability jump — simply because their lower L/M ratios render the bistability-induced pseudo photosphere mechanism inapplicable. For example, pseudo photospheres resulting from the bistability mechanism only seem to be significant for , while the low-luminosity LBVs typically have values of .
5.3 The Missing LBVs, the Yellow Hypergiants, and the “Yellow Void”
Yet another phenomenon that is important in this region of the HRD, and may be related to the missing LBVs, is the so-called “Yellow Void” (de Jager 1998; de Jager & Nieuwenhuijzen 1997; Nieuwenhuijzen & de Jager 2000). The Yellow Void is a region of instability in the HRD between temperatures of roughly 7 000 and 12 500 K, and luminosities of . Stars in this region can have very low in their outer layers, and the sonic point can be below photospheric levels. In combination with stellar pulsations this may lead to dynamically-unstable convective atmospheres and very high mass-loss rates (de Jager; Stothers & Chin 2001; Stothers 2003). De Jager (1998) suggests that this instability is only important for blueward-evolving post-RSGs (with high enough L/M ratios), such as the cool hypergiants plotted in Figure 1. Nieuwenhuijzen & de Jager propose that several of the yellow hypergiants (YHGs) are “bouncing” against the Yellow Void in an attempt to evolve to warmer temperatures, but are stopped by the instability and undergo high mass loss.
Are the YHGs somehow related to the missing LBVs? A more direct and provocative question might be to ask if the YHGs are the missing LBVs — in other words, if it were not for the pseudo photospheres induced by the bistability jump or the Yellow Void, would the YHGs reside on the S Dor instability strip and behave like LBVs? The YHGs occupy the same range of luminosities that seem to be missing from the LBVs, and like the LBVs, they show conspicuous apparent temperature variations at relatively constant bolometric luminosity (Nieuwenhuijzen & de Jager 2000; Figure 1). They are the only stars within this luminosity range that show such dramatic variability in spectral type on short time scales (years to decades, like LBVs).
What is the relationship, if any, between this Yellow Void and the bistability jump that we have addressed in this paper? For masses below 12 , our proposed mechanism would have the same effect as the Yellow Void — i.e. it would halt blueward evolution at 7 500 K for post-RSGs. For higher masses (15-20 ), we have shown that the enhanced mass loss on the cool side of the bistability jump may cause at most a modest pseudo photosphere to develop at 5.7. This alone might not be enough to push a star far to the right on the HRD — but it may be enough to push the star into the Yellow Void, where a different instability then takes over. Likewise, the Yellow Void instability alone would not be able to trigger this without the bistability jump, because the Yellow Void only extends to temperatures as warm as 12 500 K and does not reach the S Dor instability strip. Thus, for relatively high LBV masses at =5.7, these two mechanisms may work together to account for the LBV gap.
An alternate view might be that the bistability jump is not so important for explaining the missing LBVs, because they are unable to get there anyway — if they are indeed blueward-evolving post-RSGs, they may simply be stopped by the Yellow Void and prevented from becoming normal quiescent LBVs. In that view, however, the bistability jump may still play an important role in defining an extended blue boundary of the Yellow Void. This will be especially true if stars shed a large amount of mass as a YHG, so that their L/M ratio is even higher than immediately following the RSG phase.
IRC+10420 is particularly interesting in this regard. It is at both the upper luminosity boundary for cool stars, and is at the cool edge of the Yellow Void (see Fig. 1). It is a relatively unambiguous case for a post-RSG, having OH masers despite its A-type spectrum (see Oudmaijer 1998; Humphreys et al. 1997), and a shell that qualitatively resembles the RSG nebula around VY CMa (Smith et al. 2001). Humphreys et al. (2002) suggest that IRC+10420 is at a critical stage when it is just about to cross the Yellow Void and emerge on the blue side as a hot LBV. Although IRC+10420 has evolved from a main-sequence star of roughly 40 , its present-day mass is most likely well below 20 ; Humphreys et al. (2002) favor 15 , while Nieuwenhuijzen & de Jager (2000) have suggested that its current mass may even be as low as 6 . Thus, based on the results of our calculations, if IRC+10420 were to evolve toward warmer temperatures, we would expect it to be severely effected by the cool side of the bistability jump, and it should form a pseudo photosphere. In fact, our =5.7 model at 10.5 may be directly relevant to IRC+10420. This model has a mass-loss rate of , which is similar to the present-day rate of for IRC+10420 deduced by Humphreys et al. (2002), and measured fom CO lines by Oudmaijer et al. (1996). Humphreys et al. argue that such a rate is enough to cause a very dense and peculiar wind with a pseudo photosphere and an apparent temperature of 8 500 K.
Of course these scenarios should be tested with quantitive spectroscopy, but this is not an easy task in the regime of hydrogen recombination, where the H line is difficult to predict, and because of close proximity to the Eddington limit. Quantitative spectroscopy might result in a determination of , , and for the yellow hypergiants, but arguably the most crucial paramater to test our scenario is the stellar mass, which is unfortunately even harder to obtain because of the degeneracy involved in simultaneously determining both and the mass. Because the yellow hypergiants exhibit temperature variations, the approach outlined for AG Car by Vink & de Koter (2002) could potentially be used. In this approach the mass loss behavior as a function of time (and therefore temperature) can be used to constrain the stellar mass.
5.4 The evolution of massive stars at
The discussion above brings into question the still-uncertain evolutionary sequences for massive stars with . These stars are able to evolve to the right side of the HRD and go through a RSG phase. Several investigators have discussed the idea that after the RSG phase, these stars will then become low-luminosity LBVs and eventually WR stars (i.e. O star BSG RSG LBV WR; Maeder 1982; Chiosi & Maeder 1986; Stothers & Chin 1994, 1996). For stars with , this seems reasonable based on Figure 1 and many other considerations.
However, for stars with 5.70.1, the situation may be more complicated because of the interaction between the YHGs at the Yellow Void, and their proximity to the upper luminosity limit for cool stars. Consider what will happen to IRC+10420 or Cas if they are eventually able to cross the Yellow Void — if they make it to the blue side of the Yellow Void and become LBVs, they will find themselves on the S Dor instability strip just to the cool side of the bistability jump. However, this is the location of the LBV “gap”. We have shown in this paper that in this zone of the HRD, post-RSGs with (and especially post-YHGs with even lower masses and higher values of ) will form pseudo photospheres independent of the Yellow Void, and so it is likely that these stars will be pushed back across the Yellow Void! Hence, in order for IRC+10420 or Cas to truly cross the Yellow Void, they must make it all the way to the hot side of the bistability jump where the wind density decreases by an order of magnitude. Interestingly, this is where we see several Ofpe/WN9 stars or candidate LBVs with circumstellar ring nebulae, like S 119, Wra 751, and others. These Ofpe/WN9 stars have ring nebulae that expand at speeds of 20–30 km s-1, much slower than their stellar winds (Bianchi et al. 2004; Pasquali et al. 1997, 1999; Hutsemékers & van Drom 1991). In fact, these nebular expansion speeds are closer to the wind speeds of YHGs and RSGs, rather than the faster winds of O, WR, LBV, or even Ofpe/WN9 stars themselves.
One reasonable interpretation, then, may be that the bistability jump acts together with the Yellow Void, so that within a small range of luminosity (), post-RSGs will skip the LBV phase, instead appearing only as YHGs before becoming slash stars and eventually WR stars. (i.e. perhaps the YHG phase takes the place of the LBV phase for these stars.) Thus, from this line of reasoning one might adopt the following evolutionary scenario for :
The distinction between this scenario and a much more simplified one (like O star RSG WR) is that these comments apply to the apparent surface of the star, which at times is a very thick pseudo photosphere. During this entire post-RSG phase, the core should continue to evolve blueward, independent of the star’s outer atmosphere. This is why the star, after loosing essentially all of its outer envelope, may eventually cross the Yellow Void (de Jager & Nieuwenhuijzen 1997) to appear on the hot side of the bistability jump, perhaps as an Ofpe/WN9 star with a slowly-expanding ring nebula.
References
- (1)
- (2) Abbott D.C., & Lucy L.B. 1985, ApJ 288, 679
- (3)
- (4) Appenzeller, I. 1986, IAU Symp. 116, 139
- (5)
- (6) Appenzeller, I. 1987, in Instabilities in Luminous Early-Type Stars, ed. H.J.G.L.M. Lamers & C.W.H. de Loore (Dordrecht: Kluwer), 55 (see also p. 138)
- (7)
- (8) Appenzeller, I. 1989, in Physics of Luminous Blue Variables, ed. K. Davidson, A.F.J. Moffat, & H.J.G.L.M. Lamers (Dordrecht: Kluwer), 195
- (9)
- (10) Barlow, M.J. & Cohen, M. 1977, ApJ, 213, 737
- (11)
- (12) Benaglia P., Cappa C.E., & Koribalski B.S. A&A 372, 952
- (13)
- (14) Bianchi, L., Bohlin, R., & Massey, P. 2004, ApJ, 601, 228
- (15)
- (16) Cassinelli, J.P. 1979, ARAA, 17, 275
- (17)
- (18) Castor, J.I., Abbott, D.C., & Klein, R.I. 1975, ApJ, 195, 157
- (19)
- (20) Chiosi, C., & Maeder, A. 1986, ARAA, 24, 329
- (21)
- (22) Clark, J.S., & Negueruela, I. 2004, A&A, 413, L15
- (23)
- (24) Clark, J.S., Egan, M.P., Crowther, P.A., Mizuno, D.R., Larionov, V.M., & Arkharov, A. 2003a, A&A, 412, 185
- (25)
- (26) Clark, J.S., Larionov, V.M., Crowther, P.A., Egan, M.P., & Arkharov, A. 2003b, A&A, 403, 653
- (27)
- (28) Conti, P.S. 1984, IAU Symp. 105, 233
- (29)
- (30) Crowther, P.A., & Smith, L.J. 1997, A&A, 320, 500
- (31)
- (32) Davidson, K. 1987, ApJ, 317, 760
- (33)
- (34) Egan, M.P., Clark, J.S., Mizuno, D.R., Carey, S.J., Steele, I.A., & Price, S.D. 2002, ApJ, 572, 288
- (35)
- (36) de Koter A., Schmutz W., & Lamers H.J.G.L.M. 1993, A&A 277, 561
- (37)
- (38) de Koter A., Lamers H.J.G.L.M., & Schmutz W. 1996, A&A 306, 501
- (39)
- (40) de Koter A., Heap S.R., & Hubeny I. 1997, ApJ 477, 792
- (41)
- (42) de Jager, C. 1980, The Brightest Stars (Dordrecht: Reidel)
- (43)
- (44) de Jager, C. 1989, in Physics of Luminous Blue Variables, ed. K. Davidson, A.F.J. Moffat, & H.J.G.L.M. Lamers (Dordrecht: Kluwer), 127
- (45)
- (46) de Jager, C. 1998, A&A Rev., 8, 145
- (47)
- (48) de Jager, C., & Nieuwenhuijzen, H. 1997, MNRAS, 290, L50
- (49)
- (50) Herrero, A., Puls, J., & Najarro, F. 2002, A&A, 396, 949
- (51)
- (52) Higgs, L.A., Wendker, H.J., & Landecker, T.L. 1994, A&A, 291, 295
- (53)
- (54) Hillier, D.J. 2003, in: A massive star odyssey: from main sequence to supernova, ed. K. van der Hucht, A. Herrero, & C. Esteban, IAU Symp. 212, 70
- (55)
- (56) Hoekzema, N., Lamers, H.J.G.L.M., & van Genderen, A.M. 1992, A&A, 257, 118
- (57)
- (58) Hu, J.Y., de Winter, D., Thé, P.S., & Pérez, M.R. 1990, A&A, 227, L17
- (59)
- (60) Humphreys, R.M., & Davidson, K. 1994, PASP, 106, 1025
- (61)
- (62) Humphreys, R.M., Davidson, K., & Smith, N. 2002, AJ, 124, 1026
- (63)
- (64) Humphreys, R.M., Jones, T.J., & Gehrz, R.D. 1987, AJ, 94, 315
- (65)
- (66) Humphreys, R.M., Smith, N., Davidson, K., Jones, T.J., Gehrz, R.D., Mason, C.G., Hayward, T.L., Houck, J.R., & Krautter, J. 1997, AJ, 114, 2778
- (67)
- (68) Hutsemékers, D., & van Drom, E. 1991, A&A, 248, 141
- (69)
- (70) Ignace, R., Quigley, M.F., & Cassinelli, J.P. 2003, ApJ, 596, 538
- (71)
- (72) Koenigsberger, G., Auer, L.H., Georgiev, L., & Guinan, E. 1998, ApJ, 496, 934
- (73)
- (74) Kudritzki, R.P., & Puls, J. 2000, ARAA, 38, 613
- (75)
- (76) Kudritzki R.-P., Pauldrach A., Puls J., & Abbott D.C. 1989, A&A, 219, 205
- (77)
- (78) Lamers, H.J.G.L.M., & de Groot, M.J.H. 1992, A&A, 257, 153
- (79)
- (80) Lamers, H.J.G.L.M., & Fitzpatrick, E. 1988, ApJ, 324, 279
- (81)
- (82) Lamers, H.J.G.L.M., & Pauldrach, A.W.A. 1991, A&A, 244, L5
- (83)
- (84) Lamers, H.J.G.L.M., Korevaar, P., & Cassatella, A. 1985, A&A, 149, 29
- (85)
- (86) Lamers, H.J.G.L.M., Morris, P.W., Voors, R.H.M., van Gent, J.I., Waters, L.B.F.M., de Graauw, T., Kudritzki, R.P., Najarro, F., Salama, A., & Heras, A.M. 1996a, A&A, 315, L225
- (87)
- (88) Lamers, H.J.G.L.M., Najarro, F., Kudritzki, R.P., Morris, P.W., Voors, R.H.M., van Gent, J.I., Waters, L.B.F.M., de Graauw, T., Beintema, D., Valentijn, E.A., & Hillier, D.J. 1996b, A&A, 315, L229
- (89)
- (90) Lamers, H.J.G.L.M., Snow, T.P., & Lindholm, D.M. 1995, ApJ, 455, 269
- (91)
- (92) Langer, N. 1989, in Physics of Luminous Blue Variables, ed. K. Davidson, A.F.J. Moffat, & H.J.G.L.M. Lamers (Dordrecht: Kluwer), 221
- (93)
- (94) Langer, N., Hamann, W.R., Lennon, M., Najarro, F., Pauldrach, A.W.A., & Puls, J. 1994, A&A, 290, 819
- (95)
- (96) Lucy, L.B., & Solomon, P.M. 1970, ApJ, 159, 879
- (97)
- (98) Lucy, L.B. 1987, In: ESO Workshop on the SN 1987A, Proceedings (A88-35301 14-90), 417
- (99)
- (100) Lucy, L.B. 1999, A&A 345, 211
- (101)
- (102) Maeder, A. 1982, A&A, 105, 149
- (103)
- (104) Maeder, A. 1989, in Physics of Luminous Blue Variables, ed. K. Davidson, A.F.J. Moffat, & H.J.G.L.M. Lamers (Dordrecht: Kluwer), 15
- (105)
- (106) Maeder, A., & Meynet, G. 1987, A&A, 182, 243
- (107)
- (108) Maeder, A., & Meynet, G. 1988, A&ASS, 76, 411
- (109)
- (110) Massey, P. 2000, PASP, 112, 144
- (111)
- (112) Nieuwenhuijzen H. & de Jager, C. 2000, A&A, 353, 163
- (113)
- (114) Oudmaijer, R.D. 1998, A&ASS, 129, 51
- (115)
- (116) Oudmaijer, R.D., Groenewegen, M.A.T., Matthews, H.E., Blommaert, J.A.D.L., & Sahu, K.L. 1996, MNRAS, 280, 1062
- (117)
- (118) Pasquali, A., Langer, N., Schmutz, W., Leitherer, C., Nota, A., Hubeny, I., & Moffat, A.F.J. 1997, ApJ, 478, 340
- (119)
- (120) Pasquali, A., Nota, A., & Clampin, M. 1999, A&A, 343, 536
- (121)
- (122) Pauldrach, A.W.A., & Puls, J. 1990, A&A, 237, 409
- (123)
- (124) Pauldrach, A.W.A., Puls, J., & Kudritzki, R.P. 1986, A&A, 164, 86
- (125)
- (126) Pauldrach, A.W.A., Kudritzki, R.P., Puls, J., Butler, K., & Hunsinger, J. 1994, A&A, 283, 525
- (127)
- (128) Pelupessy, I., Lamers, H.J.G.L.M., & Vink, J.S. 2000, A&A 359, 695
- (129)
- (130) Polcaro, V.F., Gualandi, R., Norci, L., Rossi, C., & Viotti, R.F. 2003, A&A, 411, 193
- (131)
- (132) Puls J., Kudritzki R.-P., & Herrero A. 1996, A&A 305, 171
- (133)
- (134) Repolust, T., Puls, J., & Herrero, A. 2004, A&A, submitted
- (135)
- (136) Schmutz, W., Abbott, D.C., Russell, R.S., Hamann, W.-R., & Wessolowski, U. 1990, ApJ 355, 255
- (137)
- (138) Shore, S.N., Altner, B., & Waxin, I. 1996, AJ, 112, 2744
- (139)
- (140) Sim, S.A. 2004, MNRAS, in press (astro-ph/0401149)
- (141)
- (142) Smith, L.J., Crowther, P.A., & Prinja, R.K. 1994, A&A, 281, 833
- (143)
- (144) Smith, N., 2002, MNRAS, 336, L22
- (145)
- (146) Smith, N., Humphreys, R.M., Davidson, K., Gehrz, R.D., Schuster, M.T., & Krautter, J. 2001, AJ, 121, 1111
- (147)
- (148) Stothers, R.B. 2003, ApJ, 589, 960
- (149)
- (150) Stothers, R.B., & Chin, C.W. 1994, ApJ, 426, L43
- (151)
- (152) Stothers, R.B., & Chin, C.W. 1996, ApJ, 468, 842
- (153)
- (154) Stothers, R.B., & Chin, C.W. 1999, ApJ, 522, 960
- (155)
- (156) Stothers, R.B., & Chin, C.W. 2001, ApJ, 560, 934
- (157)
- (158) Szeifert, T., Humphreys, R.M., Davidson, K., Jones, T.J., Stahl, O., Wolf, B., & Zickgraf, F.J. 1996, A&A, 314, 131
- (159)
- (160) Thompson, G.I., Nandy, K., Morgan, D.H., et al. 1982, MNRAS, 200, 551
- (161)
- (162) Ulmer, A., & Fitzpatrick, E.L. 1998, ApJ, 504, 200
- (163)
- (164) van Genderen, A.M., et al. 1992, A&A, 264, 88
- (165)
- (166) van Genderen, A.M. 2001, A&A, 366, 508
- (167)
- (168) Vink, J.S., & de Koter, A. 2002, A&A, 393, 543
- (169)
- (170) Vink, J.S., de Koter, A., & Lamers, H.J.G.L.M. 1999, A&A, 350, 181
- (171)
- (172) Vink, J.S., de Koter, A., & Lamers, H.J.G.L.M. 2000, A&A 362, 295
- (173)
- (174) Wolf, B. 1989, A&A, 217, 87
- (175)
- (176) Wolf, B., Stahl, O., & Fullerton, A.W. (eds.) 1999, Variable and Non-spherical Stellar Winds in Luminous Hot Stars (Heidelberg: Springer-Verlag)
- (177)
- (178) Zickgraf, F.J., Wolf, B., Stahl, O., Leitherer, C., & Appenzeller, I. 1986, A&A, 163, 119
- (179)
| Model | log | / | ||
|---|---|---|---|---|
| (kK) | () | |||
| A | 30 | -4.93 | 2.6 | 1 |
| B | 25 | -4.52 | 2.6 | 1 |
| C | 25 | -4.28 | 1.3 | 1 |
| D | 25 | -4.28 | 1.3 | 1.5 |
| log | / | log | ||||
| () | () | (kK) | (kK) | |||
| 25 | 5.7 | 0.383 | 2.6 | 35 | 5.23 | 34.8 |
| 32.5 | 5.32 | 32.3 | ||||
| 30 | 5.35 | 29.8 | ||||
| 27.5 | 5.37 | 27.3 | ||||
| 1.3 | 25 | 4.65 | 24.8 | |||
| 22.5 | 4.67 | 22.3 | ||||
| 20 | 4.67 | 19.8 | ||||
| 17.5 | 4.60 | 17.3 | ||||
| 15 | 4.55 | 14.8 | ||||
| 12.5 | 4.60 | 12.3 | ||||
| 11 | 4.71 | 10.8 | ||||
| 20 | 5.7 | 0.478 | 2.6 | 35 | 5.02 | 34.7 |
| 32.5 | 5.14 | 32.2 | ||||
| 30 | 5.18 | 29.7 | ||||
| 27.5 | 5.10 | 27.3 | ||||
| 1.3 | 25 | 4.48 | 24.7 | |||
| 22.5 | 4.51 | 22.2 | ||||
| 20 | 4.51 | 19.7 | ||||
| 17.5 | 4.41 | 17.2 | ||||
| 15 | 4.39 | 14.7 | ||||
| 12.5 | 4.49 | 12.3 | ||||
| 11 | 4.60 | 10.8 | ||||
| 15 | 5.7 | 0.638 | 2.6 | 35 | 4.76 | 34.3 |
| 32.5 | 4.88 | 31.9 | ||||
| 30 | 4.93 | 29.4 | ||||
| 27.5 | 4.70 | 27.0 | ||||
| 0.559 | 1.3 | 25 | 4.28 | 23.9 | ||
| 22.5 | 4.30 | 21.7 | ||||
| 20 | 4.25 | 19.3 | ||||
| 17.5 | 4.21 | 16.8 | ||||
| 15 | 4.26 | 14.4 | ||||
| 12.5 | 4.38 | 12.0 | ||||
| 11 | 4.48 | 10.6 | ||||
| 12 | 5.7 | 0.797 | 2.6 | 35 | 4.53 | 33.3 |
| 32.5 | 4.62 | 31.1 | ||||
| 30 | 4.62 | 28.6 | ||||
| 27.5 | 4.27 | 26.4 | ||||
| 0.698 | 1.3 | 25 | 3.98 | 19.9 | ||
| 22.5 | 4.00 | 18.5 | ||||
| 20 | 4.02 | 17.0 | ||||
| 17.5 | 4.08 | 15.6 | ||||
| 15 | 4.18 | 13.8 | ||||
| 12.5 | 4.32 | 11.6 | ||||
| 11 | 4.42 | 10.2 | ||||
| 11.5 | 5.7 | 0.729 | 1.3 | 25 | 3.89 | 17.9 |
| 11 | 5.7 | 0.762 | 1.3 | 25 | 3.79 | 15.5 |
| 10.5 | 5.7 | 0.798 | 1.3 | 25 | 3.67 | 12.9 |