Identification and Characterization of Faint Emission Lines in the Spectrum of the Planetary Nebula IC 418
Abstract
We present high signal-to-noise echelle spectra of the compact high surface brightness, low ionization planetary nebula IC 418. These reveal 807 emission lines down to intensities less than 10-5 that of H for which we determine widths and relative intensities. We show that line profiles are a valuable parameter for making line identifications and in constraining the excitation mechanism of the lines. We present evidence that indicates that many supposed high-level recombination lines may in fact be excited by a process other than recombination. We contend from the detection of dielectronic recombination lines that their relatively low intensities argue against their making a significant contribution to level populations of the heavy ions in this object. Following similar analyses of other PNe we find that IC 418 shows a small discrepancy in ion abundances derived from forbidden vs. recombination lines of the heavy elements.
Subject headings:
ISM:abundances – line:formation – line:profiles – planetary nebulae:individual (IC 418)1. Introduction
A significant source of our knowledge of chemical abundances throughout the universe is spectrophotometry of distant emission-line regions. The classical approach (e.g. Osterbrock 1989) is to determine the relative abundances of elements heavier than helium by comparing the intensities of their strong, collisionally excited lines (which in the optical regime are mostly forbidden lines) to the intensities of the strong hydrogen recombination lines. Major results from such work include measurements of the level of CNO enrichment in starburst galaxies seen all the way back to redshifts z6 (Sanders & Mirabel, 1996; Hu et al., 2002; Rhoads et al., 2003) and the abundance gradients in disk galaxies (Zaritsky, Kennicutt, & Huchra, 1994). Direct observational measurements of the primordial helium abundance also rest on measuring the trend of He/H vs. CNO/H in external galaxies, and then extrapolating back to zero metallicity, with some claims of accuracy in the third decimal place (Pagel et al., 1992; Pagel & Kazlauskas, 1992; Peimbert, Peimbert, & Luridiana, 2002).
An unsettling result that has unfolded over the past decade (Barker, 1991; Liu et al., 1995, 2000; Garnett & Dinerstein, 2001a; Tsamis et al., 2004) is that when the abundances of C, N, and O are measured in H II regions and planetary nebulae (PNe) using the much weaker recombination emission lines of these elements, the results are often significantly different from those obtained using the stronger collisionally excited forbidden emission lines from the same ions. The discrepancies are typically factors of 2–3, but for some objects they are more than an order of magnitude, and the recombination lines consistently yield higher abundances.
The recombination lines might be expected to be the more reliable abundance indicators because recombination coefficients depend much less strongly on electron temperature than do the collisional excitation coefficients that set the intensities of the collisionally excited lines. However, recombination lines are weak and other processes can compete with recombination in exciting high level lines. These include: Bowen-like fluorescence mechanisms (Grandi, 1976; Ferland, 1992), continuum fluorescence from the ionizing stars (Seaton, 1968; Grandi, 1975a, b, 1976; Escalante, 2002), dielectronic recombination (Garnett & Dinerstein, 2001a, b); and charge exchange (Butler & Dalgarno, 1980). On the other hand, the accuracy of the abundances determined from collisionally excited lines could be affected by temperature or density fluctuations (Peimbert, 1967; Peimbert, Storey, & Torres-Peimbert, 1993; Viegas & Clegg, 1994; Peimbert et al., 2004) or other factors that lead to calculating forbidden line strengths using incorrect or incorrectly weighted electron temperatures. The existence of distinctly different structural components within the PNe giving rise to either only collisionally excited or only recombination lines has also been proposed (Liu et al., 2000; Tsamis et al., 2004). It is important to understand the source of these abundance discrepancies because of the widespread use of these lines as a general tool for measuring chemical abundances.
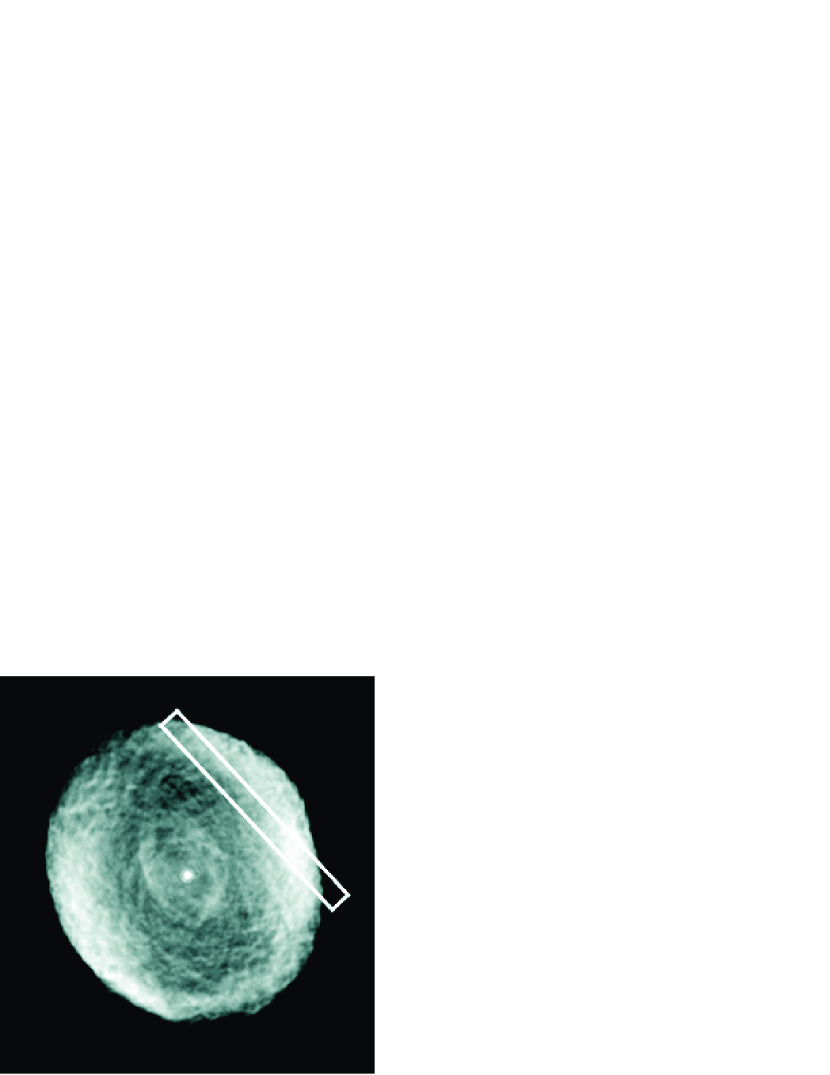
In this paper, we use deep, high-resolution spectra of the planetary nebula IC 418, described previously in the first paper of this series which focused on line identification (Sharpee et al. 2003; Paper I), to investigate the behavior of hundreds of weak permitted emission lines of C, N, O, and Ne in order to gain further insight into the source of the abundance discrepancies. We have chosen to study IC 418 partly because of its high surface brightness, but also because of the apparent simplicity of its projected geometry. Figure 1 presents an HST image of the nebula, showing its well-defined oval shape. The original color image also clearly demonstrates that the bright outer ring consists of gas of a much lower ionization than the fainter inner region. Our spectra support the idea that IC 418 is to first order a symmetrically expanding flow of gas with the faster moving gas on the outside where the ionization is lower. This produces a strong correlation between ionization level and line-of-sight velocity structure, as evidenced by the emission-line profiles, which can be used to help constrain where in the PN shell different emission lines are formed.
It should be noted that IC 418 has a considerably lower ionization level than most PNe due to the moderately low temperature of its central star, so that (a) our data do not include recombination lines from some of the higher ionization states that have been studied in other PNe, and (b) the gas is subjected to a systematically different (softer) continuum shape than is typical for the PNe for which the largest abundance discrepancies have been measured. Also, since Garnett & Dinerstein (2001a) have shown that abundance discrepancies between forbidden and recombination lines correlate inversely with the PN surface brightness, and IC 418 has a relatively high surface brightness, it may not be among the best objects to study in order to understand this phenomenon.
2. Observations and Basic Data Reduction
We observed IC 418 for five nights using the Cassegrain echelle spectrograph on the 4m Blanco telescope at CTIO. For the first two nights, 2001 Dec 27-28 UT, we used a blue setup giving full wavelength coverage over 3500–5950Å with the blue long camera and optics, a 79 line mm-1 echelle grating and a 316 line mm-1 cross-dispersing grating blazed at 4400Å. We then switched to the red long camera and optics, a GG495 order separating filter, the 31.6 line mm-1 echelle grating, and a 316 line mm-1 cross disperser blazed at 7500Å. We used this configuration for two nights with an intermediate setup that covered 5090–7425Å, followed by a final night with a red setup covering 7350–9865Å.
For all three setups the slit width was 1″. The slit length decker was set so as to avoid overlap of the echelle orders at the short wavelength end of the wavelength range of each setup, and this corresponded to 11.9″ for the blue and intermediate setups, and 19.6″ for the red setup. The nebula was slightly larger than the shorter decker length, but fit within the longer decker length.
We observed IC 418 over a span of approximately 6 hours on each night. Most of the data were taken as a series of 1800s (and occasionally 1000s) exposures, but shorter exposures of 30s, 120s, and 300s were also taken with each setup in order to measure the few strongest lines which were saturated on the long exposures. The total observing time for the co-added long exposures for each setup were: 23,600 s (blue), 30,600 s (intermediate), and 18,000 s (red) The position of the slit on the nebula is shown in Figure 1 for the blue and intermediate setups. We used an autoguider to set and maintain the slit position on the nebula, returning each night to the same guide star and using the same offset from the central star. Our experience was that this method gave positioning that was reproducible to an accuracy of less than 1″. The slit was oriented N-S in all cases, which was the direction of the atmospheric dispersion when IC 418 crossed the meridian (at 18 degrees zenith distance) about halfway through each night’s observations. However, this was significantly different from the direction towards the zenith at the start or end of the observations (when IC 418 was about 3h E and 3h W of the meridian, respectively). The autoguider has a red sensitive camera, so while in the red the slit position was maintained fairly well, in the blue there was an extra smearing over about 1.5 ″ across the face of the nebula. The short exposures were generally taken as IC 418 crossed the meridian.
The instrumental resolution was measured to be 9 km sFWHM, which is somewhat narrower than the 15 km sFWHM profiles of the narrowest IC 418 emission lines with high quality profiles. We took Th-Ar comparison spectra about once per hour. The wavelength fits to these comparison spectra each had an RMS internal scatter of about 1 km s, and a mean error that was much smaller. The differential instrumental flexure was small for the intermediate and red setups, but a loose component in the blue optics train led to drifts of many pixels during the nights of the blue setup. We paid careful attention to this during the data reduction process, reducing each exposure of IC 418 to the wavelength scale from the comparison lamp exposure taken closest to it in time. We then made additional small shifts to bring into alignment the mean of the measured wavelengths of many different emission lines from each individual spectrum before co-adding all spectra taken with a particular setup. Small velocity shifts were then made to the co-added spectra to bring the measured wavelengths of night sky lines to their laboratory values.
We then compared the measured wavelengths of nebular emission lines from the overlapping portions of the different wavelength setups. There was no shift between the intermediate and red setups, but the blue setup had to have 1.2 km sadded to its wavelength scale to bring it into agreement with the intermediate setup. After applying these corrections, we believe that the measured wavelengths of individual lines are accurate to about 1 km s, and that the mean wavelength calibration is significantly better than that. From our measurements of 47 Balmer and Paschen lines, we find a heliocentric velocity for IC 418 of +61.3 km s. This agrees well with the published values of +61.0 km s(Acker et al., 1992) and +62.0 km s(Wilson, 1953).
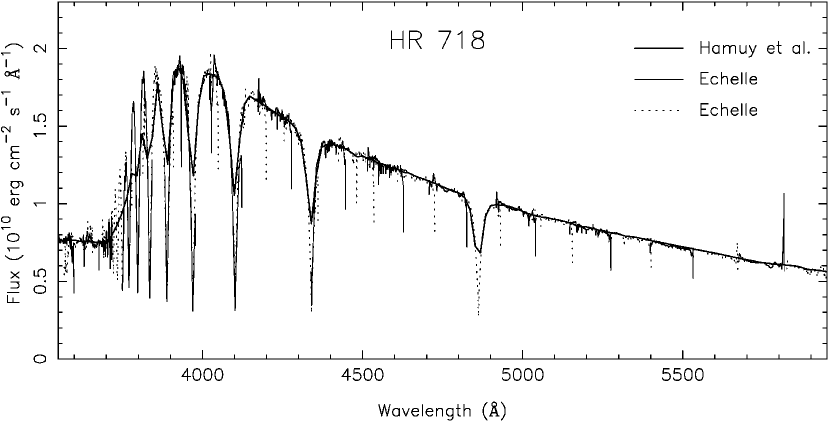
All five nights were photometric. Flux calibrations were obtained by observing on each night, through a 6.6″ wide slit oriented at the parallactic angle, three standard stars (HR718, HR4468 and HR9087) that were calibrated at contiguous 16Å intervals by Hamuy et al. (1994). These are all late-B to early-A type white dwarfs with very broad Balmer absorption lines, each of which fills a substantial fraction of an echelle order. This complicates the flux calibration because the shape of the absorption lines is folded into an instrumental response function that has fairly sharp changes with wavelength. We worked around this problem by also taking spectra of a quartz continuum lamp which we divided into both the IC 418 and standard star spectra to take out the high-order wiggles due to the instrumental response. This permitted us to fit the flux calibration curve using very low-order polynomials. The response curves from the different standard stars all agreed to within a few percent. Figure 2 shows the combined spectra of all the orders for one sample standard star which was reduced using the average response curve, and it agrees well with the low-resolution spectrum from Hamuy et al. (1994). The overlapping parts of adjacent orders agree to between 1–5% except at the very edges of the orders.
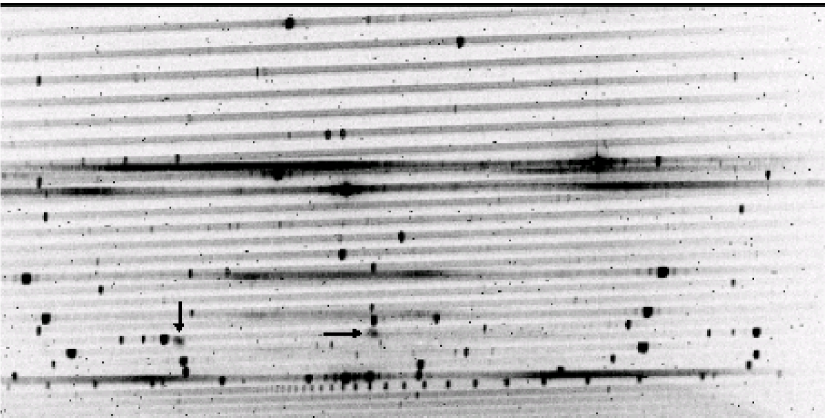
In spite of the good flux calibration achieved with the standard stars, at the much fainter light levels in the IC 418 continuum spectrum we encountered a number of serious problems with scattered light from the strong emission lines. We used the IRAF task apscatter to remove the smoothly varying scattered light component that permeated the two-dimensional images. This worked reasonably well except at the short-wavelength ends of each order, where the orders were crowded too closely together to permit measurement of the scattered light between the orders. The residuals from subtracting off this component got multiplied by the flux calibration curve, producing a false continuum component that curves sharply upwards at either end of each order. In addition, there were strong flares cutting across the orders in the vicinity of the brightest emission lines, and various ghost images whose random nature prevented all attempts at removal. We could only keep track of the positions of these artifacts and take their presence into account when we fit the continuum shape. All of the problems related to scattered light affected the continuum level in an additive way. This meant that after subtracting off the continuum the emission lines intensities could still be measured reliably to the same accuracy as the flux calibrated standard stars except in a few regions where the scattered light dominated the true spectrum. We display one of the long exposure spectra images in Figure 3, showing the prominence of scattered light features in regions of the spectrum.
A number of the emission lines measured in the IC 418 spectra were repeat measurements of the same lines occupying overlapping wavelength ranges in adjacent echelle orders or in regions of overlap between the different setups. The ratios of the line fluxes for these repeat measurements afforded an additional check on the accuracy of the flux measurements. For the ratios of lines measured in different orders within each setup, the means of the ratios are bound to be close to unity because the individual ratios were calculated by taking the line flux from the redder order and dividing it by the line flux from the bluer order. However, the scatter of the ratios about this mean gives an idea of how reproducible the fluxes are from order to order. For lines with S/N20, the 1 scatter is about 20% for the blue setup and 9% for the red setup. These are in fact worst-case measures of the overall flux accuracy because they use lines that are near the edges of the individual orders, where the flux calibration curve is poorly determined. We also compared the flux ratios of lines measured in more than one setup. The intermediate and red line fluxes agree well, with a mean ratio of 0.970.05, whereas the mean intermediate/blue ratio was 1.10.2. We re-scaled the blue fluxes to bring their mean into agreement with the other setups. Another potential check of the flux scale was to compare our results to other published work. However, even the intensity ratios of strong lines close together in the spectrum were very different between our work and the data of Hyung, Aller, & Feibelman (1994) and Henry, Kwitter, & Bates (2000). For example, we find the [O III] 5007/H ratio to be 2.2, whereas Hyung, Aller, & Feibelman (1994) measured 0.9, and Henry, Kwitter, & Bates (2000) found 1.3. These differences are far outside the observational errors and must be due to the three observations having been made at quite different places in the PN shell.
A final problem was that with the blue setup the echelle grating produced Rowland ghosts that appeared as two pairs of weak emission lines on either side of strong, real emission lines. These were removed following the procedure developed by Baldwin et al. (2000).
3. Emission Line Identification
| No. | No. | No. | No. | ||||
|---|---|---|---|---|---|---|---|
| Ion | Lines | Ion | Lines | Ion | Lines | Ion | Lines |
| Ar III | 3 | Fe III | 14 | N III | 4 | O III | 4 |
| Ar IV | 2 | Fe III | 1 | Ne I | 4 | P II | 1 |
| C I | 3 | H I | 76 | Ne II | 8 | S II | 4 |
| C I | 1 | He I | 149 | Ne III | 2 | S II | 21 |
| C II | 83 | Mg I | 1 | Ni II | 1 | S III | 5 |
| Cl II | 3 | Mg II | 11 | Ni III | 1 | S III | 2 |
| Cl III | 6 | N I | 2 | O I | 3 | Si II | 11 |
| Fe I | 2 | N I | 23 | O I | 61 | Si III | 1 |
| Fe II | 24 | N II | 4 | O II | 6 | ||
| Fe II | 2 | N II | 85 | O II | 120 |

We extracted the spectra with a specialized program that uses the number of counts in each pixel in the original two-dimensional image to calculate the variance in each pixel of the extracted spectrum. We then kept track of the variance through the further reduction steps so that we accurately knew the signal-to-noise (S/N) at each pixel in the final, fully calibrated spectrum. With this information, we could then automatically search for emission lines above a consistent S/N threshold, using the line-finding program RDGEN (Carswell et al., 2001). The output of RDGEN is a list of wavelengths and S/N of features whose intensities exceed that of the continuum by a statistically significant amount. We used a non-interactive program to fit Gaussian profiles to those features in this list that have single-peaked profiles, roughly half of the total number. The remaining features have double-peaked or blended profiles, and their intensities were determined either by the interactive deblending option in the IRAF task splot or, in some cases, by simply integrating the line flux above the continuum.
These steps produced a list of accurately measured wavelengths, widths, and fluxes for over 1523 line detections, including repeat detections in adjacent orders and set-ups, down to a consistent S/N limit of 7 which was the minimum value we accepted for a clearly defined line. An additional 52 line detections in the range S/N which appeared to be real features on the original two-dimensional images were also included. Telluric emission lines were screened out by inspection of the two-dimensional images for features of near instrumental resolution and uniform slit illumination, characteristically different then the distinct profiles of assumed nebular lines, and by comparison of wavelengths and fluxes to the night sky emission line atlases of Osterbrock et al. (1996, 1997). Elimination of likely night sky features left a list of 807 unique emission lines from the nebula. These were dereddened using the Cardelli, Clayton, & Mathis (1989) reddening curves with the standard value of RV =3.1. We used 20 pairs of hydrogen Balmer and Paschen lines arising from the same upper levels to find a reddening coefficient . This value fits in the middle of the range of other published values including 0.25 from Harrington et al. (1980), 0.29 from Mendez (1989), 0.21 from Hyung, Aller, & Feibelman (1994), 0.34 determined by Shaw & Dufour (1995) in their re-analysis of the Hyung, Aller, & Feibelman (1994) data, and 0.14 from Henry, Kwitter, & Bates (2000). This wide scatter may be due to differential reddening across the nebula and the differing regions imaged, and/or to the difficulty in determining an accurate reddening value due to differing qualities of flux calibration, and numbers and types of lines utilized in its calculation.
The final step in the data reduction process was to properly identify the many hundreds of emission lines. We did this using EMILI, our publicly available111http://www.pa.msu.edu/astro/software/emili/, automated EMIssion Line Identifier computer code which is described in Paper I. For each observed line, EMILI generates a list of suggested identifications based on agreement with the expected wavelength and flux, and on the presence of other expected lines from the same suggested multiplet. These are the same steps that would be carried out in a manual identification of the emission lines, but EMILI carries them out much more rigorously and consistently. The user then takes the lists of suggested identifications, typically with several rank-ordered possibilities per observed line, and selects the identifications that make the best physical sense.
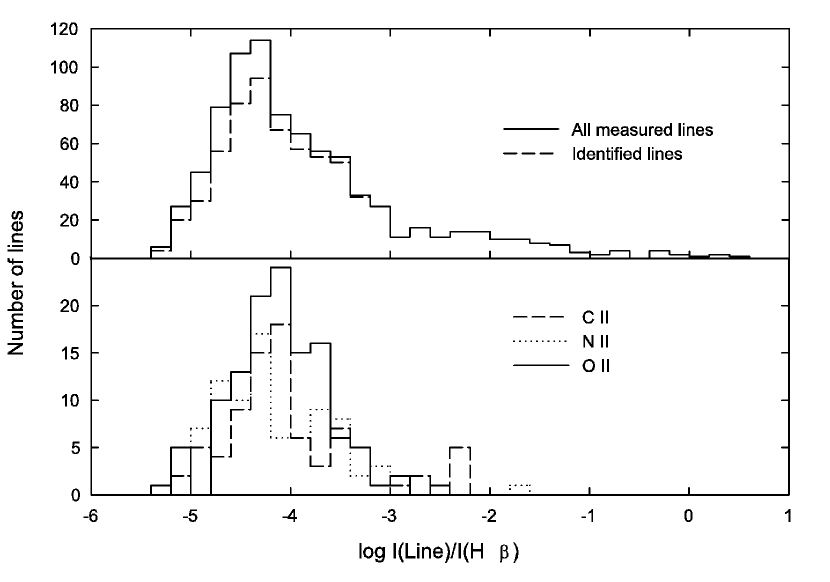
This resulted in solid identifications for 624 of the 807 observed IC 418 emission lines, and possible identifications for an additional 72 lines. The full line list is given in Table 3 of Paper I. Here in Table 1 we summarize for each ion the numbers of identifications that have been rated in Paper I as definite. There are a total of 754 such line identifications, of which 480 had one dominant candidate identification, with a further 144 observed lines which had two or more reasonable candidate identifications and which we interpreted as possible blends. The dereddened strengths of these identified lines range down to slightly below 10-5 the strength of H. Figure 4 shows the distribution of all observed lines strengths and the strengths of the permitted lines of the most prominent heavy ions. Further details of the observations and reductions are given by Sharpee (2003).
4. Line Profiles
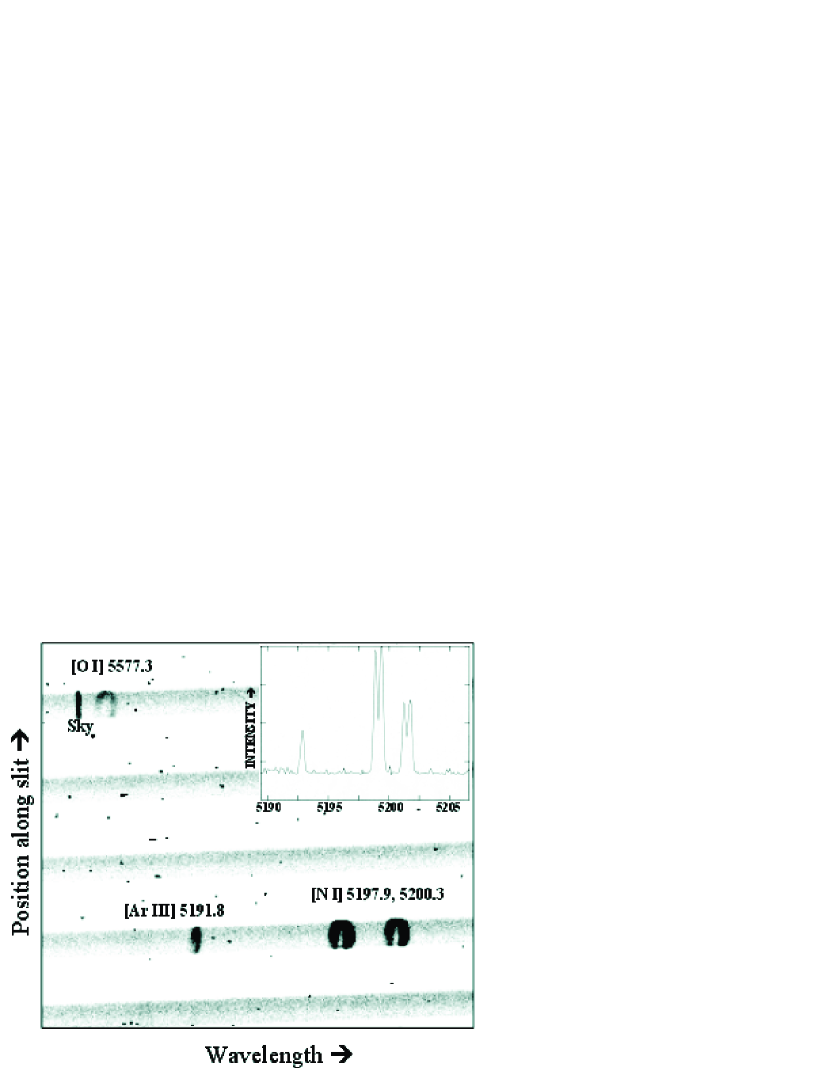
As noted in § 1, one of the reasons we chose to observe IC 418 at high spectral resolution is that it has a simple geometry with a fairly large projected velocity stratification of the emission lines. A representative segment of the two-dimensional spectrum is shown in Figure 5. It is clear that the low ionization lines from IC 418 have an oval shape, becoming strongly double peaked in the central part of the slit, which is characteristic of the spectrum of an expanding shell. In contrast, the higher ionization lines from the PN are single-peaked all along the slit, which we interpret to mean that they come from an interior part of the nebula that has a much lower expansion velocity that was directed primarily perpendicular to the line of sight for our slit position.
The discussion throughout this paper deals only with spectra extracted over the central 6.5″ section of the slit where the low-ionization lines are clearly double-peaked. Compared to spectra that bin over the full slit length, the extracted spectra summed over the restricted length of the slit (a) more accurately refer to the same spot in the nebula when we compare the spectra taken with the different setups, and (b) emphasize the profile differences between lines coming from lower ionization regions and those coming from higher ionization regions. The inset in Figure 5 shows a part of the spectrum extracted along one of the orders that is visible in the main figure, and illustrates the difference in line profiles between the [N I] 5198, 5200 and [Ar III] 5191 lines. These same characteristics are seen in both the two-dimensional images and the extracted spectra for all of the strong forbidden lines, and are caused by the kinematical structure of the nebula which produces different line profiles based on the location within the nebula where the lines are formed.
In Figure 6 we display a number of line profiles from ions with significant numbers of permitted lines in our spectrum, and ions for which we have measured both forbidden and permitted lines in IC 418, where each box shows to the right of the profile the FWHM (in km s) of the line. The only forbidden line profile that appears to be inconsistent is the double-peaked structure of [N II] 6527, which is the weak, highly forbidden electric quadrupole transition arising from the same upper level as the single-peaked [N II] 6548, 6583 profiles. We have no explanation for this single discrepancy other than the possibility that this line profile may be affected by a line blend.
The distinct profiles provide a valuable tool for diagnosing the physical region where individual lines are formed. Consider, for example, the profiles of permitted O I 7772, 8446 and 9266 from Figure 6. The 7772 and 9266 lines have profiles more similar to those of the forbidden [O II] than to the [O I] lines, indicating that they are likely to be formed in the same location as the collisionally-excited lines of the next higher ionization state, i.e., O+, as would be appropriate if their formation were due to electron recapture. By contrast, the permitted 8446 line has the same profile as the collisionally excited [O I] lines, indicating that it is formed in the Oo region. In fact, 8446 has been shown to be predominately excited in nebulae by resonance fluorescence from the Oo ground state (Grandi, 1975a). Therefore, the profiles of individual permitted lines give valuable information about their parent ions and the excitation processes that produce them. We will use this information to constrain the excitation mechanisms for the various lines used in the abundance analysis that follows.
4.1. Continuum Fluorescence vs. Recombination Excitation
Those ions for which we have definite observations of both collisionally excited and numerous radiative recombination lines for which cross sections are available are N+, O+, and O+2. We use both the profiles and the strengths of the permitted lines to try to isolate a subset of transitions that should yield reliable ion abundances. As illustrated in the preceding discussion, for a number of lines that are generally agreed to be significantly enhanced by fluorescence scattering in other PNe both the line strengths and the line profiles indicate that this is also occurring in IC 418. Specifically, for permitted N I and O I lines having the same multiplicity as the ground state, the profiles clearly resemble those of collisionally excited lines of the same ion, as opposed to those of the next higher stage of ionization.
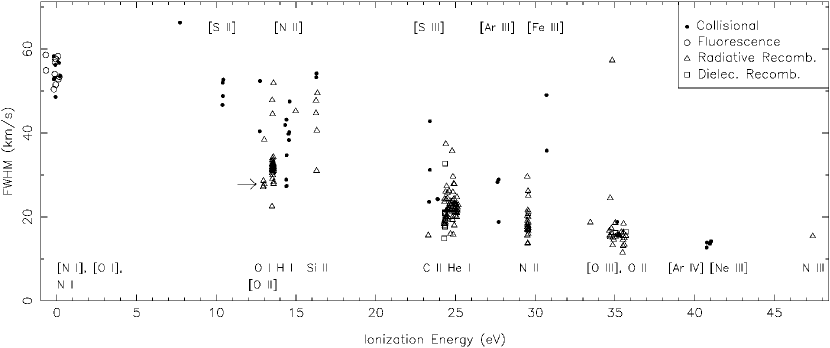
There are a number of other cases where Bowen-like or continuum fluorescence are thought to contribute substantially to a line’s intensity, and this situation should be revealed by the line profile. In order to quantify this relationship we selected lines from Table 3 of Paper I with S/N 20, and either a single ID with an EMILI-provided Identification Index (IDI) values of five or less, or a blend of lines from the same multiplet spaced within the instrumental resolution of 9 km swith at least one component meeting the IDI value requirement. In Figure 7 these lines’ FWHMs are plotted against the ionization energies required to produce their parent ions. This means for lines produced by recombination processes this is the ionization energy necessary to produce the next higher ionization state than the ion the transition is observed in. For purposes of this plot we have assumed that all forbidden lines are produced through electron collisional excitation, and all permitted lines are produced either by radiative or dielectronic recombination. Exceptions include those N I and O I permitted lines from multiplets with the same multiplicity as their respective ground terms, since Figure 6 clearly shows that representative lines of those multiplicities are obviously excited by continuum fluorescence. All C II core excited doublets and all quartets are assumed here to be produced by dielectronic recombination (Davey et al., 2000), as are N II quintets and O II sextets (discussed further in § 6), as well as O II lines from multiplets V15, V16, and V36 (discussed further in § 5.4.3).
A clear relationship is seen between line width and ionization energy, reflecting the kinematical structure and ionization stratification of the expanding shell. Lines which deviate from this relation are likely to have alternative excitation mechanisms. For example, the O I 9266 line (FWHM=27.8, ionization energy=13.62 eV, marked with an arrow in Figure 7), which is expected to be one of the more prominent recombination lines, does not have the strongly double-peaked profile of the [O I] collisionally excited lines seen in Figure 6, and fits well in the scheme of Figure 7. We can therefore exclude the possibility that it has a fluorescence component, particularly since it is from a multiplet of different multiplicity than the neutral O 2p4 3P ground term. Its narrow profile indicates that it is likely formed in the interior region of the O+ ionization zone. We note that the Si II permitted lines would actually conform better to the overall relationship if they were assumed to be excited primarily by continuum fluorescence (would be plotted with an ionization energy of 8.15 eV in that case) as is shown quantitatively to be the case in the Orion Nebula by Grandi (1976).
By using line profiles and FWHM as discriminants of the excitation process, we can exclude those permitted lines from abundance calculations whose strengths are significantly augmented by fluorescence processes.
5. Ionic Abundances in IC 418
5.1. Electron density and temperature
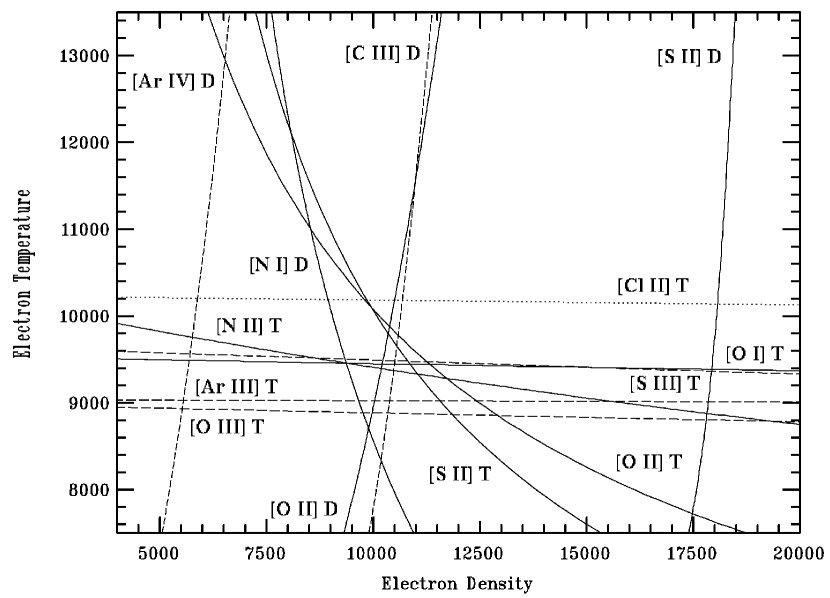
Determining ion abundances from line strengths requires specification of the electron temperature and density of the emitting regions. We have determined the electron density and temperature by standard methods, using the intensity ratios of density-sensitive and temperature-sensitive pairs of forbidden lines to find the locus of possible , values for the different ions represented by each line pair, and these are shown in Figure 8. We used the IRAF package nebular (Shaw & Dufour, 1995) with our reddening corrected line intensities as input, and the output consists of those loci in the – plane commensurate with each of the measured line ratios222We used version 2.0 of the nebular package, but we re-installed in its database the atomic data, spontaneous emission coefficients and collision strengths, used in the original version which are mostly from the compilation of Mendoza (1983) (but see also Table 4.1 of Sharpee (2003) for full details). This is because the revised atomic data supplied with the current version led to a very large scatter in the – values from different sets of lines, indicating some possibly incorrect atomic data..
The intersection points in Figure 8 cluster around values of cm-3, K, although the [S II] 6716/6730 ratio suggests a much higher density than any other diagnostic. This is due to the fact that the [S II] ratio is very near its value for the high density limit, where the ratio becomes insensitive to density, so even small measurement errors translate into large errors in density. The [N I] 5200/5198 intensity ratio is also near its high-density limit, so its apparent agreement with other density measures may be fortuitous. The density inferred from the [Ar IV] 4711/4740 ratio is a bit discrepant from the other values, and suggests that these relatively high ionization lines originate in a significantly lower density region of the nebula.
| Lines - (Å) | Value | + Unc | - Unc |
|---|---|---|---|
| Density (cm-3) | |||
| N I 5198/5200 | 9000 | -6000 | |
| S II 6716/6730 | 17000 | -9000 | |
| O II 3726/3729 | 10000 | +17000 | -5000 |
| Cl III 5517/5537 | 11000 | +4000 | -2000 |
| Ar IV 4711/4740 | 6000 | +10000 | -4000 |
| Temperature (K) | |||
| O I (6300 + 6363)/5577 | 9400 | +600 | -400 |
| S II (6716 + 6731)/(4068 + 4076) | 7000 | +4000 | |
| Cl II (8579 + 9124)/6162 | 10200 | +800 | -600 |
| O II (3726 + 3729)/(7320 + 7330) | 10000 | +4000 | -3000 |
| N II (6548 + 6583)/5755 | 9400 | +900 | -1400 |
| S III (9069 + 9532)/6312 | 9500 | +700 | -500 |
| Ar III (7136 + 7751)/5192 | 9000 | +500 | -400 |
| O III (4959 + 5007)/4363 | 8900 | +400 | -400 |
| /H+ | Line(s) - (Å) | (K) | (cm-3) | Value ()11Value in parenthesis is the power of ten by which the abundance should be multiplied. | ||
|---|---|---|---|---|---|---|
| Co/H+ | [C I] 872722Calculated using task ionic. | 9400 | [O I] | 9000 | [N I] | 1.6(-7) |
| No/H+ | [N I] 5198,5200 | 9400 | [O I] | 9000 | [N I] | 8.6(-7) |
| N+/H+ | [N II] 5755,6548,6583 | 9400 | [N II] | 10000 | [O II] | 4.1(-5) |
| Oo/H+ | [O I] 6300,6363 | 9400 | [O I] | 9000 | [N I] | 5.8(-6) |
| O+/H+ | [O II] 3726,3729,7320,7330 | 10000 | [O II] | 10000 | [O II] | 1.7(-4) |
| O+2/H+ | [O III] 4363,4959,5007 | 8900 | [O III] | 6000 | [Ar IV] | 1.2(-4) |
| Ne+2/H+ | [Ne III] 3869,3969 | 8900 | [O III] | 6000 | [Ar IV] | 4.3(-6) |
| S+/H+ | [S II] 4068,4076,6716,6731 | 7000 | [S II] | 17000 | [S II] | 1.8(-6) |
| S+2/H+ | [S III] 6312,9069,9532 | 9500 | [S III] | 11000 | [Cl III] | 2.4(-6) |
| Cl+/H+ | [Cl II] 6162,8579,912433Ion not implemented in nebular. Instead used task ionic for each line individually, then averaged. | 10200 | [Cl II] | 10000 | [O II] | 1.3(-8) |
| Cl+2/H+ | [Cl III] 5517,5537 | 9500 | [S III] | 11000 | [Cl III] | 5.0(-8) |
| Ar+2/H+ | [Ar III] 5192,7135,7751 | 9000 | [Ar III] | 10000 | [Cl III] | 1.0(-6) |
| Ar+3/H+ | [Ar IV] 4711,4740 | 8900 | [O III] | 6000 | [Ar IV] | 9.0(-10) |
We were not able to measure an accurate temperature from the Balmer jump, because the continuum level at wavelengths longer than rest 3648Å was very poorly determined due to the scattered light problems described in § 2. For various attempts at fitting the continuum shape we found Balmer jump temperatures in the range 5000–7000 K.
5.2. Forbidden Lines
The identifications and measured intensities of the collisionally excited forbidden lines of C, N, O, Ne, S, Ar, and Cl are unambiguous, and it is straightforward to use them to determine the corresponding ion abundances relative to H+. We again used the IRAF nebular package, which includes the ionic and abundance tasks for calculating abundances from the intensities of individual lines and groups of lines, respectively. These tasks solve multi-level atom models to find the populations of the upper levels of emission lines for given input values of and . The calculations were made using the density and temperature appropriate for each ionization state as specified in Table 2. The mean values of the resulting ion abundance ratios derived from the IRAF nebular package tasks using these parameters are given in Table 3.
5.3. Recombination Lines
Due to the combination of high spectral resolution and the low ionization of IC 418 (and hence lower density of emission lines in its spectrum), our echelle spectra reveal numerous individual unblended permitted emission lines from many ionic species. To compute ionic abundances from them it is necessary to isolate a subset of them most likely to be excited purely by radiative recombination. Since permitted lines are generally weak, they could be subject to competing mechanisms of excitation, such as fluorescence and dielectronic recombination, as well as radiative recombination. The relative intensities of these lines, and the established line profile and FWHM versus ionization energy relationships, allow us to gauge the possibility that these two processes influence permitted line intensities, and to choose the best subset of radiative recombination lines for comparison in abundance with their collisionally excited counterparts from the same ions.
| Lines | Source | Transitions11No entry in column indicate that reference was used for all transitions. |
|---|---|---|
| H I | Aller (1984) | |
| He I | Smits (1996) | |
| C II | Davey et al. (1999) | |
| N I | Péquignot, Petitjean, & Boisson (1991) | |
| N II | Victor & Escalante (1990) | |
| Kisielius & Storey (2002) | (3-3) | |
| O I | Péquignot, Petitjean, & Boisson (1991) | |
| O II | Storey (1994) | (3s–3p) |
| Liu et al. (1995) | (3p–3d,3d–4f) | |
| Nussbaumer & Storey (1984) | Mult 15,16,36 | |
| Ne II | Kisielius et al. (1998) | (3–3) |
| Liu et al. (2000) | (3d–4f) |
To create such a subset, Table 3 of Paper I was examined for permitted line IDs meeting several criteria: (1) lines with a FWHM 40 km sfor C II, N II, O II, and Ne II, the upper limit of these ion’s FWHM as seen in Figure 7, (2) an IDI value less than or equal to five, or the highest ranked line among all possible IDs suggested by EMILI, (3) no reasonable alternate IDs with an IDI value within two of the primary ID’s value, (4) multiple detections from the same multiplet, (5) available multiplet effective recombination coefficients. A few additional lines were also included where it was felt that their ID was better than the primary EMILI ID, based upon the relative numbers of other lines in the spectrum belonging to each ID’s parent ion, and upon the levels of excitation energy for the line behind each ID relative to those of other well-known lines. In cases involving likely blends between lines from well-represented species with mutual IDI values violating condition (3), intensities relative to the strongest line in each line’s parent multiplet were compared (by ratio of lines’ effective recombination coefficients) to determine the weaker contributor and its predicted intensity. Its contribution was then subtracted from the observed intensity of the blend and the stronger component recorded in it’s parent ion’s table. The weaker component was not recorded. If the blend constituted the entire multiplet or if the blend was obvious (as for O I and C II lines) this condition was relaxed. This led to a set of 16 C II, 14 N I, 51 N II, 8 O I, 57 O II, and 2 Ne II lines.
Abundances for these lines with respect to hydrogen were determined utilizing the relationship,
| (1) |
where and are the effective recombination coefficients for H and the line under consideration, respectively. Effective recombination coefficients for the lines’ parent multiplets were obtained from the sources listed in Table 4. Values for the coefficients were calculated from these references’ temperature-dependent analytic fit equations using the appropriate ion-specific temperatures listed in Table 5 and assuming =10000 cm-3. A “branching ratio”, , a multiplicative factor equaling the ratio of an individual line’s strength to the sum of strengths of all lines in its parent multiplet,
| (2) |
where are upper level statistical weights and are spontaneous emission coefficients, was calculated and applied to the multiplet’s effective recombination coefficient to yield individual line values . Equation 6 of Kisielius et al. (1998) computes identical branching ratios as the method above and was used where values were unavailable. Both methods assume that fine structure levels are populated according to their statistical weights. Liu et al. (1995), Kisielius & Storey (2002), and Kisielius et al. (1998), respectively, have noted that -coupling inadequately describes the O II, N II, and Ne II 3d–4f configuration transitions. For O II, individual line effective recombination coefficients computed by Liu et al. (1995) under an intermediate coupling case were used for the 3p–3d, and 3d–4f transitions. Similar calculations are not available for either of the other ions. Therefore, the N II 3d–4f lines were assigned to -coupled multiplets, and multiplet effective recombination coefficients were calculated assuming the LS-coupling based values from Escalante & Victor (1990). The Ne II 3d–4f line effective recombination coefficients were taken from the results of Liu et al. (2000) for NGC 6153, who used unpublished sources, so we have accepted the small error introduced by the slight difference in electron temperatures utilized for the two PNe.
| Ion | (K) | Source |
|---|---|---|
| C II | 9500 | [S III] |
| N I | 9400 | [N II] |
| N II | 9000 | [Ar III] |
| O I | 10000 | [O II] |
| O II | 8900 | [O III] |
| Ne II | 8900 | [O III] |
The abundances determined from this set of lines are recorded in Tables 6–9. Multiplet numbers in column 2 of each table were taken from Hirata & Horaguchi (1995), with remaining information coming from Table 3 of Paper I or calculated here. Line intensities given in italics indicate that a correction was made for blending of the type described above. To compute the abundances labeled as “Sum” for each multiplet or configuration, the summed intensities and sum of the ratios of line effective recombination coefficient to tabulated wavelength for all observed multiplet lines were used in Equation 1. Abundance values were calculated under three different assumptions about line optical depths where relevant effective recombination coefficients were available in the literature, viz., Case A (all transitions optically thin), Case B (resonance transitions optically thick), and Case C (transitions terminating on the ground configuration O+ 2p2 2Do term also optically thick). In general, Case B applies to lines from levels having the same spin as the ground state, and Case A applies to lines of other multiplicities.
5.4. Notes on Individual Lines
| C+2/H+ | ||||||||
|---|---|---|---|---|---|---|---|---|
| Line(s) | FWHM | I()/I(H) | () | |||||
| (Å) | Mult | IDI/Rank | S/N | (km/s) | (I(H)=100) | Case A | Case B | Notes |
| V2 (3s 2S–3p 2Po) | ||||||||
| 6578.050 | V2 | 2 A | 870.5 | 18.3 | 0.5374 | 56.5 | 10.3 | |
| V3 (3p 2Po–3d 2D) | ||||||||
| 7231.340 | V3 | 3 A | 255.3 | 23.6 | 0.1692 | 294.4 | 4.2 | |
| 7236.420 | V3 | 2 A | 21.1 | 0.4673 | 451.5 | 6.4 | ||
| 7237.170 | V3 | 15.5 | 16.6 | 0.0489 | 425.3 | 6.0 | ||
| Sum: | V3 | 0.6854 | 397.4 | 5.6 | ||||
| V4 (3s 2Po–4s 2S) | ||||||||
| 3918.967 | V4 | 4 A | 226.4 | 18.7 | 0.1068 | 182.3 | 59.4 | |
| 3920.682 | V4 | 3 A | 372.8 | 18.3 | 0.2052 | 175.3 | 57.1 | |
| Sum: | V4 | 0.3120 | 177.6 | 57.9 | ||||
| V5 (3d 2D–4p 2Po) | ||||||||
| 5891.600 | V5 | 5 A | 99.2 | 18.6 | 0.0181 | 33.0 | 14.1 | |
| V6 (3d 2D–4f 2Fo) | ||||||||
| 4267.001,183,261 | V6 | 5 A | 536.0 | 38.7 | 0.5712 | 5.6 | 5.5 | |
| V10.03 (4p 2Po–5d 2D) | ||||||||
| 6257.180 | V10.03 | 4 A | 19.9 | 0.0052 | 172.6 | 12.5 | ||
| 6259.560 | V10.03 | 4 A | 63.7 | 17.8 | 0.0084 | 155.0 | 11.3 | |
| Sum: | V10.03 | 0.0136 | 161.3 | 11.7 | ||||
| V12.01 (4p 2Po–6d 2D) | ||||||||
| 4637.630 | V12.01 | 8 C | 19.5 | 23.2 | 0.0056 | 104.5 | 9.1 | |
| V16.04 (4d 2D–6f 2Fo) | ||||||||
| 6151.270,0.540 | V16.04 | 3 A | 127.3 | 26.7 | 0.0253 | 5.9 | 5.8 | |
| 4d 2D–8f2Fo | ||||||||
| 4620.185 | 7 A | 41.7 | 21.5 | 0.0107 | 5.9 | 5.8 | ||
| 4d 2D–9f2Fo | ||||||||
| 4329.675 | 6 B | 20.7 | 21.4 | 0.0070 | 5.4 | 5.3 | ||
| V17.04 (4f 2Fo–6g2G) | ||||||||
| 6461.950 | V17.04 | 6 C | 93.5 | 18.6 | 0.0584 | 5.5 | ||
| V17.06 (4f 2Fo–7g2G) | ||||||||
| 5342.370 | V17.06 | 4 A | 153.2 | 18.4 | 0.0277 | 5.1 | ||
| V17.08 (4f 2Fo–8g2G) | ||||||||
| 4802.740 | V17.08 | 6 B | 72.8 | 19.5 | 0.0183 | 5.7 | ||
| 4f 2Fo–9g2G | ||||||||
| 4491.130 | 5 B | 56.5 | 19.6 | 0.0109 | 5.2 | 11O II 3d 2P3/2–4f D 2[3] 4491.222 (V86a) had smaller IDI=4 but contributes only slightly to C II 4f 2Fo–9g 2G 4292.250 with IDI=5. | ||
| 4f 2Fo–10g2G | ||||||||
| 4292.250 | 6 B | 35.2 | 21.2 | 0.0079 | 5.5 | |||
| N+2/H+ | ||||||||||
|---|---|---|---|---|---|---|---|---|---|---|
| () | ||||||||||
| Line(s) | FWHM | I()/I(H) | EV9011From Escalante & Victor (1990) | KS0222From Kisielius & Storey (2002) | ||||||
| (Å) | Mult | IDI/Rank | S/N | (km/s) | (I(H)=100) | Case A | Case B | Case A | Case B | Notes |
| V3 (3s 3Po–3p 3D) | ||||||||||
| 5666.629 | V3 | 1 A | 176.9 | 17.1 | 0.0414 | 3.8 | 3.2 | 2.4 | 1.9 | |
| 5676.017 | V3 | 1 A | 123.4 | 17.6 | 0.0197 | 4.1 | 3.5 | 2.5 | 2.1 | |
| 5679.558 | V3 | 2 A | 170.8 | 20.7 | 0.0674 | 3.3 | 2.8 | 2.1 | 1.7 | |
| 5686.212 | V3 | 2 A | 70.1 | 18.5 | 0.0127 | 3.5 | 3.0 | 2.2 | 1.8 | |
| 5710.766 | V3 | 1 A | 75.9 | 18.7 | 0.0136 | 3.8 | 3.2 | 2.4 | 1.9 | |
| 5730.656 | V3 | 2 A | 8.9 | 17.5 | 0.0013 | 5.4 | 4.6 | 3.4 | 2.9 | |
| Sum: | V3 | 0.1561 | 3.6 | 3.1 | 2.2 | 1.8 | ||||
| V4 (3s 3Po–3p 3S) | ||||||||||
| 5045.099 | V4 | 3 B | 112.9 | 18.1 | 0.0289 | 68.0 | 11.0 | 33.6 | 4.8 | 33Alternate ID in Paper I, O II 5045.119 (IDI=2) unlikely, 5045.099 is strongest line in multiplet. |
| V5 (3s 3Po–3p 3P) | ||||||||||
| 4601.478 | V5 | 2 A | 104.9 | 17.3 | 0.0263 | 358.9 | 6.7 | 21.2 | 3.7 | |
| 4613.868 | V5 | 2 A | 59.1 | 19.6 | 0.0177 | 414.9 | 7.7 | 24.6 | 4.3 | |
| 4621.393 | V5 | 3 A | 103.9 | 18.0 | 0.0264 | 454.3 | 8.5 | 26.9 | 4.7 | |
| 4630.539 | V5 | 2 A | 217.7 | 16.8 | 0.0805 | 368.6 | 6.9 | 21.8 | 3.8 | |
| 4643.086 | V5 | 1 A | 140.5 | 17.0 | 0.0344 | 473.7 | 8.8 | 28.0 | 4.9 | |
| Sum: | V5 | 0.1858 | 398.5 | 7.4 | 23.6 | 4.1 | ||||
| V15 (3p 1P–3d 1Do) | ||||||||||
| 4447.030 | V15 | 2 A | 19.7 | 16.5 | 0.0039 | 2.7 | 2.7 | 6.2 | ||
| V20 (3p 3D–3d 3Do) | ||||||||||
| 4774.244 | V20 | 1 A | 15.0 | 13.5 | 0.0022 | 97.9 | 2.8 | 117.6 | 2.3 | |
| 4779.723 | V20 | 2 A | 88.9 | 17.8 | 0.0179 | 265.8 | 7.5 | 319.5 | 6.2 | |
| 4781.190 | V20 | 6 A | 7.9 | 28.9 | 0.0013 | 55.8 | 1.6 | 67.1 | 1.3 | |
| 4788.137 | V20 | 2 A | 101.9 | 15.6 | 0.0195 | 187.7 | 5.3 | 225.6 | 4.4 | |
| 4803.286 | V20 | 4 A | 76.5 | 16.9 | 0.0261 | 141.0 | 4.0 | 169.5 | 3.3 | |
| Sum: | V20 | 0.0670 | 166.6 | 4.7 | 200.3 | 3.9 | ||||
| V21 (3p 3D–3d 3Po) | ||||||||||
| 4459.937 | V21 | 6 A | 14.3 | 17.2 | 0.0025 | 20.7 | 218.7 | 8.7 | ||
| 4477.682 | V21 | 4 A | 29.9 | 25.1 | 0.0061 | 22.5 | 238.5 | 9.5 | ||
| 4507.560 | V21 | 5 B | 25.8 | 13.1 | 0.0051 | 10.2 | 107.5 | 4.3 | ||
| Sum: | V21 | 0.0137 | 15.3 | 162.2 | 6.5 | |||||
| V24 (3p 3S–3d3Po) | ||||||||||
| 4994.371 | V24 | 146.2 | 18.6 | 0.0423 | 175.4 | 9.0 | 169.2 | 6.8 | ||
| V28 (3p 3P–3d3Do) | ||||||||||
| 5927.820 | V28 | 2 A | 113.8 | 17.4 | 0.0191 | 278.4 | 7.9 | 345.0 | 6.7 | |
| 5931.790 | V28 | 2 A | 156.7 | 16.7 | 0.0273 | 177.0 | 5.0 | 219.3 | 4.3 | |
| 5940.240 | V28 | 1 A | 63.0 | 18.2 | 0.0139 | 270.5 | 7.7 | 353.1 | 6.5 | |
| 5941.650 | V28 | 1 A | 137.3 | 16.0 | 0.0315 | 109.6 | 3.1 | 135.7 | 2.6 | |
| 5952.390 | V28 | 3 A | 33.7 | 13.8 | 0.0052 | 101.6 | 2.9 | 125.9 | 2.4 | |
| Sum: | V28 | 0.0970 | 158.2 | 4.5 | 196.1 | 3.8 | ||||
| V29 (3p 3P–3d 3Po) | ||||||||||
| 5452.071 | V29 | 3 A | 25.9 | 20.2 | 0.0042 | 91.1 | 4.7 | 135.4 | 5.4 | |
| 5462.581 | V29 | 2 A | 36.4 | 26.2 | 0.0045 | 130.7 | 6.8 | 194.4 | 7.8 | |
| 5478.086 | V29 | 2 A | 19.6 | 16.6 | 0.0030 | 52.4 | 2.7 | 77.9 | 3.1 | |
| 5480.050 | V29 | 1 A | 34.9 | 17.0 | 0.0056 | 97.9 | 5.1 | 145.6 | 5.8 | |
| 5495.655 | V29 | 3 A | 87.5 | 19.1 | 0.0148 | 86.6 | 4.5 | 128.8 | 5.2 | |
| Sum: | V29 | 0.0321 | 87.8 | 4.5 | 130.5 | 5.2 | ||||
| V30 (3p 3P–4s3Po) | ||||||||||
| 3829.795 | V30 | 3 A | 34.2 | 21.3 | 0.0232 | 292.2 | 95.0 | 176.2 | 59.7 | |
| 3842.187 | V30 | 2 A | 33.6 | 19.1 | 0.0126 | 199.6 | 64.9 | 120.4 | 40.8 | |
| 3855.096 | V30 | 2 A | 29.9 | 29.6 | 0.0098 | 155.6 | 50.6 | 93.8 | 31.8 | |
| Sum: | V30 | 0.0456 | 221.9 | 72.2 | 133.8 | 45.3 | ||||
| V31 (3p 1D–3d 1Fo) | ||||||||||
| 6610.560 | V31 | 2 A | 11.7 | 25.0 | 0.0028 | 11.8 | 11.8 | 10.9 | ||
| V36 (3d 3Fo–4p 3D) | ||||||||||
| 6167.750 | V36 | 6 D | 15.9 | 22.1 | 0.0025 | 2.0 | 1.7 | 1.2 | 1.0 | |
| 6170.160 | V36 | 1 A | 8.7 | 15.5 | 0.0009 | 1.5 | 1.3 | 0.9 | 0.8 | |
| 6173.310 | V36 | 1 A | 20.1 | 13.6 | 0.0023 | 2.6 | 2.3 | 1.6 | 1.3 | |
| Sum: | V36 | 0.0057 | 2.2 | 1.8 | 1.2 | 1.1 | ||||
| V54 (3d 3Po–4p 3S) | ||||||||||
| 6809.970 | V54 | 4 A | 12.6 | 24.6 | 0.0021 | 38.2 | 8.4 | 13.9 | 2.6 | |
| 6834.090 | V54 | 5 B | 6.5 | 31.9 | 0.0016 | 48.8 | 10.8 | 17.8 | 3.3 | |
| Sum: | V54 | 0.0037 | 47.5 | 10.5 | 17.3 | 3.2 | ||||
| V61.15 (4p 3D–5s 3Po) | ||||||||||
| 8676.090 | V61.15 | 5 A | 4.9 | 32.3 | 0.0012 | 1.7 | ||||
| N+2/H+ | ||||||||||
|---|---|---|---|---|---|---|---|---|---|---|
| () | ||||||||||
| Line(s) | FWHM | I()/I(H) | EV9011From Escalante & Victor (1990) | KS0222From Kisielius & Storey (2002) | ||||||
| (Å) | Mult | IDI/Rank | S/N | (km/s) | (I(H)=100) | Case A | Case B | Case A | Case B | Notes |
| 3d-4f | ||||||||||
| 4035.081 | V39a | 3 A | 16.6 | 37.9 | 0.0068 | 0.8 | 0.8 | |||
| 4041.310 | V39b | 3 B | 30.2 | 24.9 | 0.0119 | 0.8 | 0.8 | 44O II 3d 4F5/2–4f F 2[2] 4041.278 (V50c) had smaller IDI=2 but contributes only slightly to N II 3d 3F–4f G 2[9/2]5 4041.310 with IDI=3. | ||
| 4043.532 | V39a | 4 A | 8.7 | 24.3 | 0.0041 | 0.4 | 0.4 | |||
| 4176.159 | V43a | 3 A | 13.0 | 27.3 | 0.0064 | 0.9 | 0.9 | |||
| 4236.927 | V48a | 2 A | 18.0 | 14.3 | 0.0030 | 0.7 | 0.7 | |||
| 4433.475 | V55b | 6 | 11.9 | 23.6 | 0.0028 | 2.6 | 2.5 | |||
| 4530.410 | V58b | 3 A | 21.6 | 16.7 | 0.0042 | 0.4 | 0.4 | |||
| 4552.522 | V58b | 3 A | 11.3 | 22.1 | 0.0026 | 1.0 | 55Multiplet effective recombination coefficient taken from Péquignot, Petitjean, & Boisson (1991). Assumed branching ratio of 1. Resulting line effective recombination coefficient agrees well with value calculated from results of Liu et al. (2000). | |||
| 4678.135 | V61b | 2 A | 5.8 | 24.3 | 0.0014 | 0.5 | 0.5 | |||
| Sum: | 3d–4f | 0.7 | 0.7 | 66Total intensity used for opacity case A is I(3d–4f)=0.0432 (including 4552.522) and for case B I(3d–4f)=0.0406 (not including 4552.522) where I(H)=100. | ||||||
| O+2/H+ | |||||||||
|---|---|---|---|---|---|---|---|---|---|
| Line(s) | FWHM | I()/I(H) | () | ||||||
| (Å) | Mult | IDI/Rank | S/N | (km/s) | (I(H)=100) | Case A | Case B | Case C | Notes |
| V1 (3s 4P–3p 4Do) | |||||||||
| 4638.856 | V1 | 2 A | 125.4 | 18.4 | 0.0196 | 2.0 | 1.9 | 11Although C II 4p2P–6d 2D5/2 4638.916 (V12.01) not listed as ID in Table 3 of Paper I, it likely contributes given intensity of companion line at 4637.630 and predicted intensity: I(4638.916)=0.0101 (I(H)=100). | |
| 4641.810 | V1 | 1 A | 156.1 | 15.1 | 0.0422 | 1.7 | 1.7 | ||
| 4649.135 | V1 | 1 A | 210.8 | 15.6 | 0.0670 | 1.4 | 1.4 | ||
| 4650.838 | V1 | 1 A | 99.3 | 15.5 | 0.0217 | 2.2 | 2.1 | ||
| 4661.633 | V1 | 1 A | 115.0 | 15.6 | 0.0231 | 1.9 | 1.8 | ||
| 4673.733 | V1 | 1 A | 22.8 | 16.4 | 0.0041 | 2.1 | 2.0 | ||
| 4676.235 | V1 | 1 A | 77.3 | 16.2 | 0.0158 | 1.5 | 1.5 | ||
| 4696.353 | V1 | 1 A | 14.4 | 14.7 | 0.0027 | 2.3 | 2.2 | ||
| Sum: | V1 | 0.1968 | 1.7 | 1.6 | |||||
| V2 (3s 4P–3p 4Po) | |||||||||
| 4317.139 | V2 | 1 A | 57.8 | 16.4 | 0.0159 | 3.0 | 2.2 | ||
| 4336.859 | V2 | 1 A | 12.2 | 11.5 | 0.0037 | 2.2 | 1.6 | ||
| 4345.560 | V2 | 1 A | 39.6 | 15.8 | 0.0192 | 3.7 | 2.6 | ||
| 4349.426 | V2 | 0 A | 77.3 | 18.6 | 0.0330 | 2.5 | 1.8 | ||
| 4366.895 | V2 | 1 A | 53.0 | 13.4 | 0.0136 | 2.4 | 1.7 | ||
| Sum: | V2 | 0.0854 | 2.8 | 2.0 | |||||
| V5 (3s 2P–3p 2Do) | |||||||||
| 4414.898 | V5 | 1 A | 113.7 | 15.0 | 0.0303 | 6.0 | 1.0 | ||
| 4416.975 | V5 | 3 A | 92.2 | 15.5 | 0.0197 | 7.0 | 1.1 | ||
| Sum: | V5 | 0.0500 | 6.4 | 1.0 | |||||
| V10 (3p 4Do–3d 4F) | |||||||||
| 4069.623 | V10 | 1 A | 18.9 | 0.0204 | 2.1 | ||||
| 4069.882 | V10 | 1 A | 13.0 | 0.0199 | 1.3 | ||||
| 4072.153 | V10 | 1 A | 100.3 | 15.2 | 0.0327 | 1.4 | |||
| 4075.862 | V10 | 2 A | 17.0 | 0.0442 | 1.3 | ||||
| 4078.842 | V10 | 2 A | 23.0 | 16.3 | 0.0056 | 1.6 | |||
| 4085.112 | V10 | 1 A | 22.5 | 16.7 | 0.0076 | 1.7 | |||
| 4092.929 | V10 | 1 A | 16.8 | 10.8 | 0.0032 | 1.0 | |||
| Sum: | V10 | 0.1336 | 1.4 | ||||||
| V11 (3p 4Do–3d 4P) | |||||||||
| 3907.455 | V11 | 3 A | 13.5 | 21.9 | 0.0035 | 99.3 | 3.6 | 3.4 | |
| V12 (3p 4Do–3d 4D) | |||||||||
| 3882.194 | V12 | 3 A | 27.4 | 13.7 | 0.0063 | 1.9 | 1.9 | 1.0 | |
| 3883.137 | V12 | 4 A | 10.3 | 23.7 | 0.0027 | 30.5 | 24.7 | 3.4 | |
| Sum: | V12 | 0.0090 | 2.7 | 2.6 | 1.3 | ||||
| V15 (3s′ 2D–3p′ 2Fo) | |||||||||
| 4590.974 | V15 | 2 A | 73.2 | 16.5 | 0.0143 | 7.9 | |||
| 4596.176 | V15 | 2 A | 37.8 | 15.5 | 0.0094 | 7.4 | |||
| Sum: | V15 | 0.0237 | 7.7 | ||||||
| V16 (3s′ 2D–3p′ 2Do) | |||||||||
| 4351.260 | V16 | 5 A | 16.5 | 19.2 | 0.0080 | 4.6 | |||
| V19 (3p 4Po–4d 4P) | |||||||||
| 4121.462 | V19 | 2 A | 17.5 | 0.0166 | 106.5 | 6.1 | 5.7 | ||
| 4132.800 | V19 | 3 A | 34.8 | 11.5 | 0.0083 | 29.9 | 1.6 | 1.5 | |
| 4153.298 | V19 | 3 A | 75.7 | 15.1 | 0.0184 | 55.5 | 2.4 | 2.3 | |
| Sum: | V19 | 0.0433 | 56.6 | 2.8 | 2.6 | ||||
| V20 (3p 4Po–3d4D) | |||||||||
| 4104.990 | V20 | 1 A | 10.4 | 14.2 | 0.0046 | 5.4 | 0.9 | 0.8 | |
| 4110.786 | V20 | 1 A | 19.2 | 15.0 | 0.0075 | 24.0 | 3.2 | 3.0 | |
| 4119.216 | V20 | 1 A | 61.2 | 17.3 | 0.0219 | 2.6 | 2.5 | 1.4 | |
| 4120.278 | V20 | 2 A | 17.4 | 0.0068 | 12.0 | 8.8 | 1.2 | ||
| Sum: | V20 | 0.0408 | 4.0 | 2.4 | 1.4 | ||||
| V25 (3p 2Do–3d 2F) | |||||||||
| 4705.346 | V25 | 4 A | 61.4 | 14.6 | 0.0183 | 17.1 | 16.6 | 1.0 | |
| V28 (3p 4So–3d4P) | |||||||||
| 4890.856 | V28 | 4 A | 50.5 | 33.5 | 0.0137 | 208.6 | 12.1 | 11.2 | |
| 4906.830 | V28 | 3 A | 22.5 | 13.1 | 0.0042 | 34.5 | 1.7 | 1.6 | |
| 4924.529 | V28 | 1 A | 25.1 | 16.4 | 0.0089 | 49.0 | 2.1 | 2.0 | |
| Sum: | V28 | 0.0268 | 72.6 | 3.5 | 3.2 | ||||
| V36 (3p′ 4So–3d′ 4P) | |||||||||
| 4185.439 | V36 | 1 A | 22.9 | 16.2 | 0.0081 | 3.2 | |||
| 4189.788 | V36 | 2 A | 34.0 | 21.2 | 0.0124 | 3.8 | |||
| Sum: | V36 | 0.0205 | 3.5 | ||||||
| O+2/H+ | |||||||||
|---|---|---|---|---|---|---|---|---|---|
| Line(s) | FWHM | I()/I(H) | () | ||||||
| (Å) | Mult | IDI/Rank | S/N | (km/s) | (I(H)=100) | Case A | Case B | Case C | Notes |
| 3d-4f | |||||||||
| 4087.153 | V48c | 2 A | 24.5 | 14.5 | 0.0045 | 1.5 | |||
| 4089.288 | V48a | 2 A | 37.9 | 13.3 | 0.0114 | 1.0 | |||
| 4095.644 | V48c | 2 A | 19.4 | 10.5 | 0.0042 | 1.9 | |||
| 4097.257 | V48b | 2 A | 42.8 | 14.9 | 0.0095 | 1.4 | |||
| 4275.551 | V67a | 2 A | 13.5 | 33.4 | 0.0065 | 1.1 | |||
| 4277.427 | V67c | 3 A | 10.7 | 24.9 | 0.0033 | 2.3 | |||
| 4281.313 | V53b | 3 B | 9.1 | 20.9 | 0.0019 | 3.3 | |||
| 4282.961 | V67c | 2 A | 13.4 | 16.1 | 0.0026 | 2.3 | |||
| 4285.684 | V78b | 2 A | 16.5 | 13.2 | 0.0031 | 1.5 | |||
| 4294.782 | V53b | 2 A | 21.1 | 27.8 | 0.0059 | 2.3 | |||
| 4303.823 | V53a | 2 A | 7.9 | 14.6 | 0.0066 | 1.9 | |||
| 4307.232 | V53b | 3 A | 45.3 | 19.5 | 0.0119 | 10.4 | 22Possibly contaminated by C II 4p 2P–7s 2S1/2 4307.580 (V12.02). Wavelength difference with observed line too large for EMILI to assign a IDI value. | ||
| 4466.435 | V86b | 3 A | 32.4 | 25.1 | 0.0029 | 2.9 | |||
| 4489.461 | V86b | 3 A | 7.0 | 23.0 | 0.0007 | 1.0 | |||
| 4602.129 | V92b | 2 A | 12.0 | 12.6 | 0.0022 | 1.2 | |||
| 4609.436 | V92a | 2 A | 23.7 | 15.3 | 0.0060 | 1.3 | |||
| Sum: | 3d–4f | 0.0832 | 1.7 | ||||||
| Line(s) | FWHM | I()/I(H) | N+i/H+ | |||||
|---|---|---|---|---|---|---|---|---|
| (Å) | Mult | IDI/Rank | S/N | (km/s) | I(H=100)) | Case A | Case B | Notes |
| He+/H+ (10-2) | ||||||||
| 5875.615 | V11 | 4 A | 5395.0 | 25.9 | 13.6746 | 9.5 | ||
| 4471.474 | V14 | 4 A | 1935.0 | 23.7 | 4.4921 | 9.0 | ||
| 6678.152 | V46 | 2 A | 2346.0 | 21.6 | 3.8721 | 10.3 | 10.1 | |
| Average | 22.0388 | 9.5 | 9.5 | 11Case B average includes Case A 4471.474,5875.615 values. | ||||
| N+/H+ (10-4) | ||||||||
| V1 (3s 4P – 3p 4Do) | ||||||||
| 8680.282 | V1 | 1 A | 396.1 | 56.8 | 0.0385 | 11.9 | 11.5 | |
| 8683.403 | V1 | 3 A | 382.0 | 57.6 | 0.0417 | 24.7 | 23.9 | |
| 8686.149 | V1 | 2 A | 52.3 | 0.0220 | 32.7 | 31.7 | ||
| 8703.247 | V1 | 1 A | 254.2 | 54.0 | 0.0268 | 39.9 | 38.7 | |
| 8711.703 | V1 | 1 A | 234.7 | 52.8 | 0.0273 | 31.8 | 30.8 | |
| 8718.837 | V1 | 2 A | 143.9 | 53.4 | 0.0135 | 18.6 | 18.1 | |
| Sum: | V1 | 0.1698 | 21.6 | 21.0 | ||||
| V2 (3s 4P – 3p 4Po) | ||||||||
| 8184.862 | V2 | 7 D | 168.0 | 20.8 | 0.0152 | 29.7 | 25.3 | |
| 8200.357 | V2 | 2 A | 138.6 | 51.5 | 0.0131 | 138.8 | 118.0 | |
| 8216.336 | V2 | 5 B | 304.1 | 62.2 | 0.0598 | 50.4 | 42.9 | |
| 8223.128 | V2 | 1 A | 347.8 | 50.4 | 0.0623 | 132.4 | 112.7 | |
| 8242.389 | V2 | 4 B | 53.9 | 0.0551 | 108.8 | 92.6 | ||
| Sum: | V2 | 0.2055 | 74.2 | 63.2 | ||||
| V3 (3s 4P – 3p 4So) | ||||||||
| 7423.641 | V3 | 1 A | 119.4 | 58.3 | 0.0156 | 157.5 | 52.5 | |
| 7442.298 | V3 | 1 A | 219.9 | 57.7 | 0.0363 | 184.0 | 61.3 | |
| 7468.312 | V3 | 3 A | 59.2 | 0.0583 | 198.3 | 66.1 | ||
| Sum: | V3 | 0.1102 | 186.7 | 62.2 | ||||
| O+/H+ (10-4) | ||||||||
| V1 (3s 5So – 3p 5P) | ||||||||
| 7771.944 | V1 | 2 A | 157.4 | 38.4 | 0.0352 | 3.6 | ||
| 7774.166 | V1 | 1 A | 148.9 | 27.1 | 0.0215 | 3.1 | ||
| 7775.387 | V1 | 1 A | 148.9 | 28.6 | 0.0130 | 3.1 | ||
| Sum: | V1 | 0.0697 | 3.3 | |||||
| V4 (3s 3So – 3p 2P) | ||||||||
| 8446.247,.359,.758 | V4 | 7 B | 68.1 | 1.1419 | 428.8 | 98.8 | ||
| V8 (3p 5P – 3d 5Do) | ||||||||
| 9260.806,.848,.937 | V8 | 1 A | 43.8 | 0.0047 | 3.0 | |||
| 9262.582,.670,.776 | V8 | 1 A | 43.7 | 0.0097 | 3.8 | |||
| 9265.826,.932,6.005 | V8 | 1 A | 99.0 | 27.8 | 0.0125 | 3.5 | ||
| Sum: | V8 | 0.0269 | 3.5 | |||||
| Ne+2/H+ (10-5) | ||||||||
| 3d–4f | ||||||||
| 4219.745 | V52a | 2 A | 8.0 | 19.9 | 0.0015 | 2.8 | ||
| 4391.991 | V55e | 3 A | 7.4 | 15.8 | 0.0022 | 2.3 | 22Ignoring Ne II 3d 4F9/2–4f 2[5] 4391.995 (V55e) as was done by Liu et al. (2000). | |
| Average: | 3d–4f | 0.0037 | 2.4 | |||||

Although permitted lines from numerous ionic species are found within our spectra, we concentrate mainly on ions represented by both collisionally excited lines and radiative recombination lines selected by the above procedure: N+, O+, O+2, and Ne+2, and for other ions with prominent recombination line spectra: He+, C+2, and N+2. Several works have discussed the excitation mechanisms of specific ions purported recombination lines (Grandi, 1975a, b, 1976; Liu et al., 1995; Esteban et al., 1998, 1999; Liu et al., 2000). We compare our results with these references’ interpretations for their excitation sources.
5.4.1 C II
Grandi (1976) has qualitatively shown that C II 4267 (multiplet V6) is excited primarily by radiative recombination, a conclusion also reached by Harrington et al. (1980) for IC 418. The excellent agreement seen between the 4267 abundance and those obtained from the numerous high excitation, high angular momentum upper term lines listed in Table 6 confirms this, as such terms are not excitable by ground term fluorescence processes and should be populated exclusively by radiative recombination.
The remaining lines listed in Table 6 come from terms for which Grandi (1976) has calculated that continuum fluorescence plays a dominate role in exciting in the Orion Nebula. Continuum fluorescence from the the 2p 2Po ground term via central star radiation in resonance lines is capable of exciting higher 2S and 2D terms directly (e.g. the upper terms of multiplets V3, V4, V10.03 and V12.01) or 2Po terms indirectly following cascades from excited 2S and 2D terms (multiplets V2 and V5). The abundance pattern recorded for these lines in Table 6 agrees generally with such a scenario, with the larger abundance from multiplet V4 reflecting the lack of alternate optical cascade paths for its 3s 2S upper term and its direct excitation through a resonance line. Grandi (1976) predicts a recombination-only intensity of the multiplet V4 line 3921 around a tenth the observed strength, an amount which is coincidentally sufficient to align its abundance determined here with that of 4267.
However, the evidence for continuum fluorescence excitation among C II lines arising from purported continuum fluorescence-enhanced terms is not corroborated by line profile difference with those from lines thought to be excited by radiative recombination alone. A comparison of line profiles in Figure 6 between 3919, 3921 (multiplet V4), 5892 (multiplet V5), and 6260 (multiplet V10.03) which should be enhanced by continuum fluorescence, and those of higher angular momentum and excitation lines 6462 (multiplet V17.04) and 5342 (multiplet V17.06) which are unaffected by continuum fluorescence, shows no remarkable difference. Plots of the FWHM and S/N versus calculated abundance for lines listed in Table 6, shown in Figure 9, shows no discernible trend. If continuum fluorescence was the dominate or equal exciter for the 2S, 2Po, and 2D upper term lines in IC 418 with respect to radiative recombination, it would be expected that lines coming from these terms would have profiles and FWHM similar to [N II] or [O II] collisionally excited lines as they their parent ions have a similar ionization potential as C+ and such ions should be nearly co-spatial in the nebula. In addition the calculations of Grandi (1976) also predict a fluorescence enhancement, by factor of 2, for multiplet V3 lines which is not reflected in the abundances determined from its constituent lines observed here. Esteban et al. (1998) fails to show any enhancement of either multiplet V2 or V4 in the Orion Nebula, nor does Esteban et al. (1999) show any enhancement for multiplet V4 in M8. This suggests that the excitation mechanism varies in efficiency from object to object.
From the above, we conclude that while the strengths of multiplets V2, V4, V5, V10.02, and V12.03 appear to have been enhanced, the mechanism for this is uncertain. These multiplets therefore were excluded from the calculation of the final /H+ abundance. For the remaining lines, each case-sensitive multiplet yields an abundance in case B which corresponds to case-insensitive 4267. We therefore adopt the summed abundances determined from multiplets V3, V6, and high excitation lines with upper term angular momentum .
5.4.2 N II
Abundances for N II permitted lines were computed under two opacity cases with two sources of multiplet effective recombination coefficients. The difference in the two sources of coefficients appears to lie in their treatment of low temperature dielectronic recombination. For nearly all triplet multiplets, using the Kisielius & Storey (2002) values resulted in lower abundances than those calculated using the Escalante & Victor (1990) values, and for multiplets observed in common with Liu et al. (2000) (multiplets V3, V5, V20, V28), slightly better consistency. Thus, in accordance with comparisons between case-sensitive and insensitive multiplets, the Kisielius & Storey (2002) derived case B abundances for all triplet multiplets are adopted here. For the singlet lines, 4437 (multiplet V15) had a smaller abundance using the Escalante & Victor (1990) values in both opacity cases, while 6611 (multiplet V31) had nearly equal abundances from both sources. This may reflect uncertainties in their recombination coefficients, and they are not discussed further here.
The abundance pattern that emerges from Table 7 fits a scenario quantitatively proposed by Grandi (1976) to explain the N II emission in the Orion Nebula, and reasonably extrapolated to the larger group of lines observed here in IC 418. The first element is excitation of the 4s 3Po term via pumping of the N II 2p2 3P0 - 2p4s 3P 508.668Å(and 508.697Å; Escalante 2002) resonance lines by the He I 1s2 1S – 1s8p1Po 508.643Å recombination line leading to strong multiplet V30 emission. This is followed by subsequent cascade to enhance multiplets V3 and V5. Starlight continuum fluorescence excitation of the 3d 3Po, 3d 3Do, and to a lesser extent the 5s 3Po upper terms of multiplets V20, V21, V24, V28, V29, and V61.15 via resonance transitions from the ground 3P term, supplement radiative recombination in populating these terms. Cascade via multiplet V24 excites multiplet V4 in turn. All these multiplets show enhanced emission and consequent higher abundances over multiplets better described by pure radiative recombination case, as represented by multiplet V36, and the 3d–4f transitions, which lack direct resonance or subsequent cascade excitation paths. Only multiplet V54 would does not fit this paradigm. Considerable scatter within the 3p–3d multiplet’s individual line abundances with FWHM and S/N, as depicted in Figure 9, agrees with likely departures from -coupling (Esteban et al., 1998; Kisielius & Storey, 2002), while 3d–4f lines, lacking an alternate excitation source are weaker, have smaller S/N, and cluster around lower abundances. However, the strongest members of the 3d–4f transition group: 4035 (multiplet V39a) and 4041 (multiplet V39b), are comparable in intensity to some 3–3 transitions, and still yield abundances consistent with other 3d–4f transitions.
As with C II, evidence for continuum or line fluorescence excitation is not seen among the N II line profiles shown in Figure 6. The profiles of 3839, 3842 of multiplet V30, lines yielding the highest abundances among all the N II lines observed here due purportedly to excitation by the He I line fluorescence mechanism, are no different than any other N II permitted lines depicted in Figure 6. No distinct abundance trend with FWHM is seen in Figure 9. Comparison with a recent N II permitted line emission model of the Orion Nebula (Escalante, 2002), suggests that the He I line fluorescence mechanism is necessary to generate appreciable multiplet V30 emission. However, the same model yields a summed intensity of multiplet V30 emission a factor of four larger than our observed value in terms of percentage of the total amount of emission expected from all N II lines modeled/observed in common. The evidence for a large He I mechanism operating in IC 418 is therefore inconclusive from both the emission model and profiles, despite the seemingly large degree of enhancement in multiplet V30 line abundances, and the additional excitation mechanism responsible for these lines’ strong intensity is unknown.
For the final N+2/H+ abundance, multiplet V30 was excluded from the calculation due to confusion regarding its excitation source. However, since the remaining purported continuum fluorescence-enhanced lines show clear recombination-like profiles, they were included assuming opacity case B. Singlet lines were not included in this calculation.
5.4.3 O II
Our deep observations reveal a rich O II permitted line spectrum for IC 418 consisting of lines from both the doublet and quartet sequences. The procedure used by Liu et al. (2000) in their analysis of their NGC 6153 spectrum was followed in that, for the 3s–3p transitions, the -coupling based effective recombination coefficients from Storey (1994) were used, and, for the 3p–3d and 3d–4f transitions, the Liu et al. (1995) intermediate-coupling calculated effective recombination coefficients were used. The low temperature dielectronic recombination coefficients of Nussbaumer & Storey (1984) were used to obtain abundances for multiplets V15, V16, and V36, are assumed to be in opacity case A.
Liu et al. (2000) assumed opacity case A for doublets and case B for quartets, but our results suggest that case C, optically thick transitions to the 2p3 2Do doublet ground term, yields the most consistent abundance among all multiplets. This would necessitate a much larger population in the 2Do ground term than would be expected under typical nebular physical conditions, although its assumption would seem slightly more physically plausible in IC 418 (with an O+-derived density of 10000 cm-3) than it would in the less dense NGC 6153 (3500 cm-3; Liu et al. 2000), as the IC 418 density significantly exceeds the the 4000 cm-3 critical density of the ground 2Do term. Because case B and C insensitive multiplets V10, V12, V20, and V28 yield near identical abundance under both intermediate-coupling and -coupling calculations (using Storey 1994, not shown in Table 8) in both cases, the choice of case B may be more likely. However, in order to reconcile doublet multiplets V5 and V25 abundances with the quartets, case C must be assumed for them. Since lines arising from O II doublets are less likely to be excited by continuum fluorescence due to difference in multiplicity with the O+ 2p3 4So ground term, they are more likely to represent the effects of purely radiative recombination (with the exception of lines from V15, V16, and V36 discussed below), and such a reconciliation is necessary. Thus, in the discussion below, case C, or the highest opacity case available, is assumed for each multiplet.
The abundance pattern in Table 8 fits in with the Grandi (1976) calculations that all O II permitted line intensities observed in the Orion Nebula are adequately explained by radiative recombination alone. Although Hyung, Aller, & Feibelman (1994) speculates that some O II lines in IC 418 may be susceptible to continuum fluorescence, Grandi (1976) predicts only 20% contribution at most for multiplet V2, and much less for other of the observed multiplets. There is no evidence for continuum fluorescence excitation among any of the line profiles shown in Figure 6. Abundances determined from individual lines within multiplets show good agreement, better than what was exhibited in the N II lines, validating the need for intermediate-coupling effective recombination coefficients for the 3p–3d transitions in both N II and O II lines.
An inspection of Figure 9 does show a trend in increasing abundance with larger FWHM. Some of the lines with higher abundances correspond to lines from multiplets V15, V16, and V36 which are produced primarily by low temperature dielectronic recombination. These are discussed further in § 6. One outlier, 4891 (multiplet V28), has no other obvious ID, and shows no enhancement relative to the other lines of its multiplet in NGC 6153 (Liu et al., 2000). The 3d–4f line 4307 (multiplet 53b), another outlier, might be contaminated by C II 4308 (multiplet V12.02), although there is a large wavelength disagreement, and the contribution might be insufficient to account for the large abundance value given the C II line’s likely intensity compared to other lines observed from the , 2S sequence. Much of the remaining trend can be ascribed to weak lines, as seen in larger scatter of abundance values at low S/N depicted in Figure 9, so it is believed that no real trend in abundance exists with FWHM.
The 3d–4f transitions, with the exception of 4308, show consistent agreement among themselves, and with abundances determined from other multiplets under their case B or C conditions. These transitions are immune to fluorescence excitation and are case insensitive. Although many are weak, the strongest ones, such as 4089 (multiplet V48a), whose branching ratio is insensitive to assumed coupling case (Liu et al., 2000), seem to be good abundance indicators.
Larger abundances were calculated from the intensities of multiplets V15, V16, and V36, all of which are have large low-temperature dielectronic recombination coefficients (Nussbaumer & Storey, 1984). This agrees with the trend seen by Garnett & Dinerstein (2001a) in multiplet V15 among other PNe. The abundances determined from these lines are not included in the final O+2/H+ calculation and are discussed further in § 6.
To compute the final O+2/H+ abundance, the highest opacity case values available for all lines was used, excluding multiplets V15, V16, and V36.
5.4.4 Permitted Lines From Other Ions
As in Liu et al. (2000), the He+/H+ abundance was calculated from the average 4471, 5876, and 6678 individual line abundances, weighted 1:3:1, using the tabulated emissivites of Smits (1996) at =10000 K and =10000 cm-3. Line intensities were corrected for electron collisional excitations from the Heo 2s 3S metastable term by the formalism of Kingdon & Ferland (1995) using =9600 K and =10000 cm-3. Only case A calculations were available for 4471, 5876. Case B was assumed for 6678 in the calculated average.
For the N I lines, the profiles in Figure 6 and the abundances listed in Table 9 clearly show that all lines from quartet multiplets are excited predominantly by continuum fluorescence, as was shown to be the case in the Orion Nebula by Grandi (1975b). Direct multiplet effective recombination coefficients are available only for quartets multiplets in Péquignot, Petitjean, & Boisson (1991). Weak N I doublet lines 8567.735 and 8629.236 (both multiplet V8) may also be identified within our spectra. The 8567 lines sits in a gap among the OH Meinel (6-2) band P branch and but has a peculiar profile on the CCD image which suggests that it might be a scattered light artifact. The 8629 lines is blended with an O2 – (0-1) band feature but possesses a distinct nebular-like profile in the two-dimensional spectrum, and would be the strongest line in the multiplet. Employing the corresponding O II transition effective recombination coefficient (Storey, 1994) yields approximate, opacity case insensitive-abundances of about 2 and 4 for the 8567, 8629 lines respectively, lower than the triplet values, but still a factor of ten times higher than the corresponding collisional line value for N+/H+.
O I 8446 (multiplet V4) has long been known to be excited primarily by starlight continuum fluorescence through excitation via resonance transitions to higher excitation 3So and 3Do terms from the neutral oxygen 3P ground term and subsequent cascade (Grandi, 1975a). The profiles of 8446 (a blend of three transitions), 5299, and 5513, all of which belong to triplet multiplets, show similar morphology to the [O I] 6300, 6364 collisionally excited lines, as seen in Figure 6, and all have similar FWHM, indicating common spatial origin and likely predominate fluorescence excitation. At least 15 other higher excitation lines with good IDI values not listed in Table 9 are visible in triplet and quintet Rydberg sequences in our spectrum. Quintet lines are much weaker than their triplet counterparts. The consistency of abundances determined from them, and their line profiles (7772, 9266, and 6157 in Figure 6) suggest radiative recombination as their primary excitation source.
The spectrum of IC 418 lacks large numbers of Ne II permitted lines, including the strongest 3–3 transitions seen by Liu et al. (2000) in NGC 6153 such as 3694.212 and 3709.621 (both multiplet V1). Many other strong Ne II permitted line multiplets reside just blue-ward of our bandpass, however. Within our spectrum the sole semi-certain Ne II 3–3 transition, Ne II 3777.134 also from multiplet V1, should be weaker than either of the two other lines mentioned above from the same multiplet, and has too large a FWHM to be included in Table 9. On the other hand the strongest 3d–4f transition observed by Liu et al. (2000), Ne II 4219.745 (multiplet V52a), is observed here, as is another line, Ne II 4391.991 (multiplet V55e). Both yield abundances about a factor of two smaller than 3777.134, although Liu et al. (2000) notes that their effective recombination coefficients for 3d–4f transitions, which were utilized here, might be in error by a factor of 2. Another 3d–4f line, Ne II 4457.050 (multiplet V61d) is also present, but, as also seen by Liu et al. (2000) in NGC 6153, has an anomalously high intensity, here yielding an abundance nearly two orders of magnitude greater than any of the lines mentioned above. As this line also has a large FWHM, this is obviously an incorrect ID, although no other obvious ID for it is suggested by EMILI. The Ne+2/H+ abundance, therefore, is drawn only from the two 3d–4f lines that appear to have the best IDs: 4219.745 and 4391.991, although comparisons with the [Ne III] forbidden line abundances are probably not statistically significant using only two presumed recombination lines with uncertain recombination coefficients.
6. Dielectronic Recombination Lines
| Line(s) | FWHM | I()/I(H) | ||||
|---|---|---|---|---|---|---|
| (Å) | Mult. | IDI/Rank | S/N | (km/s) | I(H)=100 | Notes |
| C II | ||||||
| 5125.208 | V12 | 1 A | 29.6 | 14.9 | 0.0058 | |
| 5126.963 | V12 | 1 A | 12.7 | 16.9 | 0.0030 | |
| 6779.940 | V14 | 1 A | 17.9 | 0.0109 | ||
| 6780.600 | V14 | 0 A | 17.7 | 0.0055 | ||
| 6783.910 | V14 | 4 A | 12.4 | 19.1 | 0.0022 | |
| 6791.470 | V14 | 1 A | 51.5 | 19.2 | 0.0066 | |
| 6800.680 | V14 | 0 A | 33.1 | 17.7 | 0.0050 | |
| 5132.947,3.282 | V16 | 6 B | 14.9 | 39.5 | 0.0044 | |
| 5145.165 | V16 | 3 B | 12.3 | 14.8 | 0.0040 | |
| 5151.085 | V16 | 2 A | 16.4 | 20.5 | 0.0046 | |
| 7113.040 | V20 | 5 B | 34.6 | 35.4 | 0.0052 | |
| 7115.630 | V20 | 3 B | 30.8 | 21.1 | 0.0043 | |
| 7119..760,.910 | V20 | 5 B | 41.5 | 42.1 | 0.0070 | |
| N II | ||||||
| 5530.242 | V63 | 2 A | 10.8 | 19.2 | 0.0021 | |
| 5535.347,.384 | V63 | 1 A | 16.9 | 26.4 | 0.0050 | 11Possibly C II 4s 2S1/2–5p 2P 5535.353 (V10) but could include these two lines. 5535.347 is predicted to be strongest in multiplet. |
| 5543.471 | V63 | 1 A | 15.3 | 27.6 | 0.0045 | |
| 5551.922 | V63 | 2 A | 7.5 | 12.0 | 0.0006 | |
| 5179.520 | V66 | 2 A | 18.4 | 18.6 | 0.0033 | 22May include contribution from N II 3p′ 5P–3d′ 5D4 5179.344 (V70), both lines strongest in their respective multiplets. |
| O II | ||||||
| 4465.408 | V94 | 1 A | 32.4 | 14.8 | 0.0059 | 33May be blended with N II 3p 3D1–3d 3P 4465.529 (V21). 4465.408 is strongest line in multiplet. |
| 4467.924 | V94 | 1 A | 22.6 | 14.7 | 0.0041 | 44Alternate ID, Fe II 4p y4G–4d e4F7/2 4467.931, is unlikely. |
| 4469.378 | V94 | 1 A | 12.1 | 13.5 | 0.0022 | 55Alternate ID, O II 3d 2P1/2– 4f D 2[1] 4469.462 (V86c), is not listed in the branching ratio table (Table 4) of Liu et al. (2000). 4469.378 is positioned well and is at about the right intensity relative to the other multiplet lines. |
| 4145.096,6.076 | V106 | 4 B | 17.3 | 19.9 | 0.0059 | 66Primary EMILI ID, Ne II 4s 2P1/2–5p 2S 4146.064, unlikely since lower excitation Ne II not observed at appreciable intensites. 4145.906,6.076 (former not ID’d in Paper I) together represent together 44% the strength of the entire multiplet. |
Garnett & Dinerstein (2001a) have reported an over-abundance of O+2 calculated from multiplet 15 with respect to other multiplets in numerous PNe. We observed enhanced abundances from multiplet V15, as well as from multiplets V16 and V36, as compared with purported one-body radiative recombination lines. These multiplets have large low-temperature dielectronic recombination coefficients (Nussbaumer & Storey, 1984). Their abundances cannot be reconciled with the average abundance from radiative recombination lines at any temperature over the range in which the Nussbaumer & Storey (1984) formalism is valid (to 60000 K).
Garnett & Dinerstein (2001b) proposed that this is the result of enhanced dielectronic recombination occurring at high temperatures due to an increasing number of higher energy auto-ionizing states becoming accessible to recombining electrons. They suggest that this occurs at the interface between a hot central “bubble” and the PN shell, and find a correlation between nebular surface brightness, a proxy for age, and the amount of the discrepancy between abundances determined from recombination and collisionally excited O+2 lines. Smaller, younger, higher surface brightness PNe exhibit a smaller discrepancy than do older, dimmer, larger PNe. IC 418 would fit into this picture as an example of a higher surface brightness PN, and thus may not be expected to have as severe effects from dielectronic recombination as do some other PNe.
Our deep spectra reveal numerous additional lines that from selection rules should be produced primarily by dielectronic recombination. This permits us to evaluate the general importance of dielectronic recombination. In particular, lines from levels having a multiplicity that differs by more than unity from that of the ground state of the next higher stage of ionization, and which originate from upper levels that are fed by permitted transitions from auto-ionizing levels within a few eV of the ionization continuum are almost certain to be strong dielectronic transitions. C II, N II, and O II all have such transitions, which because of their multiplicity or core excitation either cannot or are unlikely to be excited by normal 2-body recombination or fluorescence processes, and we observed and identified a number of such lines. In Table 10 we list observed transitions and intensities for C II, N II, and O II which based upon the Grotrian diagrams should constitute the strongest lines from these ions due to dielectronic recombination excitation. They were selected based on the same criteria as were those permitted lines listed in Tables 6–9.
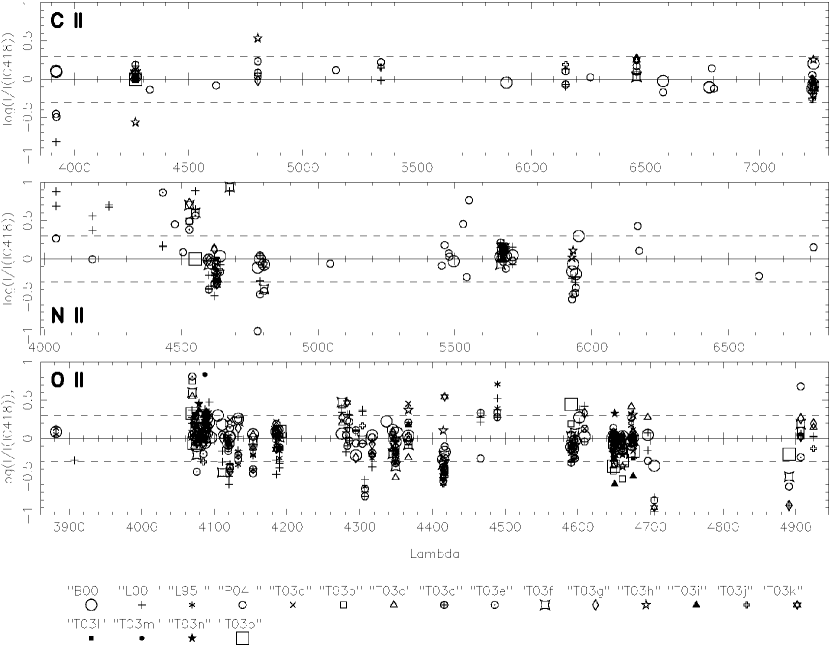
The intensities of these lines are roughly an order of magnitude less than the stronger recombination lines from the same ions. Given the generally weaker strengths of lines which are due primarily to dielectronic recombination (C II quartets, N II quintets, and O II sextets specifically), as compared to the other lines likely to be excited by 2-body recombination alone, it would take a significant enhancement of dielectronic rates to be competitive with normal electron recombination for most high level permitted lines. Dielectronic recombination coefficients from Nussbaumer & Storey (1984) are also available for some multiplets we observed that ordinarily are considered to be excited purely by one-body radiative recombination: C II multiplets V2 and V6, N II multiplet V3, and O II multiplets V1, V2, and V10. However, at the average IC 418 electron temperature of 10000 K, they all yield values at least an order of magnitude less than the one-body radiative recombination coefficients, again necessitating a substantial enhancement in their rates to influence the intensities of their lines. Thus, for IC 418 is unlikely that dielectronic recombination is responsible for the enhanced strength of the high level CNONe permitted lines.
| N+i/H+ | Coll. | Recomb. | Recomb./Coll. |
|---|---|---|---|
| C+2/H+ | 5.5(-4) | ||
| N+/H+ | 4.1(-5) | 3.7(-3)11From continuum fluorescence contaminated lines. | |
| N+2/H+ | 2.6(-4) | ||
| O+/H+ | 1.7(-4) | 3.4(-4) | 2.0 |
| O+2/H+ | 1.2(-4) | 1.6(-4) | 1.3 |
| Ne+2/H+ | 4.3(-6) | 2.5(-5)22From only two lines with uncertain recombination coefficients. | 5.822From only two lines with uncertain recombination coefficients. |
7. Ion Abundance Discrepancies in PNe
A comparison of the ion abundances given in Table 11 for IC 418 reveals that the abundances derived for the ions O+ and O+2 from both forbidden and numerous recombination lines of these ions agree to within a factor of 2, and are not as discrepant as found in other PNe (Liu et al., 1995, 2000), where the disagreements typically exceed a factor of 3. As mentioned previously, this result for IC 418 is consistent with its high surface brightness. Various explanations have been put forward to account for the different abundances derived from forbidden and permitted lines originating from the same ion. Lower temperatures enhance radiative recombination, and higher densities lead to collisional de-excitation of forbidden lines, and therefore it is possible that either (a) additional excitation mechanisms such as continuum fluorescence (Seaton, 1968; Grandi, 1975a, 1976; Escalante, 2002) and dielectronic recombination (Garnett & Dinerstein, 2001a) populate the high level permitted lines, or (b) an inhomogeneous gas having density and temperature fluctuations (Peimbert, 1967; Viegas & Clegg, 1994; Liu et al., 2000; Tsamis et al., 2004) enhances recombination line radiation relative to the collisionally excited lines in the cooler component of the gas. All of these explanations for the enhanced strengths of the CNONe permitted lines have been studied with application to PNe and H II regions, but no consensus has emerged as to the real cause of the discrepancies.
The recent acquisition of high quality spectra of PNe and H II regions now provides an excellent database that enables us to test some of the ideas above. Normally, recombination lines from the same ion should have relative intensities with respect to each other that are roughly the same from object to object, especially lines within the same multiplet. This is because recombination coefficients are insensitive to physical conditions except when densities are sufficiently high to change the population distribution within the fine structure levels of the ground state of the parent ion. This fact constitutes a test for recombination lines.
We have compared the relative intensities of the high-level permitted lines of C II, N II, and O II in IC 418 with the intensities of the same lines observed in the Orion Nebula (Baldwin et al., 2000), NGC 7009 (Liu et al., 1995), NGC 6153 (Liu et al., 2000), NGC 5315 (Peimbert et al., 2004), and selected PNe from the objects studied by Tsamis et al. (2003). We considered only those permitted lines from Tables 6–8 which did not have intensity corrections made to them, to obtain a set of lines with the least ambiguous IDs and least likely to be affected by blending in the spectrum of IC 418. This set does, however, include lines which yielded enhanced abundances relative to other permitted lines in those tables (i.e. C II multiplet V3, N II multiplet V30, etc..). Additional lines excited by low-temperature dielectronic recombination from Table 10, selected under similar criteria as those lines chosen from Tables 6–9 were also considered. For the lines of each ion in the other objects we normalized the sum of the line intensities for that ion in the other object to the sum of the intensities of the same lines in IC 418, and then for each individual line we determined the ratio (other object)/(IC 418). These ratios should all be close to unity if all the lines are formed by recombinations. The measured values are presented in Figure 10, plotted in terms of the wavelengths of the respective lines.
The dashed lines in Figure 10 indicate departures by a factor of two from a ratio of unity, which we take to be an extremely conservative limit for the uncertainties of the measured fluxes of weak lines. The ratios for C II are within these uncertainties, indicating that the C II relative permitted line strengths are consistent with recombination, i.e., are stable from object to object. On the other hand, many of the N II and O II lines have intensity variations that place them outside of the factor of two range. The data demonstrate that significant variations in the relative intensities of supposed recombination lines do exist from object to object, including large variations of intensities among lines of the same multiplet. This suggests that direct recombination is not the only mechanism populating the high levels of these ions, although it is possible in a small fraction of objects that densities could reach levels for which the ground-state fine structure levels could change from their nominal occupation of the ground level, thus producing some of the observed intensity variations. Although the line profiles of these high level permitted lines are generally consistent with their parent ion being the next higher stage of ionization, we conclude that many of these high level permitted lines are due not to electron recombination but to some other undetermined process. Note that in some cases the ratios plotted in Figure 10 are significantly less than unity, indicating that the line in question is relatively stronger in IC 418 than in the other objects, despite our expectation that the anomalous abundance effects should be stronger in the other objects.
Dielectronic recombination and charge transfer with H and He are two of the more likely processes that might augment the population of the CNONe upper levels, however there are reasons for believing that neither of these processes are competitive with radiative recombination. Steigman (1975) and Butler & Dalgarno (1980) have shown that although charge transfer can populate lower levels at high rates compared to recombination, for nebular conditions there is too large an energy threshold for the relevant upper levels of the heavy elements to be populated by this process. In addition, the intensities of the strongest dielectronic recombination lines observed in IC 418 and listed in Table 10, which are fed from auto-ionizing levels that lie just above the ionizing continuum of the parent ion (Nussbaumer & Storey, 1984) e.g., C II 6780 (multiplet V14), N II 5535 (multiplet V63), and O II 4465 (multiplet V94), are all an order of magnitude weaker than the stronger permitted lines from the same ions. Thus, it is unlikely that either of these processes are responsible for the enhanced strengths of the heavy element permitted lines.
8. Summary
From high resolution spectra of the PN IC 418 we have detected and identified emission lines down to intensity levels less than 10-5 that of H. The spectra reveal line profiles that vary greatly from ion to ion, and that line width is an important parameter to use in making line identifications and constraining the excitation processes responsible for a transition. For this expanding, photoionized nebula there is a clear relationship between line width and ionization potential of the emitting ion. Line profiles take advantage of the simple kinematics and ionization stratification of IC 418 to isolate the spatial origins of many permitted lines and shed light onto their excitation mechanisms. For the temperatures and densities of the nebular shell we derive ionic abundances for selected CNONe ions relative to H from the forbidden lines and recombination lines of these ions. Consistent with analyses of other PNe we derive discrepant abundances for the ions from the two types of lines, with the high level permitted lines indicating abundances somewhat higher than those derived from the forbidden lines. The high resolution of our spectra, the low ionization of IC 418, and our careful identification of the lines, enable us to rule out line blends as contributing significantly to the problem of the enhanced permitted line intensities.
We find that high level permitted lines normally assumed to be excited by recombination show substantial variations in relative intensity among different PNe and H II regions, suggesting that other processes are important in exciting many of these putative recombination lines. Although dielectronic recombination is a possible cause and has been suggested as a significant contributor to the permitted lines of CNO ions, the relatively weak dielectronic recombination lines fed from auto-ionizing levels argues against this process as a general explanation for the anomalously strong permitted lines, at least for IC 418. The root cause of the anomalous intensities of the forbidden and permitted lines remains unclear, but probably involves a number of the suggestions discussed above that have appeared in the literature. The one finding that emerges from this study is the importance for the analysis of emission-line objects of using a spectral resolution that resolves intrinsic line profiles.
References
- Acker et al. (1992) Acker, A., Marcout, J., Ochenbein, F., Stenholm, B., & Tylenda, R. 1992, Strasbourg-ESO Catalog of Galactic Planetary Nebulae
- Aller (1984) Aller, L.H., 1984, Physics of Thermal Gaseous Nebulae: Physiscal Processes in Gaseous Nebulae (Boston: D.Reidel)
- Baldwin et al. (2000) Baldwin, J.A., Verner, E.M., Verner, D.A., Ferland, G.J., Martin, P.G., Korista, K.T., & Rubin, R.H. 2000, ApJS, 129, 229
- Barker (1991) Barker, T. 1991, ApJ, 371, 217
- Butler & Dalgarno (1980) Butler, S.E. & Dalgarno, A. 1980, ApJ, 241, 838
- Cardelli, Clayton, & Mathis (1989) Cardelli, J.A., Clayton, G.C., & Mathis, J.S. 1989, ApJ, 345, 245
- Carswell et al. (2001) Carswell, R.F., Webb, J.K., Cooke, A.J., & Irwin, M.J. 2001, VPFIT Program
- Davey et al. (2000) Davey, A.R., Storey, P.J., & Kisielius, R. 2000, A&AS, 142, 85
- Esteban et al. (1998) Esteban, C., Peimbert, M., Torres-Peimbert, S., & Escalante, V. 1998, MNRAS, 295, 401
- Esteban et al. (1999) Esteban, C., Peimbert, M., Torres-Peimbert, S., García-Rojas, J., & Rodríquez, M. 1999, ApJS, 120, 113
- Escalante & Victor (1990) Escalante, V. & Victor, G.A. 1990, ApJ, 75, 513
- Escalante (2002) Escalante, V. 2002, RevMexAA, 12, 22
- Ferland (1992) Ferland, G.J., 1992, ApJ, 389, L63
- Garnett & Dinerstein (2001a) Garnett, D.R. & Dinerstein, H.L. 2001, RevMexAA, 2000, 1
- Garnett & Dinerstein (2001b) Garnett, D.R. & Dinerstein, H.L. 2001, ApJ, 558, 145
- Grandi (1975a) Grandi, S.A. 1975, ApJ, 196, 465
- Grandi (1975b) Grandi, S.A. 1975, ApJ, 199, L43
- Grandi (1976) Grandi, S.A. 1976, ApJ, 206, 658
- Hamuy et al. (1994) Hamuy, M., Suntzeff, N.B., Heathcote, S.R., Walker, A.R., Gigoux, P., & Phillips, M. 1994, PASP, 106, 566
- Harrington et al. (1980) Harrington, J.P., Lutz, J.H., Seaton, M.J., & Strickland, D.J. 1980, MNRAS, 191, 13
- Henry, Kwitter, & Bates (2000) Henry, R.B.C, Kwitter, K.B., & Bates, J.A. 2000, ApJ, 531, 928
- Hirata & Horaguchi (1995) Hirata, R. & Horaguchi, T. 1995, Atomic Spectral Line List
- Hu et al. (2002) Hu, E.M., Cowie, L.L., McMahon, R.G., Capak, P., Iwamuro, F., Kneib, J.-P., Maihara, T., & Motohara, K. 2002, ApJ, 568, 75
- Hyung, Aller, & Feibelman (1994) Hyung, S., Aller, L.H., & Feibelman, W.A. 1994, PASP, 106, 745
- Kingdon & Ferland (1995) Kingdon, J.B. & Ferland, G.J. 1995, ApJ, 442, 714
- Kisielius et al. (1998) Kisielius, R., Storey, P.J., Davey, A.R., & Neale, L.T. 1998, A&AS, 133, 257
- Kisielius & Storey (2002) Kisielius, R. & Storey, P.J. 2002, A&A, 387, 1135
- Liu et al. (1995) Liu, X.-W., Storey P.J., Barlow, M.J., & Clegg, R.E.S. 1995, MNRAS, 272, 369
- Liu et al. (2000) Liu, X.-W., Storey, P.J., Barlow, M.J., Danziger, I.J., Cohen, M., & Bryce, M. 2000, MNRAS, 312, 58
- Mendez (1989) Mendez, R.H. 1989, in Planetary Nebulae: Proceedings of the 131st Symposium of the IAU, ed. S. Torres-Peimbert, (Boston: Dordrecht), 261
- Mendoza (1983) Mendoza, C. 1983, in Planetary Nebulae: Symposium No. 103, ed. D.R. Flower, (Boston: D. Reidel), 143
- Nussbaumer & Storey (1984) Nussbaumer, H. & Storey, P.J. 1984, A&ASupp, 56, 293
- Osterbrock (1989) Osterbrock, D.E. 1989, Astrophysics of Gaseous Nebulae & Active Galactic Nuclei, (Mill Valley: University Science Books)
- Osterbrock et al. (1996) Osterbrock, D.E., Fulbright, J.P., Martel, A.R., Keane, M.J., & Trager, S.C. 1996, PASP, 108, 277
- Osterbrock et al. (1997) Osterbrock, D.E., Fulbright, J.P., & Bida, T.A. 1997, PASP, 109, 614
- Pagel & Kazlauskas (1992) Pagel, B.E.J. & Kazlauskas, A. 1992, MNRAS, 256, 49
- Pagel et al. (1992) Pagel, B.E.J., Simonson, E.A., Terlevich, R.J., & Edmunds, M.G. 1992, MNRAS, 255, 325
- Peimbert (1967) Peimbert, M. 1967, ApJ, 150, 825
- Peimbert, Storey, & Torres-Peimbert (1993) Peimbert, M., Storey, P.J., & Torres-Peimbert, S. 1993, ApJ, 414, 626
- Peimbert, Peimbert, & Luridiana (2002) Peimbert, A., Peimbert, M., & Luridiana, V. 2002, ApJ, 565, 668
- Peimbert et al. (2004) Peimbert, M., Peimbert, A., Ruiz, M.T., & Esteban, C. 2004, ApJS, 150, 431
- Péquignot, Petitjean, & Boisson (1991) Péquignot, D., Petitjean, P., & Boisson, C. 1991, A&A, 251, 680
- Rhoads et al. (2003) Rhoads, J.E., Dey, A., Malhotra, S., Stern, D., Spinrad, H., Jannuzi, B.T., Dawson, S., Brown, M.J.I., & Landes, E. 2003, AJ, 125, 1006
- Sanders & Mirabel (1996) Sanders, D.B. & Mirabel, I.F. 1996, ARA&A, 34, 749
- Seaton (1968) Seaton, M.J. 1968, MNRAS, 139, 129
- Sharpee (2003) Sharpee, B. 2003, Ph.D. Thesis, Michigan State University.
- Sharpee et al. (2003) Sharpee, B., Williams, R., Baldwin, J.A., & van Hoof, P.A.M 2003, ApJS, 149, 157 (Paper I)
- Shaw & Dufour (1995) Shaw, R.A. & Dufour R.J. 1995, PASP, 107, 896
- Smits (1996) Smits, D.P. 1996, MNRAS, 278, 683
- Steigman (1975) Steigman, G. 1975, ApJ, 199, 642
- Storey (1994) Storey, P.J. 1994, A&A, 282, 999
- Tsamis et al. (2003) Tsamis, Y.G., Barlow, M.J., Liu, X.-W., Danziger, I.J., & Storey, P.J. 2003, MNRAS, 345, 186
- Tsamis et al. (2004) Tsamis, Y.G., Barlow, M.J., Liu, X.-W., Storey, P.J., & Danziger, I.J. 2004, MNRAS, in press (astro-ph/0404280)
- van Hoof (1999) van Hoof, P.A.M. 1999, Atomic Line List v2.04
- Viegas & Clegg (1994) Viegas, S.M. & Clegg, R.E.S. 1994, MNRAS, 271, 993
- Wilson (1953) Wilson, O.C. 1953, ApJ, 117, 264
- Zaritsky, Kennicutt, & Huchra (1994) Zaritsky, D., Kennicutt, R.C., Jr., & Huchra, J.P. 1994, ApJ, 420, 87