Cosmological simulations of the high-redshift radio universe
Abstract
Using self-consistent cosmological simulations of disc galaxy formation, we analyse the 1.4 GHz radio flux from high-redshift progenitors of present-day normal spirals within the context of present-day and planned next-generation observational facilities. We demonstrate that while current radio facilities such as the Very Large Array (VLA) are unlikely to trace these progenitors beyond redshifts , future facilities such as the Square Kilometer Array (SKA) will readily probe their characteristics to redshifts , and are likely to provide detections beyond . We also demonstrate that the progenitors of present-day cD galaxies can emit in excess of 10 of flux at redshifts , and may be a non-negligible contributor to the micro-Jansky source counts derived from current deep VLA cm-wave surveys.
keywords:
methods: -body simulations —galaxies: disc —galaxies: elliptical and lenticular, cD —galaxies: formation—galaxies: evolution —radio continuum: galaxies1 Introduction
Astronomy is on the brink of an instrumental revolution. The next generation of observational facilities will afford in most cases, in excess of 12 orders of magnitude improvement in sensitivity and/or resolution across the full electromagnetic spectrum - from the X-ray (X-Ray Evolving Universe Spectrometer), to the optical (Extremely Large Telescopes), to the infrared (James Webb Space Telescope), to the millimeter (Atacama Large Millimeter Array), and into the radio regime (Square Kilometer Array - SKA, hereafter). The SKA111http://www.skatelescope.org/ is expected to deliver sub-Jy sensitivity at 1.4 GHz - 50100 times that capable with the existing premier radio facility, the Very Large Array (VLA) which will be upgraded to the Expanded Very Large Array (E-VLA) and whose sensitivity will increase by factor five before the SKA will be built.
At 1.4 GHz, radio counts are dominated by active galactic nuclei (AGN) at fluxes a few mJy, while the fainter (10 Jy) counts are dominated by starburst galaxies (Windhorst et al., 1985, 1993; Hopkins et al., 2000). At the anticipated SKA sensitivity limit (0.1 Jy), little is known of the sources which may dominate the radio universe. Based on an empirical model, Hopkins et al. (2000) predict that normal disc galaxies near will dominate the sub-Jy counts. As the radio continuum flux is known to be roughly proportional to the star formation rate (SFR) for non-AGN systems (Condon, 1992), one might anticipate that the SKA would probe the progenitors to these normal disc galaxies directly, should this prediction be valid.
To test the above hypothesis, we have constructed cosmological simulations of disc galaxy formation which include a self-consistent treatment of temporal evolution of the radio flux. Our simulations were carried out using the galactic chemodynamics code GCD+ (Kawata & Gibson, 2003a, b). GCD+ is a three-dimensional tree -body/smoothed particle hydrodynamics (SPH) code which incorporates self-gravity, hydrodynamics, radiative cooling, star formation, supernovae (SNe) feedback, and metal enrichment. GCD+ takes account of the chemical enrichment by both Type II (SNe II) and Type Ia (SNe Ia) SNe, mass-loss from intermediate mass stars, and follows the chemical enrichment history of both the stellar and gas components of the system. The radio flux is calculated based upon an empirical law in which the radio flux is linked with the event rate of SNe II as described in Section 2.3 (Bressan, Silva & Granato, 2002; Silva, 1999).
The details of GCD+ relevant to the specific radio source count simulations described here are presented in Section 2. In Section 3.1, we show the expected flux from progenitors of simulated disc galaxies and compare the result with both the current observational data and the anticipated SKA sensitivity limit. Section 3.2 described what we consider to be plausible candidates for some fraction of the faint radio sources detected in current faint cm-wavelength radio surveys. Our results are discussed fully in Section 4.
2 Method
2.1 The Galactic Chemodynamical Evolution Code: GCD+
Our simulations were carried out using GCD+, our original galactic chemodynamical evolution code. Details of the code are presented in Kawata (1999) and Kawata & Gibson (2003a). The code is essentially based on TreeSPH (Hernquist & Katz, 1989; Katz, Weinberg & Hernquist, 1996), which combines the tree algorithm (Barnes & Hut, 1986) for the computation of the gravitational forces with the SPH (Lucy, 1977; Gingold & Monaghan, 1977) approach to numerical hydrodynamics. The dynamics of the dark matter and stars is calculated by the -body scheme, and the gas component is modeled using SPH. It is fully Lagrangian, three-dimensional, and highly adaptive in space and time owing to individual smoothing lengths and individual time steps. Moreover, it includes self-consistently almost all the important physical processes in galaxy formation, such as self-gravity, hydrodynamics, radiative cooling, star formation, SNe feedback and metal enrichment.
Radiative cooling which depends on the metallicity of the gas (derived with MAPPINGSIII: Sutherland & Dopita, 1993) is taken into account. The cooling rate for a gas with solar metallicity is larger than that for gas of primordial composition by more than an order of magnitude. Thus, the cooling by metals should not be ignored in numerical simulations of galaxy formation (Käellander & Hultman, 1998; Kay et al., 2000).
We stress that GCD+ takes account of energy feedback and metal enrichment by both SNe II and SNe Ia, and metal enrichment from intermediate mass stars (see Kawata & Gibson, 2003a, for details). The code calculates the event rates of SNe II and SNe Ia, and the yields of SNe II, SNe Ia and intermediate mass stars for each star particle at every time step, considering the Salpeter (1955) initial mass function (mass range of 0.160 ) and metallicity dependent stellar lifetimes (Kodama, 1997; Kodama & Arimoto, 1997). We assume that each massive star () explodes as a Type II supernova. The SNe Ia rates are calculated using the model proposed by Kobayashi, Tsujimoto & Nomoto (2000). The yields of SNe II, SNe Ia and intermediate mass stars are taken from Woosley & Weaver (1995), Iwamoto et al. (1999) and van den Hoek & Groenewegen (1997), respectively. The simulation follows the evolution of the abundances of several chemical elements (1H, 4He,12C, 14N, 16O, 20Ne, 24Mg, 28Si, 56Fe, and Z, where Z means the total metallicity). GCD+ makes it possible for us to follow the galaxy formation processes, taking into account both chemical and dynamical evolution effects self-consistently, and analyse the observational properties, such as optical and radio emission, from simulation results.
2.2 Cosmological Simulations
Using GCD+, we carried out a series of high-resolution simulations within an adopted standard -dominated cold dark matter (CDM) cosmology, =0.3, =0.7, =0.019, =0.7 and =0.9 222These cosmological parameters are close to the most favoured values after the Wilkinson Microwave Anisotropy Probe (Spergel et al., 2003). The differences are no larger than 15 %.. We used a multi-resolution technique in order to maximise the spatial resolution within the regions where the disc progenitors form and evolve. Tidal forces from neighbouring large-scale structure are included self-consistently (see also Kawata & Gibson, 2003b). The initial conditions for the simulations were constructed using GRAFIC2 (Bertschinger, 2001). All our simulations use isolated boundary conditions. Initially, we perform a low-resolution -body simulation of a comoving 20 Mpc diameter sphere which consists of 137376 particles with the mean separation of 20 /64 Mpc. The mass of each particle in our low-resolution simulation was , and a fixed softening of 9 kpc (in physical scale) was applied.
At redshift , we selected a 10 Mpc diameter spherical region which contains several galaxy-sized dark matter halos. We traced the particles which fall into the selected region back to the initial conditions at , and identify the volume which consists of those particles. Within this arbitrarily shaped volume, we replace the low-resolution particles with particles a factor of 64 times less massive. The initial density and velocities for the less massive particles are self-consistently calculated by GRAFIC2, taking into account the density fields of a lower-resolution region. Finally, we re-run the simulation of the entire volume (20 Mpc sphere), including gas dynamics, radiative cooling, and star formation. The gas component is included only within the high-resolution region. The surrounding low-resolution region contributes to the high-resolution region only through gravity. The mass and softening length of individual gas (dark matter) particles in the high-resolution region are () and 1.14 (2.15) kpc, respectively.
Using the friends-of-friends (FOF) technique, we next identified six stellar systems which consisted of more than 2000 star particles. Two of these systems possess disc-like morphologies and internal kinematics consistent with being supported primarily by rotation (and have 10000 star particles each). Table 1 summarises the basic properties of these disc galaxies which we refer to as galaxies D1 and D2 hereafter. In Table 1, the virial mass is defined as the mass within the virial radius , where the latter is defined to be the radius of the sphere containing a mean density of times the critical value, , following Eke, Navarro & Frenk (1998). The rotation velocity was measured directly from the rotation curves of the respective gas discs. Galaxy D1 has a similar rotation velocity to that of the Milky Way, with a -band luminosity approximately twice that of an L∗ late-type spiral ( mag: Kochanek et al., 2001). Because the stellar masses associated with our simulated galaxies are likely to be overestimated, due to the ubiquitous over-cooling problem (White & Frenk 1991), we consider galaxy D1 to be a fair representation of a typical disc galaxy. Galaxy D2 is approximately a factor of two more massive and luminous than D1. Admittedly, a sample of two is not ideal, but we emphasise that this is a pilot study for the longer-term goal of better characterising the capabilities of the next generation of radio facilities. Since progenitors of these two galaxies have similar radio fluxes despite their different formation histories, as shown below, it is re-assuring at least that our conclusions are independent of the specifics of the two high-resolution disc galaxies described here.
| Name | Number of Particles | ||||||
|---|---|---|---|---|---|---|---|
| () | (kpc) | (km s-1) | (mag) | Gas | dark matter | Star | |
| D1 | 305 | 220 | 23.9 | 3997 | 17408 | 11819 | |
| D2 | 408 | 230 | 24.3 | 12222 | 41792 | 27636 | |
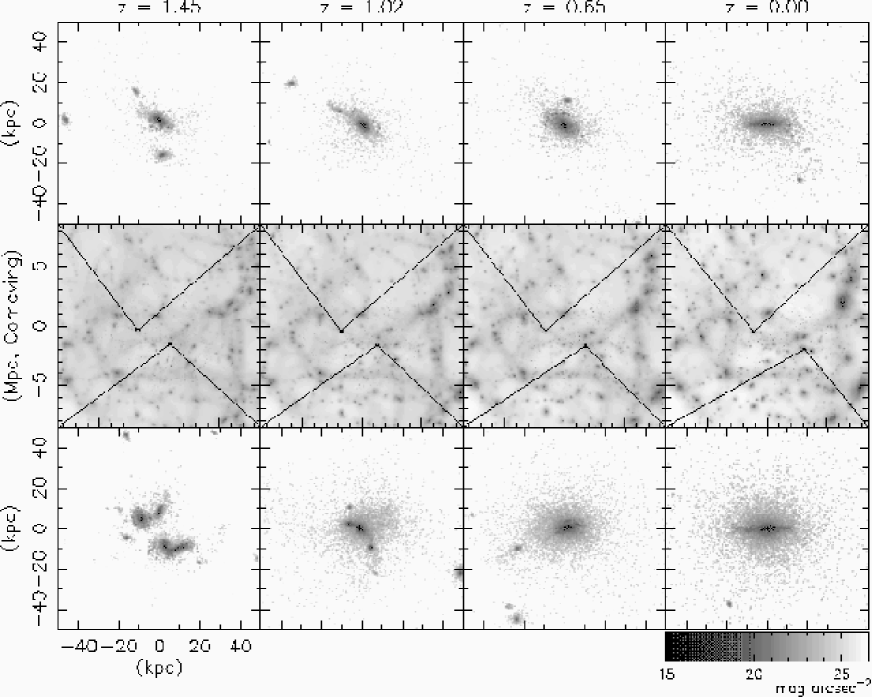
Fig. 1 shows the evolution of the dark matter distribution in a central portion of the simulation volume (middle row), and the evolution of the stellar component (-band) in a 100-kpc region centred on galaxies D1 and D2 (upper and lower rows, respectively). Here, the optical luminosities are derived by our population synthesis code adopting the simple stellar population of the public spectrum and chemical evolution code, KA97 (Kodama, 1997; Kodama & Arimoto, 1997), taking into account the age and metallicity of star particles (see also Kawata & Gibson, 2003b, and references therein). We have taken into account -corrections, but have neglected the influence of dust extinction. Both galaxies form through conventional hierarchical clustering by redshift =1; the disc component is built-up via smooth accretion of gas thereafter. By the present-day, both simulated galaxies have prominent stellar and gaseous discs.

2.3 Analysis: Radio Continuum
We assume here that a simulated galaxy’s radio continuum consists of both thermal () and non-thermal () emission components. We do not currently include a contribution from AGN. Following Bressan, Silva & Granato (2002), the non-thermal emission is assumed to follow a simple empirical formula related directly to the SNe II rate ,
| (1) | |||||
where is rest-frame frequency (in GHz). Since GCD+ takes into account stellar lifetime, is different from SFR. We assume that the thermal emission follows the simple scaling relation described by Silva (1999) (see also Condon & Yin, 1990),
| (2) |
While admittedly a simplistic assumption, these empirical laws do reproduce successfully the radio flux of observed present-day disc galaxies. Fig. 2 shows the predicted optical -band and 1.4 GHz fluxes for galaxies D1 (triangle) and D2 (square). The crosses correspond to the observational data for nearby galaxies from Bell (2003). As we do not yet have a self-consistent treatment of dust extinction within GCD+, we have de-reddened the observational data in Fig. 2 using the extinction tabulated by Bell (2003). We assume that the luminosity within an aperture of 50 kpc (in physical scale) radius encompasses the entire optical and radio-emitting regions. Fig. 2 shows that the predicted optical and radio luminosities for the simulated galaxies are consistent with those of observed galaxies. Encouraged by this, below we assume that this empirical law is also valid for high-redshift galaxies. In the next section, we discuss the temporal evolution of the predicted radio flux for the progenitors of our two simulated disc galaxies.

3 Results
3.1 Radio flux from disc progenitors
Fig. 3 shows the predicted 1.4 GHz flux (observer’s frame) from progenitors of galaxies D1 and D2 at different redshifts. Here, we measure the total flux within an aperture of 50 kpc (in physical scale) radius and take into account the -correction. At each redshift, we use the FOF to find the stellar systems identified as the progenitors of galaxies D1 and D2. Only progenitors which consist of more than 2000 star particles are displayed in Fig. 3. At , galaxy D2 has two progenitors, which by redshift have merged. Actually, even by visual inspection, galaxy D2 appears to have more than two progenitors still identifiable at , all of which could be resolved with the SKA arcsecond spatial resolution33310 kpc at redshift corresponds to 1.2 arcseconds in the adopted cosmology. (see also Colley et al., 1997). However, as our simple FOF classified them as one system, we simply define such system as a single object in the accompanying figure.
The aperture radius of 50 kpc has been chosen arbitrarily. This is roughly a radius which encompasses the entire stellar system identified as a single stellar system by our FOF at any redshift which we focus on. To see the aperture effect, we also measured the fulxes within and 10 kpc. At , the flux within kpc agrees with that within kpc within about 10 %, while the flux within kpc is systematically (about 15 % in the worst case) smaller than that within kpc, because the stellar systems are bigger than 10 kpc (see Fig. 1). At , since the central galaxy is relatively small, the contribution from the satellite galaxies are not negligible. Consequently, kpc leads to 50 % larger flux than kpc in the worst case. On the other hand, in the multiple merger like the progenitors of galaxy D2 at (Fig. 1), kpc sometimes leads to about 20 % of flux within kpc for the biggest galaxy. Note that the radio interferometer, such as the SKA, enables to resolve them, and they are likely detected as multiple sources, as mentioned above.
Our quoted SNe II rates are averages over the most recent 1 Gyr for any system at and 0.05 Gyr for the ones at . While a somewhat arbitrary “binning”, we confirm that our results are not sensitive to the specific bin-size adopted. Such a sampling suppresses the stochastic appearance of relatively rare short period (Myr) starbursts which are likely caused by resolution limits. Thus, the results of Fig. 3 represent a mean trend in the expected flux from progenitors of galaxies D1 and D2, as implicitly supported by the smooth nature of the curves in the accompanying figure.
The crosses in Fig. 3 correspond to the observed VLA dataset of Haarsma et al. (2000). The flux limit for this dataset is approximately 10 . Our simulations suggest that the VLA count source data corresponds to the (recent - ) progenitors of present-day disc galaxies. This is consistent with the conclusions drawn by optical follow up for the same sources by Roche, Lowenthal & Koo (2002). At higher-redshifts, these progenitors possess radio fluxes significantly below the feasible 1.4 GHz flux limit of the VLA. Their predicted flux reaches 1 at redshift , and decreases to 0.1 by redshift (with little evolution at redshifts ). We do not trace the progenitors beyond redshift , as the number of bound star particles become too few (2000) for the results to remain reliable. Galaxies D1 and D2 show very similar trends for the temporal evolution of the observed 1.4 GHz flux. Based upon our (admittedly limited) sample of two high-resolution simulated disc galaxies, we conclude that the trends shown by the curves in Fig. 3 are fairly representative of typical disc systems. Consequently, our results suggest that the SKA is capable of detecting the progenitors of normal disc galaxies at redshifts , provided it meets its design specifications of 0.1 (the expected 5 level achievable after a 12 hour integration, e.g. Hopkins et al., 2000) as shown by the thick dashed line in Fig. 3.
Fig. 4 shows the SFR of the progenitors of galaxies D1 and D2 at different redshifts. Here, the quoted SFR has been derived by averaging over the same aperture and temporal bin as that described previously. The crosses represent the inferred SFR of the VLA faint sources from Haarsma et al. (2000), who estimates the SFR using an empirical relation between SFR and radio continuum flux (Condon, 1992). Because of the adopted empirical link between radio flux and SNe II rate (eq. [1]), the latter of which also relates directly to the SFR, Figs. 3 and 4 provide somewhat complementary information. The reason why there are no observational data with low SFR at high redshift is the observational selection effect due to the limited sensitivity, which is the same as the effect which leads to the well-known envelopes of observational data in the absolute radio luminosity–redshift plane (e.g. Fig. 9 of Gilbert et al., 2004). Fig. 4 suggests that the progenitors of galaxies D1 and D2 have much smaller SFRs than the VLA faint sources at (which is simply another way of stating why they have much lower radio fluxes).
The dotted and solid histograms of Fig. 4 show the history of the total SFR for galaxies D1 and D2, respectively. Here, the total SFR means the summation of the SFR of star particles which fall into the region within a galactocentric radius of 50 kpc at redshift . For both galaxies, the total SFR is similar to the SFR of the most massive progenitor at redshift . However, at the SFR of the most massive progenitor is significantly lower than the total SFR. This difference indicates that a significant number of stars are forming in smaller progenitors which later accrete onto the most massive progenitor. An obvious conclusion from this cursory analysis is that in order to properly estimate the observed flux from high-redshift objects, it is (not surprisingly) important to take into account the hierarchical clustering history of the systems. Galaxy D2 is a clear example - at , we have noted previously the presence of two massive progenitors, and the fact that we are able to analyse the radio flux from each progenitor separately. This demonstrates that numerical simulations can be a powerful tool for studying the anticipated radio flux from individual galactic building blocks.

3.2 Radio flux from cD galaxy progenitors
In the previous section, we found that the VLA sources observed at are unlikely to be progenitors of normal disc galaxies. The obvious question then arises as to which population they belong. We suggest that one candidate might be the progenitors to bright central-dominant (cD) cluster galaxies. Using the same multi-resolution technique described in Section 2.2, we carried out a high-resolution simulation of a cluster of galaxies which was similarly identified first from a low-resolution cosmological simulation of a comoving 40 Mpc diameter sphere, and whose virial mass at redshift was M☉. The mass and softening length of individual gas (dark matter) particles in the high-resolution region were () and 2.27 (4.29) kpc, respectively.
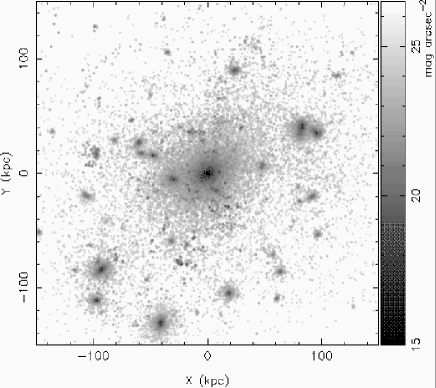
The -band image of the simulated cluster redshift is shown in Fig. 5. The basic properties of the cluster at this redshift are summarised in Table 2. The cluster has a massive central galaxy - a progenitor of what will become a present-day cD galaxy - and a number of associated member galaxies. The 1.4 GHz flux and SFR within the centre 50 kpc (in physical scale) of the cluster are denoted as open circles in Figs. 3 and 4. As seen in Fig. 5, the flux within this region is dominated by the flux from the progenitor of the cD galaxy itself. Figs. 3 and 4 demonstrate that this cD galaxy progenitor has a sufficiently high SFR, and consequently a sufficiently high 1.4 GHz flux, to reach the present-day VLA detection limit. Therefore, we suggest that the progenitors of present-day cD galaxies may be lurking within the faint VLA source counts. Fig. 4 shows that the SFR of this cD progenitor is 300 M☉ yr-1. Since SFRs of this magnitude are likely to be accompanied by associated dust, the intrinsic ultraviolet and optical light would suffer from consequent extinction, re-appearing as sub-millimeter emission. Thus, the VLA faint sources which are also detected by the Sub-millimeter Common User Bolometric Array (e.g. Chapman et al., 2003) may be counterparts of our simulated cD galaxy. This result is consistent with the previous studies (e.g. Governato et al., 1998; Nagamine, 2002; Nagamine et al., 2004) which demonstrate that high redshift starburst galaxies, such as Lyman break galaxies, likely evolve into large galaxies in clusters and groups at z=0.
| 444Velocity dispersion around kpc. | 555-band absolute magnitude in the rest frame. | Number of Particles | ||||
| () | (kpc) | (km s-1) | (mag) | Gas | dark matter | Star |
| 544 | 185 | 28.2 | 59365 | 140947 | 70793 | |
4 Discussion and Conclusions
Combining our cosmological simulations with an empirical law for radio continuum flux emission has enabled us to trace the temporal and spatial evolution of radio flux from star-forming disc and central dominant cluster galaxies. We have found that current radio telescopes, including the VLA, are capable of tracing the 1.4 GHz flux of the progenitors of today’s disc galaxies only locally (). Progenitors of normal disc galaxies have a 1.4 GHz flux 10 at , with their predicted flux reaching 0.1 at . Since the flux limit of the SKA at 1.4 GHz is expected to be 0.1 in 12 hours, it should be capable of detecting disc galaxy progenitors at redshifts . In addition, from a cluster simulation, we also found that progenitors of cD galaxies can possess a 1.4 GHz flux in excess of 10 at , and may be a candidate for some fraction of the faint VLA sources at .
It is worth reminding the reader that hierarchical clustering often leads to the presence of more than one significant progenitor (or building block) for any one disc galaxy at high redshift. Our simulated galaxy D2 provides a typical example of such a system. We predict that the radio flux from these individual building blocks will be observable by the SKA. At the sensitivity limit probed by the SKA, these building blocks of normal galaxies may dominate the radio source counts, as they do in the optical faint blue galaxy counts (Driver et al., 1998). Observations of such extremely faint radio continuum sources may therefore provide a unique window into the accretion history of galaxies. In addition, the SKA may be able to provide redshift information for the sources through HI line observations (e.g. Braun, 1996). Then, the SKA would be capable of providing the luminosity function of radio sources at different redshifts (e.g. Cowie et al., 2004), which would give strong constraints on disc galaxy formation scenarios. To interpret such observations, theoretical models are important (e.g. Takeuchi et al., 2001; Nagashima et al., 2002); our pilot study shows that self-consistent cosmological simulations will provide useful theoretical support for such analyses. Encouraged by our preliminary results, we are undertaking a series of larger volume simulations (anticipated completion in 2005), in order to improve the statistics associated with the program described here.
One note of caution is that the current numerical simulations suffer from the well-documented over-cooling problem (White & Frenk, 1991), which results in an unavoidably high SFR in the high-redshift building blocks, and a consequent underestimation of the SFR at later epochs. In tandem, this leads to disc systems which suffer from having overly massive stellar halos and bulges, at the expense of a prominent thin disc. Improved modeling of SNe feedback is believed to be crucial in overcoming this long-standing problem, and it has been suggested that stronger SNe feedback than that adopted here may lead to end-products which more closely resemble observed disc galaxies today (Thacker & Couchman, 2001; Sommer-Larsen, Götz & Portinari, 2003; Robertson et al., 2004; Brook et al., 2004). Having said that, even models which do incorporate strong feedback only result in SFR histories a factor of two different from the canonical models presented here (e.g. Fig. 2 of Brook et al., 2004). Hence, this particular problem unlikely impact our predicted radio flux by more than a factor of two. Nevertheless, more realistic numerical models of galaxy formation remain the constant target for our group (and others), and are a necessity for contributing to the design and anticipated performance of next-generation facilities such as the SKA.
Acknowledgements
We are grateful to Nobuo Arimoto and Tadayuki Kodama for kindly providing the tables of their SSPs data. We acknowledge the Yukawa Institute Computer Facility, the Astronomical Data Analysis Center of the National Astronomical Observatory, Japan (project ID: rmn12a), the Australian and Victorian Partnership for Advanced Computing, where the numerical computations for this paper were performed. BKG and DK acknowledge the financial support of the Australian Research Council. RAW was supported by NASA/JWST Grant NAG5-12460.
References
- Barnes & Hut (1986) Barnes J.E., Hut P., 1986, Nature, 324, 446
- Bell (2003) Bell E. 2003, ApJ, 586, 794
- Bertschinger (2001) Bertschinger E., 2002, ApJS, 137, 1
- Braun (1996) Braun R., 1996, in Raimond E., Genee R., eds, The Westerbork Observatory, Continuing Adventure in Radio Astronomy. Kluwer, Dordrecht, p. 167
- Bressan, Silva & Granato (2002) Bressan A., Silva L., Granato G.L., 2002, A&A, 392, 377
- Brook et al. (2004) Brook C.B., Kawata D., Gibson B.K., Flynn C., 2004, MNRAS, 349, 52
- Chapman et al. (2003) Chapman S.C., Blain A.W., Ivison R.J., Smail I.R., 2003, Nature, 433, 695
- Colley et al. (1997) Colley W.N., Gnedin O.Y., Ostriker J.P., Rhoads J.E., 1997, ApJ, 488, 579
- Condon (1992) Condon J.J., 1992, ARA&A, 30, 575
- Condon & Yin (1990) Condon J.J., Yin Q.F., 1990, ApJ, 357, 97
- Cowie et al. (2004) Cowie L.L., Barger A.J., Fomalont F.B., Capak P., 2004, ApJL, 603, 69
- Driver et al. (1998) Driver S.P., Fernandez-Soto A., Couch W.J., Odewahn S.C., Windhorst R.A., Phillips S., Lanzetta K., Yahil A., 1998, ApJL, 496, 93
- Eke, Navarro & Frenk (1998) Eke V.R., Navarro J.F., Frenk C.S., 1998, ApJ, 503, 569
- Governato et al. (1998) Governato F., Baugh C.M., Frenk C.S., Cole S., Lacey C.G., Quinn T., Stadel J., 1998, Nature, 392, 359
- Gilbert et al. (2004) Gilbert G.M., Riley J.M., Hardcastle M.J., Crston J.H., Pooley G.G., Alexander P., 2004, MNRAS, 351, 845
- Gingold & Monaghan (1977) Gingold R.A., Monaghan J.J., 1977, MNRAS, 181, 375
- Haarsma et al. (2000) Haarsma D.B., Partridge R.B., Windhorst R.A., Richards E.A., 2000, ApJ, 544, 641
- Hernquist & Katz (1989) Hernquist L., Katz N., 1989, ApJS, 70, 419
- Hopkins et al. (2000) Hopkins A., Windhorst R., Cram L., Ekers R., 2000, ExA, 10, 419
- Iwamoto et al. (1999) Iwamoto K., Brachwitz F., Nomoto K., Kishimoto N., Umeda H., Hix W.R., Thielemann F.-K., 1999, ApJS, 125, 439
- Katz, Weinberg & Hernquist (1996) Katz N., Weinberg D.H., Hernquist L., 1996, ApJS, 105, 19
- Kawata (1999) Kawata D., 1999, PASJ, 51, 931
- Kawata & Gibson (2003a) Kawata D., Gibson B.K., MNRAS, 2003a, 340, 908
- Kawata & Gibson (2003b) Kawata D., Gibson B.K., MNRAS, 2003b, 346, 135
- Käellander & Hultman (1998) Käellander D., Hultman J., 1998, A&A, 333, 399
- Kay et al. (2000) Kay S.T., Pearce F.R., Jenkins A., Frenk C.S.,
- Kobayashi, Tsujimoto & Nomoto (2000) Kobayashi C., Tsujimoto T., Nomoto K., 2000, ApJ, 539, 26
- Kochanek et al. (2001) Kochanek C.S., Pahre M.A., Falco E.E., Huchra J.P., Mader J., Jarrett T.H., Chester T., Cutri R., Schneider S.E., 2001, ApJ, 560, 566
- Kodama (1997) Kodama T., 1997, Ph.D. thesis, University of Tokyo
- Kodama & Arimoto (1997) Kodama T., Arimoto N., 1997, A&A, 320, 41
- Lucy (1977) Lucy L.B., 1977, AJ, 82, 1013
- Nagashima et al. (2002) Nagashima M., Yoshii Y., Totani T., Gouda N., 2002, ApJ, 578, 675
- Nagamine (2002) Nagamine K., 2002, ApJ, 564, 73
- Nagamine et al. (2004) Nagamine K., Cen R., Hernquist L., Ostriker J.P., Springel V., 2004, submitted to ApJ (astro-ph/0406032)
- Robertson et al. (2004) Robertson B., Yoshida N., Springel V., Hernquist L., 2004, ApJ, 606, 32
- Roche, Lowenthal & Koo (2002) Roche N.D., Lowenthal J.D., Koo D.C., 2002, MNRAS, 330, 307
- Salpeter (1955) Salpeter E.E., 1955, ApJ, 121, 161
- Silva (1999) Silva L., 1999, PhD Thesis, SISSA/ISAS, Trieste, Italy
- Sommer-Larsen, Götz & Portinari (2003) Sommer-Larsen J., Götz M., Portinari L., 2003, 596, 47
- Spergel et al. (2003) Spergel D.N., Verde L., Peiris H.V., Komatsu E., Nolta M.R. et al., 2003, ApJS, 148.175
- Sutherland & Dopita (1993) Sutherland R.S., Dopita M.A., 1993, ApJS, 88, 253
- Takeuchi et al. (2001) Takeuchi T.T., Kawabe R., Kohno K., Nakanishi K., Ishii T.K., Hirashita H., Yoshikawa K., 2001, PASP, 113, 586
- Thacker & Couchman (2001) Thacker R.J., Couchman H.M.P., ApJL, 555, 17
- van den Hoek & Groenewegen (1997) van den Hoek L.B., Groenewegen M.A.T., 1997, A&AS, 123, 305
- White & Frenk (1991) White S.D.M., Frenk C.S., 1991, ApJ, 379, 52
- Windhorst et al. (1993) Windhorst R.A., Fomalont E.B., Partridge B.R., Lowenthal J.D., 1993, ApJ, 405, 498
- Windhorst et al. (1985) Windhorst R.A., Miley G.K., Owen F.N., Kron R.G., Koo D.C., 1985, ApJ, 289, 494
- Woosley & Weaver (1995) Woosley S.E., Weaver T.A., 1995, ApJS, 101, 181