2 Postdoctoral Fellow of the Japan Society for the Promotion of Science
Super-Eddington accretion rates in Narrow Line Seyfert 1 galaxies
We use the BH masses deduced from the empirical relation of Kaspi et al. (2000) between the size of the Broad Line Region (BLR) of Active Galactic Nuclei (AGN) and the optical luminosity, to compute their accretion rate in four samples of AGN, assuming that the optical luminosity is provided by the accretion disc. We show that Narrow Line Seyfert Galaxies 1 (NLS1s) accrete at super-Eddington rates, while their luminosity stays of the order of the Eddington limit. We take into account the possibility of a non-viscous energy release inversely proportional to the square of the distance in the gravitationally unstable region of the disc emitting a fraction of the optical luminosity. It leads to a smaller accretion rate and to a redder continuum than a standard disc, which agrees better with the observations. The observed bolometric luminosities appear to saturate at a few times the Eddington luminosity for super-Eddington accretion rates, as predicted by slim disc models. They favor a Kerr BH rather than a Schwarzshild one. Even when the accretion rate is super-Eddington, it stays always of the order of a few M⊙/yr, irrespective of the BH mass, indicating that the growing of the BH is mass supply limited and therefore regulated by an exterior mechanism, and not Eddington limited. The mass of the BH increases by one order of magnitude in a few 107 years, a time smaller than that necessary for changing the bulge mass. This is in agreement with recent claims that the BHs of NLS1s do not follow the same black hole - bulge relation as other galaxies. Since they represent about 10 of AGN up to a redshift of 0.5, these “super-active” phases should play an important role in shaping the mass function of local BHs. We finally discuss the possibility that the masses could be systematically underestimated due to an inclination effect, and we conclude that it could indeed be the case, and that the accretion rates could thus be strongly overestimated in a small proportion of objects, possibly explaining the existence of apparently extremely high accretors.
Key Words.:
Quasars: general - Accretion, accretion discs - galaxies: active - galaxies: Seyfert1 Introduction and rationale
The evolution of massive black holes (BHs) in relation with their host galaxy is presently intensively debated. Massive black holes seem present in all galactic nuclei, independently of their level of activity. In about 40 inactive nearby galaxies, their mass was found proportional to the luminosity of the bulge of the host galaxy (Magorrian et al. 1988). Ferrarese & Merritt (2000) and Gebhardt et al. (2000a) showed that a tighter relation exists between the mass of the BH, , and the dispersion velocity of the bulge. The slope of the relation is still debated, and the recent work of Tremaine et al. (2003) gives a value close to 4. Several mechanisms accounting for this relation have been proposed (Silk & Rees 1998, Umemura 2001, King 2003). When is expressed in terms of the bulge mass, it leads to . It is thus clear that the growth of the BH and the evolution of the host galaxy are related, so it is generally assumed that their co-evolution is mainly the result of merger events within the hierarchical scenario of large structure formation (Haehnelt, Natarajan & Rees 1998, Kaufman & Heahnelt 2000, Menou, Haiman & Narayaman 2001, Hatziminaoglou et al. 2003).
However this scenario begins to be questioned seriously. It is indeed difficult to explain how smaller BHs grow at lower redshifts and more massive ones at higher redshift. So Marconi et al. (2004) propose that local BHs grow mainly during Active Galactic Nuclei (AGN) phases. This raises immediately the question whether BHs in local AGN and in quasars follow the same BH/bulge relationship as other galaxies.
The BH masses in AGN are not determined like in inactive galaxies by the study of the stellar rotation curve close to the center. In about 40 AGN, they are determined directly through reverberation mapping (Wandel et al. 1999, Kaspi et al. 2000), which yields an empirical relation between the luminosity and the size of the Broad Emission Line Region (BLR), and then to the BH mass, using the Full Width at Half Maximum (FWHM) of the broad lines as a surrogate of their dispersion velocity and assuming that the BLR is gravitationally bound to the BH, an assumption confirmed by detailed studies (Peterson & Wandel 1999 and 2000). In the other AGN the BH masses are determined indirectly assuming that the same relations hold. Wandel (1999) showed that Seyfert galaxies have lower BH to bulge mass ratios than inactive galaxies, but the revision of the Magorrian relation leads to conclude finally that it is not the case (Laor 2001, Wandel 2002, Gebhardt et al. 2000b).
However the status of Narrow Line Seyfert 1 galaxies (NLS1s) is not well established in this context. NLS1s constitute about 10 of Seyfert nuclei and quasars up to a redshift of 0.5 (Williams, Pogge, & Mathur 2002). Though they are known since a long time (Osterbrock & Pogge 1985), their nature is still not well understood. Besides the “narrowness” of their broad lines, these galaxies share common properties, such as strong FeII permitted lines and weak forbidden [OIII] lines, a strong X-ray variability and a big soft X-ray hump (see several reviews in Boller et al. 2000). Mathur, Kuraszkiewicz & Czerny (2001) suggested that the BH/bulge mass ratio is smaller in NLS1s, and Wandel (2002) found that to , a smaller value than for broad line AGN (BLS1s). Both papers are based on a very limited sample, and are prone to statistical uncertainties. Moreover, in NLS1s the bulge mass is generally not deduced from the stellar dispersion velocity but from the width of the [OIII]5009 line assumed to be proportional to it, following a suggestion of Nelson and Whittle (1996) for Seyfert 1 galaxies (actually Wandel (2002) used direct measurements of the bulge luminosity). Wang and Lu (2001) argued that the [OIII] width is not accurately determined in NLS1s, owing to the weakness of the line and to the presence of a blue wing, both effects leading to overestimate ([OIII]) and therefore the bulge mass. However Grupe & Mathur (2003) confirmed the previous result of Mathur et al. (2001) with a complete X-ray selected sample of NLS1s, even when taking into account the presence of the blue wing of the [OIII] line, and she claims that NLS1s occupy distinct regions in the BH/bulge mass relation. Botte et al. (2004) do not confirm this result, and from a study of the photometric properties of the host galaxies they find that the NLS1 galaxies seem to share the same BH/bulge mass relation as ordinary Seyfert, and simply occupy the lower ranges of the plane. Bian and Zhao (2003) came to an opposite conclusion, based also on the bulge luminosity (we recall that the relation deduced from the bulge luminosity and the host properties is more dispersed than that deduced from the dispersion velocity), but found that NLS1s do not follow the ordinary relation when using the [OIII] line as an indicator of the dispersion velocity (Bian & Zhao 2004). Finally Botte et al. (2004) show that there is a smooth relation between the BH mass vs. the bulge luminosity for different classes of AGN, while there is a jump between the BH mass v.s. the [O III] width. The latter finding is consistent with what was claimed by Grupe & Mathur (03) and by Bian & Zhao (04).
One sees that the problem of the BH/bulge mass relation in NLS1s is presently highly controversial. It has important cosmological consequences. If BHs in NLS1s are undermassive with respect to their host bulge, it would imply that these galaxies are “young”, in the sense that they are still in the process of building their BH. It would mean that BHs and galaxies do not evolve concomitantly (Mathur 2000, and Grupe & Mathur 2003). We will show here that there is a strong reason to believe this is true, because NLS1s seem to be accreting at super-Eddington rates and therefore the time scale for the growing of their central black holes could be extremely short.
It is now widely admitted that NLS1s are radiating close to the Eddington luminosity . This result is simply obtained from the mass-luminosity-FWHM relations mentioned above. A few objects might even have super-Eddington bolometric luminosity, depending on the conversion factor used to transform the optical-UV luminosity into a bolometric one, and on the adopted Hubble constant, but it never exceeds a few . From this result many people assuming that the efficiency factor for conversion of mass into energy is constant and of the order of 0.1 deduce that these objects are also accreting close to their Eddington limit.
But why would it have to be so? Super-Eddington accretion is indeed theoretically allowed. Near the BH, the gas forms an accretion disc, which is supposed to emit the “Big Blue Bump” (BBB). The accretion rate and the BH mass determine the spectral distribution and the flux of the BBB. It is thus possible to determine the accretion rate when the mass is known. It was performed by Collin et al. (2002, hereafter referred as C02), using the sample of Kaspi et al. (2000) for which the BH masses are deduced from reverberation mapping, and assuming that the optical luminosity is provided by a standard accretion disc (once the luminosity of the underlying galaxy has been subtracted). They found that a fraction of objects is accreting at super-Eddington rates, while their optical luminosity stays lower than or of the order of the Eddington luminosity. Actually, when the accretion rate is close to, or larger than the Eddington limit, accretion close to the BH does not proceed through a “thin”, but a “slim” disc whose cooling time is larger than the viscous time, so energy is advected towards the BH before being radiated. The mass-energy conversion efficiency thus decreases as the accretion rate increases, and the luminosity increases only logarithmically with the accretion rate (Abramowicz et al. 1988, Wang et al. 1999, Fukue 2000, Mineshige et al. 2000, Wang & Netzer 2003, Kawaguchi 2003). The emission of such a disc is characterized by a soft X-ray bump as those observed in NLS1s. Kawaguchi (2003), and Kawaguchi, Pierens & Huré (2004, hereafter called KPH) have confirmed that the overall Spectral Energy Distribution (SED) of the two most super-Eddington accretors are well fitted by the emission of a slim disc. Finally, Wang (2003) noted that super-Eddington accretion should lead to a limit relation between the BH mass and the FWHM of the lines, and he found several objects satisfying this relation, indicating that they radiate close to their Eddington luminosity, but accrete above the Eddington limit.
There were only a few NLS1s in the Kaspi et al. sample studied in C02. Moreover the sample is not statistically complete since half of the objects are nearby Seyfert nuclei chosen mainly for their high degree of variability. The recent release of several complete samples including a large number of NLS1s, and the renewed interest for these objects since a few years, motivated us to conduct the same study on these new samples. While only standard discs were assumed in C02, here we take into account the deviation from the standard disc due to the disc self-gravity, which is particularly important in super-Eddington objects (cf. KPH). We use also the slim disc model to compute the bolometric luminosity as a function of the accretion rate. We finally discuss some observational consequences not envisioned in C02. The model can account for the fact that the optical-UV continuum of NLS1s is redder than that of ordinary Seyferts (Constantin & Shields 2003). The variation of the bolometric luminosity with the accretion rate agrees with the slim disc model. It explains why the FWHMs of the broad lines are larger than 700km/s.
In this paper, we only want to show some general trends and draw qualitative conclusions concerning the accretion rates of NLS1s, using rough theoretical models of accretion discs and applying them to entire samples.
Finally we insist on the fact that all along this paper we accept the commonly admitted statement that the narrowness of the lines of NLS1s is not due to an inclination effect, i.e. that NLS1s do not constitute a sample of normal Seyfert 1 nuclei whose broad line region is a rotating disc seen almost face-on. In this case, it is clear that the masses derived from the reverberation mapping formulae would be strongly underestimated, and consequently their luminosity (in terms of Eddington luminosity) overestimated.
In the following section, we recall first how BH masses are determined and we present the samples. We discuss the explanation of the empirical relation between the luminosity and the size of the BLR. In Section 3, we summarize the theoretical model. Section 4 is devoted to a discussion of the results, and in the last section we discuss the alternate possibility that the masses of NLS1s could be underestimated and the accretion rates overestimated.
2 Determination of the BH masses
2.1 The empirical mass-luminosity relation
Reverberation mapping studies allowed to determine the size of the BLR in about 40 objects. It lead to the discovery of a correlation between the radius of the region emitting the H line, which we will call , and the monochromatic luminosity at 5100Å, (Kaspi et al. 2000):
| (1) |
where is expressed in 1044 erg/s. Though there is some uncertainty in the functional form of the relation (cf. Laor 2003, Netzer 2003), all recent papers adopt this relation to compute in quasars and Seyfert galaxies, when it has not been determined by reverberation mapping.
It is now well demonstrated that the broad H emitting region is gravitationally bound to the BH (Peterson & Wandel 2000). This gives another relation, , where is the gravitational constant. is generally taken equal to , corresponding to BLR clouds in random orbital motion. The relation becomes, using Eq. 1:
| (2) |
where is the FWHM of the H line expressed in 2000 km/s (we choose this value since NLS1s are defined by FWHM km/s). Using Eqs. 1 and 2, one gets a relation between and which allows to determine as a function of the optical luminosity and the FWHM, without the need to know the size of the BLR. We stress however that the use of the FWHM as a surrogate of the dispersion velocity can lead to a systematic underestimation of the mass, if the BLR is a relatively flattened structure dominated by rotation, in which case the inclination of the system would play an important role (see Section 5).
These relations have important consequences. If one assumes that , a canonical value for the quasar continuum (cf. Elvis 1994, Laor et al. 1997), one gets from Eqs. 1 and 2:
where we call the Eddington ratio, i.e. the ratio of the bolometric upon the Eddington luminosity , and the BH mass expressed in 107 M⊙. It is obvious from this relation that NLS1s have larger Eddington ratios than BLS1s for a given BH mass.
2.2 Comments on the luminosity-size relation
There are several possible explanations for this relation. Line emission can be suppressed by dust beyond the radius of sublimation, which corresponds to a given heating flux (Netzer & Laor 1993). But this constraint provides only an outer boundary of the BLR. Nicastro (2000) proposed that clouds are formed in a wind above the disc, close to the transition region between the gas and the radiation pressure dominated zones of the disc. However the size of the BLR depends both on the BH mass and on the luminosity, while the observations give only a luminosity dependence. The striking similarity of AGN spectra led also to the idea that the “ionization parameter” (i.e. the radiation pressure to gas pressure ratio or the photon density to gas density ratio, , being the electron number density) is constant among all objects. Actually the size-luminosity relation rather implies that the product of the density with the ionization parameter is constant. This is consistent with the so-called “LOC” model.
In 1995, Baldwin et al. proposed that the observed spectrum of AGN is simply a consequence of the ability of a photoionized medium to reprocess the underlying continuum “as long as there are enough clouds at the correct radius and with the correct gas density to efficiently form a given line”. In this “Locally Optimally Emitting Clouds” (or LOC) model, each line is emitted preferentially at an appropriate ionizing flux corresponding to a given distance from the source 111 This is actually closely related with the old idea of line saturation due to thermal quenching (Ferland & Rees 1988, Collin-Souffrin & Dumont 1989). According to the grid of photoionized models published by Korista et al. (1997) the “optimal” ionizing flux for the the H line does almost not depend on the density and on the spectral distribution of the ionizing continuum. It is of the order of erg s-1 cm-2. This means that as long as there are clouds in a large range of radius with the appropriate density (i.e. between 109 and 1014 cm-3) the ionizing continuum will be reprocessed in the H line with a maximum efficiency at an optimal distance cm, where is the ionizing luminosity. From the Gru03 sample, one gets L(5100) (precisely L(5100) and L(5100)1.13, with a correlation factor of 0.9). Thus the observed relation transforms into cm, which is similar to the relation expected for the LOC model (the ionizing luminosity being slightly smaller than the bolometric luminosity).
So the only necessary condition for the observed relationship is the existence of clouds within a broad range of density at a radius smaller than the typical distance of the BLR, say 10. Collin & Huré (2001) suggested that such clouds form above the gravitationally unstable region of the disc. Since the disc becomes gravitationally unstable at small radii compared with the size of the BLR (cf. later), this condition is satisfied. The BLR clouds would thus constitute simply the outer part of the region emitting the optical continuum. Laor (2003) objected to this idea that “since all accretion discs must become gravitationally unstable far enough from the center, this mechanism does not provide a natural explanation for the apparent absence of a BLR in some Agn”. But there are actually several possible explanations for the absence of BLR. For instance, in low luminosity objects, it can be due to the suppression of the ionizing radiation in an Advection Dominated Accretion Flow (ADAF). It can also simply be caused by the absence of adequate physical conditions in the gravitationally unstable disc, like a too high or to small density.
2.3 The samples
We use two complete samples including both NLS1s and BLS1s.
The recent data release of the Sloan Digital Sky Survey (SDSS) allowed Boroson to build an homogeneous sample of 107 low-redshift radio-quiet QSOs and Seyfert 1 galaxies (Boroson 2003). It is aimed at comparing the BH masses determined from the empirical relations with those deduced from the dispersion velocity of the [OIII] line, used as a surrogate of the stellar velocity dispersion. About one third of objects are NLS1s in this sample. It allows to study a large range of masses and luminosities. For each object the redshift, the FWHM(H) and the BH mass are given, and we deduce the optical luminosity at emission from Eqs. 1 and 2. We call this sample Bor03.
The second one is a complete sample of X-ray selected AGN (Grupe et al. 2003). According to the selection procedure, about half of the objects are NLS1s. L(5100) is given, but for an empty universe, so we made the conversion to . We call this sample Gru03. It is particularly interesting for us as it gives an estimate of the bolometric luminosity of the objects based on the observed spectral energy distributions, which we will be able to compare with our models.
We use also two other heterogeneous samples. Wang & Lu (2001) deduced L(5100) from the B-magnitude using the Véron-Cetty et al. (2001) sample, which contains 59 NLS1s, and they estimated the BH masses using the previous empirical relations. After rejection of a few objects for which the FWHM are controversial, the sample was reduced to 54 NLS1s. We call it the VVG sample. We also used an heterogeneous sample of soft X-ray selected AGN (Grupe et al. 1998, 1999), which has the advantage of giving optical indices useful to check our models. We also made the conversion from to . We call it Gru99. Note that a few objects are also in Gru03.
The samples have not been corrected for the stellar contribution of the host galaxy to the optical luminosity. It is certainly important for low luminosity AGN, but not when the optical luminosity is larger than a few 1043 ergs/sec. In the following we will distinguish or suppress all these weak objects from the samples, so we can be fairly confident that the results will not be contaminated by the host galaxy.
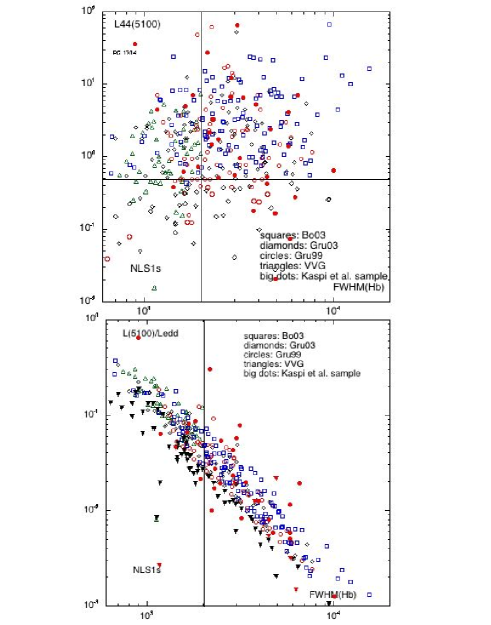
Fig. 1 displays respectively L(5100) (top) and L(5100)/ (bottom) versus the FWHM for all samples. We note immediately the strong difference between these two graphs. While the first one shows a very loose correlation, corresponding to the absence of low luminosity objects with large FWHMs and of high luminosity objects with small FWHMs, the second one shows a tight correlation with a slope equal to -2, which is expected according to the first line of Eq. 3. The black triangles indicate the objects with L(5100) ergs/sec: note that these low luminosity objects share the same relation as the others.
In an aim of comparison, we have added on these figures the objects where the BH masses have been determined directly by reverberation mapping (we call these objects the “Kaspi et al. sample”, though half of them were not observed by Kaspi et al. 2000). They span the same range of luminosities as the other samples. But first, they show a looser correlation between L(5100)/ and the FWHMs; it is expected as the determination of the mass in the other objects makes use of an exact relation (BLR), not taking into account its error bars. And second, the relation should be extrapolated to values of the mass and of the Eddington ratio smaller by a factor of 5. It should be kept in mind in the following analysis. Note that the values of the luminosities used in this figure correspond to km/sec/Mpc, while CO2 assumed km/sec/Mpc.
3 The accretion disc model
Since more than fifteen years it is widely admitted that the “infrared bump” at a few microns and the “Big Blue Bump” observed in radio quiet quasars and Seyfert nuclei are both due to thermal emission, respectively by hot dust heated by the UV-X continuum, and by the accretion disc (Sanders et al. 1989). In this picture, the observed “dip” at 5000Å in the log versus log curve corresponds to the junction between these two processes, the hot dust close to the sublimation temperature (1700K) being unable to radiate appreciably below 1m. In particular the idea of an underlying non-thermal power law continuum which was invoked in the past and used to model the infrared to UV emission of AGN has been completely left over. So the emission at 5000Å should be due entirely to the accretion disc, unless another medium can give rise to a smooth featureless optical continuum. The problem was discussed in C02, and they showed that it would require the existence of a very dense, optically thick and relatively cold medium. It is difficult to find for such a medium another location than an optically thick accretion disc.
For a “standard” thin Keplerian disc where gravitational energy is released locally through turbulent viscosity, the effective temperature at a distance from a BH of mass is:
| (4) |
where the non-dimensional factor takes into account the boundary conditions, and is equal to unity at large radii (cf. for instance the book of Frank, King & Raine 2002).
Each spectral band is emitted around a given radius, and the optical band corresponds to a large distance from the black hole, typically 10 ( being the gravitational radius ). At such large radii, the disc is dense, relatively cold and optically thick, and its local emission spectrum is close to a black body at the temperature (cf. Collin 2001; note that it is not the case at smaller radii, i.e. in the EUV band). Integrating over the disc the Planck law with , one finds for the luminosity at a frequency :
| (5) |
where (respt. ) is the inner (respt. the outer) radius of the accretion disc.
So it is possible, using Eqs. 4 and 5, to deduce the accretion rate when the mass is known. One sees also from these equations that L(5100) is approximately proportional to . This is not valid for very large masses and small accretion rates, where ) is of the order of , or for truncated discs.
For super-Eddington accretion rate this picture is changed. The radiative efficiency per unit mass accretion is expected to decrease due to the onset of photon trapping (Begelman 1978). As a result, the emergent luminosity from an accretion flow starts to saturate at a few times (Abramowicz 1988). Self-similar solutions with super-Eddington accretion rates (Fukue 2000; Wang & Netzer 2003) are only valid inside the photon trapping radius, where soft X-ray photons are emitted. However, full integration of differential equations from far outside the photon trapping radius to the vicinity of the central BH (Shimura & Manmoto 2003; Kawaguchi 2003) is necessary in order to discuss the broad-band spectra of NLS1s. We use the slim disc model for a Schwarzshild BH computed as in Kawaguchi (2003), which is based on the code developed by Matsumoto et al. (1984). The effect of electron scattering (both in opacity and Comptonization) and relativistic correction are included. We take the viscosity parameter equal to 0.1. Note that the slim disc is used here only to compute the bolometric luminosity.
Even if the accretion rate is very high (in Eddington value) the optical luminosity is still emitted at a large radius where the accretion flow is not influenced by advection and photon trapping, except in the case of very high accretion rates (, cf. KPH), and the standard disc model is valid. The only deviation to the local blackbody in the optical region is due to electron scattering (as modified blackbody, see Czerny & Elvis 1987), which distorts the spectrum for super-Eddington accretion rates. It is negligible as far as viscosity is small () and the BH mass is small (M⊙), so the distortion is not very important for NLS1s (cf. KPH), and we will neglect it in this paper.
However an important fact should not be forgotten, which acts also for modest accretion rates but is very important for super-Eddington accretion rates.
At about the distance of the optical emitting region, the disc becomes self-gravitating, i.e. the vertical component of the BH gravity becomes smaller than the disc’s own gravity. This occurs beyond a critical radius corresponding to a density:
| (6) |
where is the keplerian velocity. The disc is then locally gravitationally unstable (Goldreich & Lynden-Bell 1965). At radii larger than , the structure of the disc is completely unknown. It could break into fragments, which can collapse and even form stars, or it can stay at the marginal instability limit if it can be sustained by some extra heating mechanism. In all cases the region emitting the 5100 Å flux stays optically thick, and the local black body assumption is valid (cf. Collin & Huré 1999).
Koratkar & Blaes (1999) stressed that the standard disc model leads to a continuum bluer than the average AGN continuum, which has a mean spectral index of 0.3 to 0.5 (we define the spectral as ). Actually it is a problem only for small BH masses and large accretion rates. In the case of large BH masses and small accretion rates, the optical spectrum-UV spectrum is emitted by the Wien part of the Planck function, and is redder than .
Several sources of heating can overcome the gravitational viscous release beyond the self-gravitational radius. The disc can be irradiated by the central source of UV-X continuum if it is “flaring” (i.e. if its thickness varies more rapidly than the radius). It can be heated by gravitational instabilities (Lodato & Bertin 2003), by the collisions of clumps (Krolik & Begelman 1988), or by embedded stars (Collin & Zahn 1999), and cer. In all cases, will decrease less rapidly with increasing than in a “standard” disc, and the observed continuum will be redder. For instance Soria & Puchnarewicz (2002) fit the spectrum of the NLS1 1 RE J1034+396 (this object is included in the following computations) by an irradiated accretion disc whose scale height to the radius ratio increases rapidly with , being thus proportional to . C02 have shown that in this case, in order to get a smooth optical continuum without an intense Balmer discontinuity, the density and the optical thickness of the irradiated medium should be very large. This is impossible with a strongly flaring disc; a warped thin disc would be a more appropriate solution. As we explained previously, such a disc would be gravitationally unstable at the distance of the region emitting the optical luminosity, and most likely very different from a standard one. In the case of heating by embedded stars, a very large number of massive stars would be necessary to account for the whole optical luminosity (Collin & Zahn 1999).
Since the status of the unstable part of the disc is not known, we parametrize these effects by assuming that the energy release is proportional to , with smaller than 3 in the self-gravitating region. In this paper we will assume the extreme case : it corresponds to , with . In the following computations this value is used into Eq. 5 instead of Eq. 4 for , with the continuity of the energy release at . Doing this we obtain an optical spectral index between -0.3 (corresponding to the standard disc) and +0.5, depending on the proportion of the disc which is self-gravitating. It is closer to the observed AGN continuum. The effect on the bolometric luminosity of this additional energy release is negligible, but it increases the computed emission in the optical and near-infrared spectral bands, and therefore decreases the accretion rate necessary to account for a given optical luminosity. is small for small values of . We have thus chosen a relatively small value of the viscosity parameter (0.01) in order to underestimate , and therefore to underestimate also the accretion rate with respect to a standard disc.
However, we have to take into account the fact that the accretion disc cannot extend too much in the self-gravitating region, unless a mechanism can act to limit the disc density at exactly the marginal instability. Since we will see below that the self-gravitation radius is always smaller than 10, we have decided in the following to limit the radius of the accretion disc at a value of 10. It is an arbitrary value, but we have no way to estimate the real extension of the accretion disc. Note that the dimension of the BLR is at most of this order in NLS1s, and it is difficult to accept the idea that the disc extends much further out. Note that for such a radius, the gravity of the galaxy does not dominate on the BH.
If the disk is not self-gravitating and extends further out, it does not influence the optical emission. Indeed in this case one finds that m, which insures that the optical emission is entirely produced inside . On the contrary, if the disk extends only up to or , the computed optical emission would be smaller than for , and the accretion rate would therefore be larger.
As an accretion disc with a super-Eddington accretion rate behaves like a standard disc outside the photon trapping radius (KPH), we compute with the same analytical approximation as KPH, which gives expressions similar to the previous detailed computations of Huré (1998):
| (7) |
where , , and are the self-gravitation radius in respectively the inner region dominated by radiation pressure and Thomson opacity, the intermediate region, dominated by gas pressure and Thomson opacity, the outer region dominated by gas pressure and atomic opacity:
| (8) | |||
These expressions depend on the viscosity parameter . We will use , , and . A smaller value of has a more profound influence on the disc structure, as it corresponds to a denser standard disc, and therefore a smaller value of .
Let us now discuss the consequences of these relations in an approximate way. As we shall see later, none of the free parameters have a strong influence on the computed accretion rate, the main quantity that we want to determine. We have seen that for a standard disc, L(5100). Using this relation, and Eqs. 1 and 2, we get:
| (9) |
where is the accretion rate expressed in Eddington units, . This is actually a very interesting result, which comes from the dependence of the size of the BLR on the luminosity and which shows that depends almost only on the FWHMs, and very little on the BH mass. It is only approximate if the self-gravitating region of the disc is large. It means that can be deduced directly from the measurement of the FWHMs alone.
4 Results and discussion
We have applied our model to the samples, and we present now the results. We use H km/sec/Mpc, and . When the luminosities were given for another cosmological constant, we have made the conversion in the aim of uniformity.
We first draw the attention on a fact which is sometimes forgotten. Generally it is not the fluxes at Earth but the luminosities which are published in the literature, and they are computed assuming an isotropic emission. The monochromatic luminosity is thus equal to:
| (10) |
where is the flux observed at Earth, (respt.) is the frequency at emission (respt. at Earth), is the proper distance of the object, is the redshift, the external (galactic) absorption. But an accretion disc does not emit isotropically. The computed monochromatic luminosity given by Eq. 5 or by its equivalent for the self-gravitating region should thus be multiplied by a factor 2cos(), where the inclination of the disc axis on the line of sight, to be identified with the published values.
4.1 Accretion rates
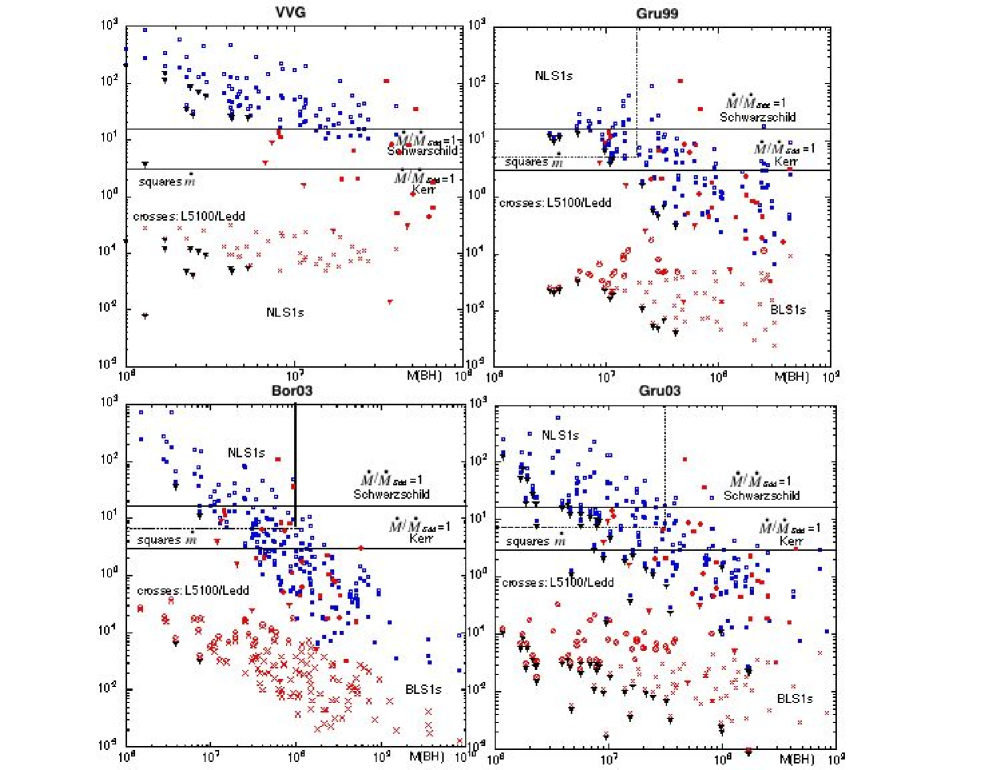
Figs. 2 display as a function of the BH mass for the four samples. is computed according both to the standard disc model, and to the self-gravitating disc model as explained in the previous section. In this latter case, the results are shown for a viscosity parameter . In all computations, cos() is set equal to 0.75. The objects with L(5100) ergs/sec are indicated on the figures. There are only two such objects (actually lying close to the limit) in Bor03. The Gru03 sample contains many low luminosity objects, but a large number of NLS1s are above the luminosity limit.
We see that the self-gravitation correction can decrease by about a factor three for large values of , but has no influence on small . For larger values of and of , the difference between the standard and the self-gravitating disc would be smaller. So we can consider that the two models here correspond to a kind of “error bar” on , for given BH mass and L(5100). Figs. 2 shows also the “observed” ratio L(5100)/. We have noted the NLS1s, and the thick dotted lines delineate the position of for NLS1s. NLS1s always have BH masses smaller than 108 M⊙, and they are located in the higher range of L(5100)/ and . It is interesting to note that the four samples do not differ except for the range of masses and luminosities, though they have been selected quite differently.
Again we added for comparison to these figures the results for the Kaspi et al. sample, computed using only the standard disc emission (we recall that the results differ from CO2 because we use here instead of 50). As expected, the extrapolation by a factor 5 in mass range of the empirical relationship translates in an extrapolation of by about a factor 30, as .
Several other results appear on these figures.
First increases as the BH mass decreases. On the contrary, the ratio L(5100)/ is always smaller than 0.3, and seems about constant for the NLS1s. When applying a standard correction , one concludes that saturates at about the Eddington luminosity, whatever the BH mass. This excludes the existence of the large super-Eddington ratios proposed by Begelman (2002) due to the photon bubble instability. Thus, according to Eq. 3, there should be a lower limit to the FWHMs of the order of 1000 km/s unless the empirical relations do not apply to these objects. And indeed FWHMs of the order of 100-500 km/s which would imply Eddington ratios larger than 10 have never been observed in Seyfert 1 nuclei.
Second, the two horizontal lines correspond to , where , in the case of a Schwarschild BH () and of an extremely rotating Kerr BH (). We see that the accretion rates of NLS1s are always larger than the Eddington rate in the case of Kerr BHs, and mostly larger in the case of Schwarzschild BHs.
There are several causes of uncertainties in the results (cf. Krolik 2001 and C02), which might introduce errors on the BH masses as large as one order of magnitude, because one should not forget that even the masses determined directly with reverberation mapping are known with an uncertainty of a factor 3. It seems however implausible that all the uncertainties would systematically act towards an underestimation of the mass and an overestimation of the luminosity, avoiding the conclusion of super-Eddington accretion rates. Only the uncertainty on the correcting factor of the FWHM due to the geometry and kinematics of the BLR could lead to a systematic underestimation of the mass, if the BLR is a rotating flat structure. It can be large when the objects are seen almost face-on. We shall discuss this point in the last section.
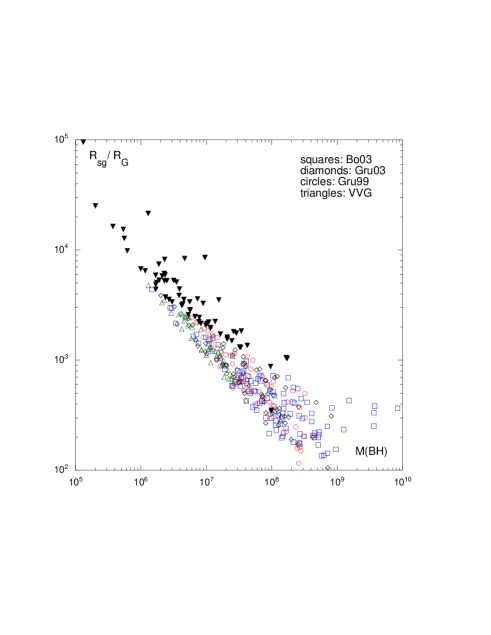
Fig. 3 displays versus for all samples, for the self gravitating disc with . We note that it is always quite small (in particular smaller than the BLR, which has typical values 103 for high BH masses and 105 for NLS1s), justifying our previous claim that the BLR is always located in, or above, the unstable part of the disc. As expected decreases with the BH mass, except at the high mass limit, and there is a strong correlation between the two parameters.

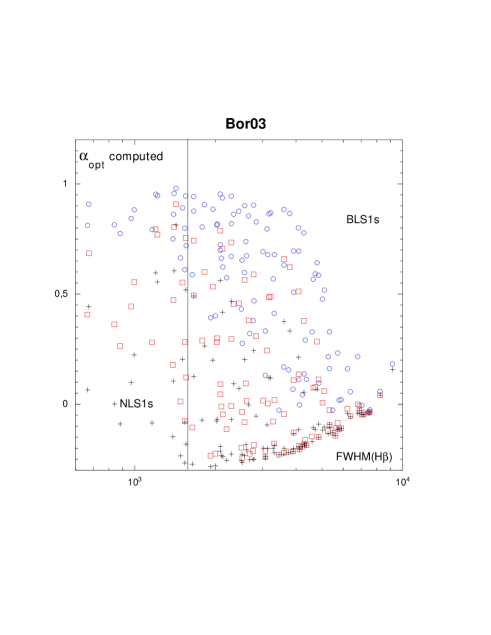
Although the choice of parameters for the self-gravitating disc does not influence strongly , it has an effect on the optical spectral index. As an illustration, Fig. 4 shows the computed optical spectral index defined as between 4400 and 7000Å (rest frame), for the Bor03 sample. The computation is performed with the self-gravitating correction, for a viscosity parameter equal to 0.01, 0.1, and 0.3. A systematic correction =0.05 for the galactic absorption has been applied (certainly an underestimation). For , the continuum is red except for very broad line objects. The trend that broader objects have bluer optical spectra is consistent with the observational results of Constantin & Shields (2003). The continuum is globally bluer for smaller values of (0.1 and 0.3). We also see that almost never reaches the value of the standard disc (-0.33). A detailed comparison with the observed values is postponed to the next paper.
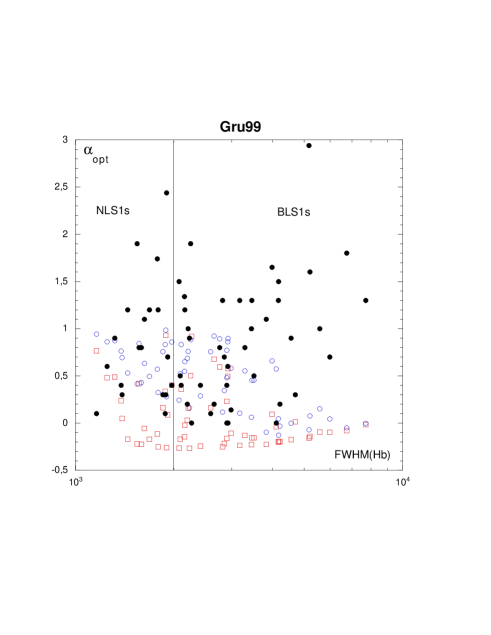
Fig. 5 shows a comparison between the observed and computed spectral indexes for the Gru99 sample, excluding the objects with L(5100) erg/s. According to Grupe et al. (1999), the observed values of are given with an uncertainty of . With , many of the computed indices are close to the value of the standard disc, while the objects of the samples are particularly red, with an average index of 0.8. The agreement is much better for the smallest viscosity parameter . The very red spectra observed in a fraction of objects might be due to intrinsic reddening not taken into account in the computed values. If it is the case, it would imply that the observed L(5100) is underestimated in these objects, but again it is not important for the determination of . Note that in this sample, NLS1s do not seem to have redder continua than BLR1s.
It is therefore impossible from this comparison to decide which are the best values of and to choose for the disc. Our model is clearly oversimplified, and would require a more sophisticated parametrization. The only conclusion which can be drawn is that a non-standard disc with an additional release of energy in its external region gives a better fit to the average optical continuum of AGN than a standard disc. However, this problem does not question the existence of super-Eddington accretion rates for NLS1s.
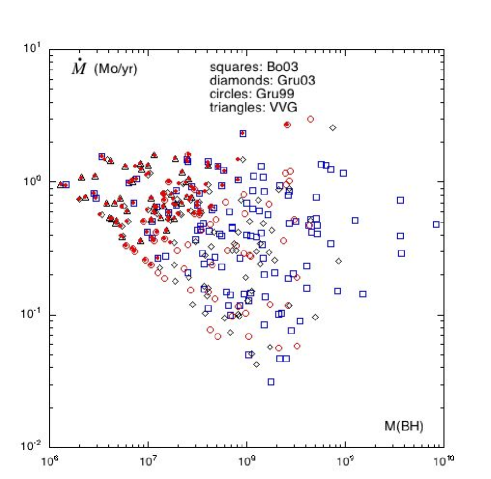
Finally Fig. 6 displays the accretion rates in M⊙/yr for the four samples, excluding the objects with L(5100) erg/s, and computed according to the self-gravitating disc model with a viscosity parameter . Note that the imposed limit on L(5100) creates the sharp limitation on the left side, as is proportional to (for a fixed ). The limitation on the right side is due to a limitation of at about 0.03 (perhaps due to the fact that the accretion disc changes into an ADAF below this value). NLS1s are indicated as red dots. Despite the large values of of NLS1s, we see that the maximum accretion rate is of the order of one M⊙/yr whatever the BH mass. This is a strong indication of an exterior regulation of the accretion, rather than the self-regulation of the disc. Note that it is a modest value when compared with the rate of star formation in a starburst nucleus.
4.2 Comparison with the slim disc model
It is interesting to compare the observed SED of super-Eddington objects with the slim disc model. As we mentioned in the introduction, this was done in detail for the two highest objects (Kawaguchi 2003; KPH; Kawaguchi, Matsumoto, Leighly in preparation; see Kawaguchi 2004). and it will be performed for the objects of the samples in a future paper. Here we simply compute the bolometric luminosity, and we compare it with the observed values.
Only the Gru03 sample provides bolometric luminosities based on the observed SEDs. Fig. 7 shows the observed ratio versus for this sample. The low luminosity nuclei (L(5100) ergs/sec) have been suppressed. Also shown is the theoretical curves obtained for the slim disc model with a Schwarzschild and a Kerr BH. These curves depend very little on the BH mass and on the viscosity parameter. In spite of the large dispersion of the “observations”, it is clear that a majority of points lie above the Schwarzschild curve, meaning that the efficiency of the Schwarzschild BH is insufficient, i.e. a Kerr BH with an efficiency of about 0.15 would better fit the observations unless there is a systematic underestimation of the BH masses. On the other hand, the shape of the curve agrees well with the observed points, in particular in the “saturation” of above . Three objects reach an Eddington ratio of the order of 10, for .
5 Influence of the inclination on the masses and accretion rates
In all mass determinations, the FWHM is used instead of the dispersion velocity. It makes the implicit assumption that the velocities are distributed at random in the BLR. However, if the BLR is a flat structure dominated by rotation, the FWHM is proportional to sin, where is the angle between the normale and the line of sight (the inclination). It is clear that a small inclination can lead to a large underestimation of and therefore of the mass.
However the BLR cannot be a geometrically thin disc with an exactly Keplerian velocity. Unfortunately its dynamics and its structure are still not well determined from detailed reverberation mappings, but we know that it should be at least a “thick disc”, with an aspect ratio larger than, say, ( being the disc thickness at the radius ), since it needs to have a large coverage factor of the central source. Such a disc must be sustained vertically by a turbulent pressure corresponding to a turbulent velocity of the order of . The FWHM is then proportional to , and the ratio between the real mass and the “observed” mass, is:
| (11) |
We can compute how many objects have a mass underestimated by a given factor , assuming that they are distributed at random inside an angle . We choose in the following computations, as it is a commonly accepted value for the opening angle of the dusty torus in Seyfert 1 (according to the Unified Scheme, cf. Antonucci & Miller 1985). The probability of seeing an object at an inclination angle per unit angle interval is thus sin[cos. The number of objects per unit interval of is:
| (12) |
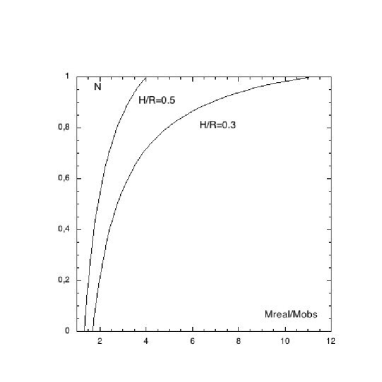
Fig. 8 shows the integral of this expression, i.e. the cumulative number of objects (normalized to unity) on which an underestimation of the mass by a factor smaller than is made, for two values of . Note that plays a non negligible role here, as it contributes to increase the proportion of objects having a large by a factor 3 with respect to an isotropic distribution. We see that the factor depends strongly on the aspect ratio the BLR. For , it can take values as large as 11, but the number of objects reaching this value is small: only about 20% have a -factor larger than 6, and 1% a factor larger than 10. For , the maximum value of is only 4, and about 60% have a -factor of the order of or smaller than 2.
It is important to realize that in this case not only nearly face-on objects, but all Seyfert 1 will have their BH mass underestimated. This would raise a problem concerning the BH-bulge mass relationship.
Would we have thus to modify our conclusions? For , half of NLS1s could have their masses underestimated by factors of 3 to 10, leading to underestimations of the accretion rates (in terms of Eddington) by factors 10 to 100. It is clearly very important, but still a large proportion of objects would be accreting above the Eddington limit, however at a smaller rate. On the other hand, it is quite possible that the few extremely high accretors are actually “face-on” objects, and that their mass is indeed underestimated by about one order of magnitude.
6 Conclusion
We used the BH masses deduced from the size-luminosity relationship to compute their accretion rate in four samples of AGN, assuming that the optical luminosity is provided by the accretion disc. Thus the empirical relation must be extrapolated in a range of masses almost one order of magnitude smaller than the Kaspi et al. sample. We used a simplified disc model, with a parametrization of the energy release in the self-gravitating region to get the accretion rate, and the slim disc model in the inner regions in order to get the bolometric luminosity. In spite of the crudeness of the treatment, this study leads to several fairly certain conclusions.
-
•
NLS1s are always accreting at Eddington or super-Eddington rates. can reach 1000, corresponding to an accretion rate equal to 60 (for Schwarzschild BH) and to 300 (for Kerr BH).
-
•
Their observed bolometric luminosities “saturate” at 10 Eddington luminosities, as predicted by slim disc models. It explains why there is a lower limit to the observed FWHM.
-
•
The observed value of the bolometric luminosities are in better agreement with a Kerr than with a Schwarzschild BH.
-
•
The computed optical spectral indexes agree with the observed trend of redder spectra for NLS1s than for BLS1s.
-
•
And finally the accretion rates have an upper limit of about one M⊙/yr, whatever the BH mass. In particular, all NLS1s have an accretion rate of this order. This is a strong indication for a mass limited supply, implying an exterior regulation of the accretion.
With these results we are in a position to say now that NLS1s should have a strong influence on the growth of BHs. This is in agreement with the claim by Mathur et al. 2001, and Grupe & Mathur 2004. Since NLS1s constitute about 10 of normal Seyfert which themselves are about 2 of inactive galaxies, one deduces that all galaxies spend 0.2 of their lifetime in the NLS1 phase, i.e. 2 107 years. During this time the mass of the BH increases by one order of magnitude (Kawaguchi et al. 2004). This could account both for the observed large dispersion in the BH/bulge mass relation of NLS1s, and for the existence of undermassive BH/bulge ratios during a large fraction of the NLS1 phase. The increase of the bulge mass could have taken place during merger or interaction events. BHs would then grow during intense phases of activity after a time delay, necessary for accumulating matter in the circumnuclear region and for triggering a starburst. In this scenario, the overabundance of iron could be easily explained by the rapid formation of massive stars and supernovae explosions in the outer parts of the accretion disc where the accretion rate is high (Collin & Zahn 2000, Levin 2003, Levin & Belobodorov 2003). The scenario would also account naturally for the presence of outflows giving rise to the blue wing of the [OIII] line, as super-Eddington accretion is expected to generate outflows by strong radiation fields.
Though we have tried to determine a lower limit of the accretion rate, two effects can intervene to still reduce it. They were both discussed in C02.
1- the possibility that the accretion rate decreases with the radius between the optically emitting region and the BH, owing to the creation of a strong outflow due to the radiation pressure. The accretion rate close to the BH would then be just Eddington. In this case, the outflow could well be the origin of the [OIII] wing, and could lead to the escape of a part of the Narrow Line Region, explaining the weakness of the [OIII] line. However, one should realize that in this case the rate of outflow would have to represent 90 or even 99 of the accretion rate, in the highest accretors. This seems unrealistic.
2- The optical luminosity is not provided by the accretion disc. Recently King & Pounds (2003) suggested that BHs accreting at super Eddington rate produce winds which are Thomson thick and can emit a black body spectrum providing the Blue Bump of AGN. Pounds et al. (2003) indeed report that they have found the signature of such an optically thick wind in the X-ray spectrum of the NLS1 PG1211+143. If the existence of such a wind is confirmed in other NLS1s, then it is clear that the present analysis would have to be reconsidered. However let us recall that Collin et al. (2002) have shown that very strong conditions must be met in such a wind to give rise to the optical-UV featureless continuum: it must have both a large density (1014 cm-3), and a Thomson thickness at least of unity. Besides, to get the observed luminosity, it should be located far from the center and it should have a large spatial extension. It is thus not obvious that the wind observed by Pounds et al. (2003) satisfies these requirements. It is more likely that its emission is limited only to the EUV radiation, and that the optical emission is still due to the accretion disc.
We have assumed all along the paper that the BH masses of NLS1s are correctly estimated by the empirical reverberation relations, even when these relations had to be extrapolated by almost one order of magnitude. On the other hand, we have accepted the usual assumption that the FWHM is a good measure of the velocity in the BLR, implicitly assuming that the velocities are distributed at random. If on the contrary the BLR is a flat structure dominated by rotation, the BH masses of a fraction of objects could be underestimated by factors up to one order of magnitude and the accretion rates (in terms of Eddington) by two order of magnitudes when they are seen nearly face-on. However, since this fraction should be small, we think that the scenario described in this paper is qualitatively correct.
Acknowledgements.
We are grateful to Amri Wandel for useful comments which have contributed to improve substantially the paper.References
- Abramowicz, Czerny, Lasota, & Szuszkiewicz (1988) Abramowicz, M. A., Czerny, B., Lasota, J. P., & Szuszkiewicz, E. 1988, ApJ, 332, 646
- (2) Antonucci, R.R.J., Miller, J.S. 1985, ApJ197, 621
- Baldwin, Ferland, Korista, & Verner (1995) Baldwin, J., Ferland, G., Korista, K., & Verner, D. 1995, ApJ, 455, L119
- (4) Begelman M.C. 1978, MNRAS, 184, 53
- Begelman (2002) Begelman, M. C. 2002, ApJ, 568, L97
- (6) Bian, W. & Zhao, Y. 2003, Chin. J. Astron. Astrophys. 2, 119
- Bian & Zhao (2004) Bian, W. & Zhao, Y. 2004, MNRAS, 347, 607
- Boller (2000) Boller, T. 2000, New Astronomy Review, 44
- Boroson (2003) Boroson, T. A. 2003, ApJ, 585, 647
- (10) Botte, V., Ciroi, S., Rafanelli, P., Di Mille, F. 2004, astro-ph/0402627
- Collin-Souffrin & Dumont (1989) Collin-Souffrin, S. & Dumont, A. M. 1989, A&A, 213, 29
- Collin & Zahn (1999) Collin, S. & Zahn, J. 1999, A&A, 344, 433
- Collin & Huré (1999) Collin, S. & Huré, J. 1999, A&A, 341, 385
- Collin (2001) Collin, S. 2001, Advanced Lectures on the Starburst-AGN , 167
- Collin & Huré (2001) Collin, S. & Huré, J.-M. 2001, A&A, 372, 50
- Collin et al. (2002) Collin, S., Boisson, C., Mouchet, M., Dumont, A.-M., Coupé, S., Porquet, D., & Rokaki, E. 2002, A&A, 388, 771 (C02)
- Constantin & Shields (2003) Constantin, A. & Shields, J. C. 2003, PASP, 115, 592
- Czerny & Elvis (1987) Czerny, B. & Elvis, M. 1987, ApJ, 321, 305
- Elvis et al. (1994) Elvis, M., et al. 1994, ApJS, 95, 1
- Ferland & Rees (1988) Ferland, G. J. & Rees, M. J. 1988, ApJ, 332, 141
- Ferrarese & Merritt (2000) Ferrarese, L. & Merritt, D. 2000, ApJ, 539, L9
- Ferrarese et al. (2001) Ferrarese, L., Pogge, R. W., Peterson, B. M., Merritt, D., Wandel, A., & Joseph, C. L. 2001, ApJ, 555, L79
- Frank, King, & Raine (2002) Frank, J., King, A., & Raine, D. J. 2002, Accretion Power in Astrophysics: Third Edition, by Juhan Frank, Andrew King, and Derek J. Raine. Cambridge University Press, 2002, 398
- Fukue (2000) Fukue, J. 2000, PASJ, 52, 829
- Gebhardt et al. (2000) Gebhardt, K., et al. 2000a, ApJ, 539, L13
- Gebhardt et al. (2000) Gebhardt, K., et al. 2000b, ApJ, 543, L5
- Goldreich & Lynden-Bell (1965) Goldreich, P. & Lynden-Bell, D. 1965, MNRAS, 130, 97
- Grupe et al. (1998) Grupe, D., Beuermann, K., Thomas, H.-C., Mannheim, K., & Fink, H. H. 1998, A&A, 330, 25
- Grupe, Beuermann, Mannheim, & Thomas (1999) Grupe, D., Beuermann, K., Mannheim, K., & Thomas, H.-C. 1999, A&A, 350, 805
- (30) Grupe, D., Mathur, S. 2003, astro-ph/0312390
- Grupe, Wills, Leighly, & Meusinger (2004) Grupe, D., Wills, B. J., Leighly, K. M., & Meusinger, H. 2004, AJ, 127, 156
- Haehnelt, Natarajan, & Rees (1998) Haehnelt, M. G., Natarajan, P., & Rees, M. J. 1998, MNRAS, 300, 817
- Haehnelt & Kauffmann (2000) Haehnelt, M. G. & Kauffmann, G. 2000, MNRAS, 318, L35
- Hatziminaoglou et al. (2003) Hatziminaoglou, E., Mathez, G., Solanes, J., Manrique, A., & Salvador-Solé, E. 2003, MNRAS, 343, 692
- Hure (1998) Huré, J. 1998, A&A, 337, 625
- Kaspi et al. (2000) Kaspi, S., Smith, P. S., Netzer, H., Maoz, D., Jannuzi, B. T., & Giveon, U. 2000, ApJ, 533, 631
- Kawaguchi (2003) Kawaguchi, T. 2003, ApJ, 593, 69
- Kawaguchi, T., Pierens, A., & Huré, J.-M. (2004) Kawaguchi, T., Pierens, A., & Huré, J.-M. 2004, A&A, 415, 47 (KPH)
- (39) Kawaguchi, T. 2004, in Stellar-Mass, Intermediate -Masss, and Supermassive Black Holes, eds. K. Makishima & S. Mineshige, to appear in Progress of Theoretical Physics, Supplement
- (40) Kawaguchi, T., Aoki, K., Ohta, K., Collin, S. 2004, A&A, 420, L23
- (41) King, A. 2003, ApJ. 596, L27
- King & Pounds (2003) King, A. R. & Pounds, K. A. 2003, MNRAS, 345, 657
- Korista, Baldwin, Ferland, & Verner (1997) Korista, K., Baldwin, J., Ferland, G., & Verner, D. 1997, ApJS, 108, 401
- Koratkar & Blaes (1999) Koratkar, A. & Blaes, O. 1999, PASP, 111, 1
- Krolik & Begelman (1988) Krolik, J. H. & Begelman, M. C. 1988, ApJ, 329, 702
- (46) Laor, A., Fiore, F., Wilkes, B.,Elvis, M., McDowell, J. 1997, ApJ, 477, 93
- Laor (2001) Laor, A. 2001, ApJ, 553, 677
- Laor (2003) Laor, A. 2003, ApJ, 590, 86
- Levin & Beloborodov (2003) Levin, Y. & Beloborodov, A. M. 2003, ApJ, 590, L33
- Lodato & Bertin (2003) Lodato, G. & Bertin, G. 2003, ASP Conf. Ser. 290: Active Galactic Nuclei: From Central Engine to Host Galaxy, 223
- Magorrian et al. (1998) Magorrian, J., et al. 1998, AJ, 115, 2285
- (52) Marconi, A., Risaliti, G., Gilli,R., Hunt, L. K., Maiolino, R., Salvati, M. 2004, MNRAS, in press, astro-ph/0311619
- Mathur, Kuraszkiewicz, & Czerny (2001) Mathur, S., Kuraszkiewicz, J., & Czerny, B. 2001, New Astronomy, 6, 321
- Mathur (2000) Mathur, S. 2000, New Astronomy Review, 44, 469
- (55) Matsumoto, R., Kato, S., Fukue, J. & Okazaki, A.T. 1984, PASJ, 36, 761
- Menou, Haiman, & Narayanan (2001) Menou, K., Haiman, Z., & Narayanan, V. K. 2001, ApJ, 558, 535
- Mineshige, Kawaguchi, Takeuchi, & Hayashida (2000) Mineshige, S., Kawaguchi, T., Takeuchi, M., & Hayashida, K. 2000, PASJ, 52, 499
- Nelson & Whittle (1996) Nelson, C. H. & Whittle, M. 1996, ApJ, 465, 96
- Netzer & Laor (1993) Netzer, H. & Laor, A. 1993, ApJ, 404, L51
- Netzer (2003) Netzer, H. 2003, ApJ, 583, L5
- Nicastro (2000) Nicastro, F. 2000, ApJ, 530, L65
- Osterbrock & Pogge (1985) Osterbrock, D. E. & Pogge, R. W. 1985, ApJ, 297, 166
- Peterson & Wandel (1999) Peterson, B. M. & Wandel, A. 1999, ApJ, 521, L95
- Peterson & Wandel (2000) Peterson, B. M. & Wandel, A. 2000, ApJ, 540, L13
- Pounds et al. (2003) Pounds, K. A., Reeves, J. N., King, A. R., Page, K. L., O’Brien, P. T., & Turner, M. J. L. 2003, MNRAS, 345, 705
- Sanders et al. (1989) Sanders, D. B., Phinney, E. S., Neugebauer, G., Soifer, B. T., & Matthews, K. 1989, ApJ, 347, 29
- (67) Shimura, T. & Manmoto, T. 2003, MNRAS, 338, 1013
- Silk & Rees (1998) Silk, J. & Rees, M. J. 1998, A&A, 331, L1
- Soria & Puchnarewicz (2002) Soria, R. & Puchnarewicz, E. M. 2002, MNRAS, 329, 456
- Tremaine et al. (2002) Tremaine, S., et al. 2002, ApJ, 574, 740
- Umemura (2001) Umemura, M. 2001, ApJ, 560, L29
- Véron-Cetty, Véron, & Gonçalves (2001) Véron-Cetty, M.-P., Véron, P., & Gonçalves, A. C. 2001, A&A, 372, 730
- (73) Wandel, A. 1999, ApJ, 527, 649
- Wandel (1999) Wandel, A. 1999, ApJ, 519, L39
- Wandel, Peterson, & Malkan (1999) Wandel, A., Peterson, B. M., & Malkan, M. A. 1999, ApJ, 526, 579
- Wandel (2002) Wandel, A. 2002, ApJ, 565, 762
- Wang, Szuszkiewicz, Lu, & Zhou (1999) Wang, J., Szuszkiewicz, E., Lu, F., & Zhou, Y. 1999, ApJ, 522, 839
- Wang & Lu (2001) Wang, T. & Lu, Y. 2001, A&A, 377, 52
- Wang & Netzer (2003) Wang, J.-M. & Netzer, H. 2003, A&A, 398, 927
- Wang (2003) Wang, J. 2003, AJ, 125, 2859
- Williams, Pogge, & Mathur (2002) Williams, R. J., Pogge, R. W., & Mathur, S. 2002, AJ, 124, 3042