The evolutionary sequence of active galactic nuclei and galaxy formation revealed
Abstract
Today, almost every galaxy spheroid contains a massive black hole: a remnant of, and testament to, a period in its evolution when it contained an active galactic nucleus (AGN). However, the sequence and timescales of the formation of the black hole and surrounding spheroid of stars are completely unknown, leaving a large gap in our knowledge of how the Universe attained its present appearance. Here we present submillimeter observations of matched samples of X-ray absorbed and unabsorbed AGN which have luminosities and redshifts characteristic of the sources responsible for most of the mass in present day black holes. Strong submillimeter emission, an isotropic signature of copious star formation, is found only in the X-ray absorbed sample, ruling out orientation effects as the cause of the absorption. The space density and luminosity range of the X-ray absorbed AGN indicate that they are undergoing the transition between a hidden growth phase and an unabsorbed AGN phase, and implies that the X-ray absorbed period in the AGN’s evolution coincides with the formation of the galaxy spheroid.
1 Introduction
It is now known that the history of cosmic star formation and luminous AGN activity track each other rather well, both showing a dramatic decline between and the present day (Franceschini et al., 1999). Their legacy, the prevalence of massive black holes today (Yu & Tremaine, 2002) and the proportionality between black hole mass and the mass of their host galaxy spheroids (Merritt & Ferrarese, 2001), is most easily explained if the formation of the two components was coeval, i.e. the black hole was built up by accretion of the same gas that rapidly formed the stars of the spheroid. During this formation episode, the average bolometric luminosity of the stellar component is expected to exceed that emitted by the AGN by a factor of a few (Page et al., 2001a). Under such circumstances, a large fraction of stellar mass must have built up around the AGN that dominate the accretion power of the Universe, because these were responsible for the majority of present day black hole mass. The bulk of the comoving luminosity density was produced by objects with luminosities close to the break luminosity , on account of the AGN luminosity function at any redshift being characterised by a broken power law (Page et al., 1997; Boyle et al., 2000). While the X-ray background is chiefly produced by AGN at (e.g. Barger et al., 2001), the luminosity density of AGN was at its peak between and (Page et al., 1997; Miyaji et al., 2001). Therefore coeval black hole / stellar bulge formation would imply that a large fraction of the Universe’s star formation took place around AGN with , and .
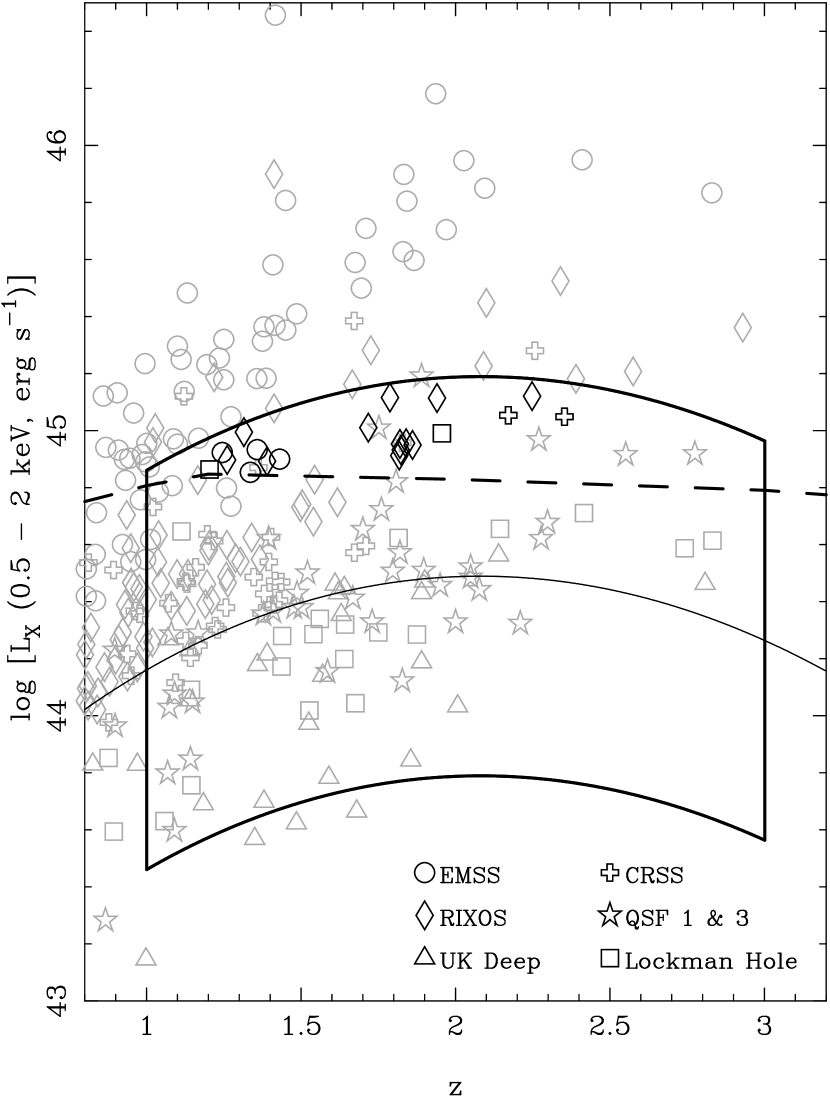
Submillimeter observations have already shown that there is a significant overlap between the bulge and black hole growth phases in X-ray absorbed QSOs in this range of redshifts and luminosities (Page et al., 2001a). These enigmatic objects are characterised by significant X-ray absorption (column densities of ) but little or no obscuration to their broad emission lines and ultraviolet continua (Page et al., 2001b). However, sensitive submillimeter observations have been performed for only eight such objects, and hence the temporal overlap between black hole and bulge growth phases is subject to considerable statistical uncertainty. More importantly, there were no sensitive submillimeter observations of a comparable sample of unabsorbed QSOs, which represent the majority of QSOs selected in soft X-ray surveys. Therefore we followed up this initial result with an experiment involving a larger sample of 20 unabsorbed objects. This sample is matched in luminosity and redshift to the original sample; it encompasses all of the crucial , region which can viably be investigated with the Submillimeter Common User Bolometer Array (SCUBA) at the James Clerk Maxwell Telescope (JCMT). Figure 1 shows the region of redshift–luminosity space from which the sample is drawn. The sample was drawn from a combination of several surveys: the Extended Einstein Medium Sensitivity Survey (EMSS, Stocke et al., 1991), the Rosat International X-ray Optical Survey (RIXOS, Mason et al., 2000), the UK Rosat Deep Survey (McHardy et al., 1998), the Cambridge-Cambridge Rosat Serendipity Survey (CRSS, Boyle et al., 1997), the QSF 1 & QSF 3 fields (Griffiths et al., 1995), and the Lockman Hole (Schmidt et al., 1998). The wide range of flux limits covered by these surveys is crucial in providing AGN over the required range of redshift-luminosity space. In all practical respects this sample is comparable to the original sample, except that it is composed of AGN that are unabsorbed in the X-ray band. A Hubble constant and density parameters and are assumed throughout this Letter.
2 Observations and data reduction
Observations at 850m were carried out at the JCMT between December 2002 and March 2003. The observations were carried out in photometry mode, in which the source is placed on the central bolometer of the array and the secondary mirror is jiggled in a 3 pattern with 2 arcsec intervals with a 1 s integration at each position. The secondary mirror was chopped 45 arcsec in azimuth at a frequency of 7.8 Hz and nodded between the source and reference positions every 18 s. Data were reduced using the standard STARLINK SURF software. After compensating for the nod, the data were flatfielded and corrected for atmospheric extinction. Each jiggle in turn was then corrected for residual sky noise which is correlated across the SCUBA field of view and often dominates the signal from faint sources. These sky offsets were taken to be the median signal from all bolometers on the given array (excluding noisy bolometers).
3 Results and discussion
The measured 850m flux densities for the X-ray unabsorbed QSOs are given in Table 1. Only one source (RXJ141954) is detected with confidence, and none of the sources are brighter than the 5 /5 mJy level. This lack of detections is in stark contrast to the sample of X-ray absorbed QSOs observed in 2001, of which 50% are brighter than 5 mJy (Figure 2). Far from simply improving the statistical uncertainty inherent to our original sample, the results for the unabsorbed AGN are incompatible with those for the absorbed sample. The lack of 5 mJy detections in the unabsorbed sample implies that at 95% confidence of unabsorbed QSOs are bright submillimeter sources (Gehrels, 1986), whereas the detection rate of the X-ray absorbed sources implies that at least 19% of X-ray absorbed QSOs are bright submillimeter sources. Our observations imply that unabsorbed QSOs, which have been studied for 30 years, and of which we know tens of thousands of examples, do not play a significant role in the Universe’s star formation history. In contrast, the X-ray absorbed QSOs at are embedded in the massive starbursts of still-forming galaxy spheroids.
To see why this is such a suprising and consequential result, we must consider the alternative models for the X-ray absorption in QSOs. By far the most widespread and most paradigmatic model is the AGN ‘unified scheme’ (Antonucci, 1993) in which the absorbing material is present in all objects in the form of a toroidal structure. In this model, absorbed and unabsorbed AGN are intrinsically identical, with the torus producing absorption in those objects viewed through it. This model is well established for the nearby, lower luminosity Seyfert galaxies, although there are some notable discrepancies, (e.g. Tran, 2003, and references therein), and most X-ray background synthesis and AGN population models are predicated on this concept (Setti & Woltjer, 1989; Comastri et al., 1995; Gilli et al., 2001). The more speculative alternative is that X-ray absorbed and unabsorbed QSOs are intrinsically different objects. In particular, it has been proposed that substantial absorption could be a defining characteristic of the early phases of QSO evolution (Fabian, 1999). In such models, the main, obscured growth phase of the QSO coincides with the formation of the host galaxy spheroid, the completion of which coincides with the luminous, unobscured phase of the QSO’s evolution (Silk & Rees, 1998; Sanders et al., 1988). In the unified scheme, any submillimeter emission powered by the nucleus will be orientation independent because the obscuring torus is optically thin at submillimeter wavelengths. Submillimeter emission originating in star forming regions will be similarly isotropic. Thus if the X-ray absorbed QSOs are absorbed because of their orientation to our line of sight, their submillimeter properties will be indistinguishable from those of X-ray unabsorbed QSOs.
Immediately then, the level of segregation we have found in the submillimeter properties of the X-ray absorbed and unabsorbed sources allows us to rule out orientation as the cause of the X-ray absorption. It therefore seems likely that the absorbed and unabsorbed QSOs represent different stages in an evolutionary sequence, in which the absorbed QSOs represent the earlier phase. This hypothesis is confirmed by Hubble Space Telescope images which show that the majority of unabsorbed QSOs lie in massive elliptical galaxies, at least for (Kukula et al, 2001; Dunlop et al., 2003); their regular, relaxed morphologies, imply that these are essentially mature, finished galaxies. Direct measurements of the morphologies and stellar masses of the host galaxies of unabsorbed QSOs at , while extremely difficult at present (e.g. Kukula et al, 2001; Croom et al., 2004), are also consistent with regular, relaxed morphologies. The lack of submillimeter emission from our sample of unabsorbed QSOs suggests that these objects also reside in relatively quiescent, fully formed host galaxies. Therefore unabsorbed QSOs have already undergone a period of prodigious star formation in which they would have shone as powerful submillimeter sources. That the X-ray absorbed QSOs are characterised by high submillimeter luminosities implies that they are embedded in the dense interstellar media of their forming host spheroids, and therefore that they are still at this earlier evolutionary stage. Furthermore, the first submillimeter images of their Mpc-scale environments indicate that they are located within significant overdensities of ultraluminous starburst galaxies which will rapidly evolve into rich clusters of galaxies typical of those that host X-ray unabsorbed QSOs (Stevens et al., 2004).
We now argue that there is a particular time in the evolution of a typical QSO corresponding to the X-ray absorbed phase. It immediately precedes the unabsorbed phase and lasts for only 15% of the lifetime of the optical QSO. First, their space density compared to unabsorbed QSOs allows us to make a crude estimate of the relative durations of the two phases. At a 0.5-2 keV flux of erg s-1 cm-2 the surface density of X-ray sources with Rosat spectra similar to the absorbed QSOs is 19 deg-2, of which around half are broad-line objects (Page et al., 2000, 2001b). The fluxes must be corrected for absorption to allow a meaningful comparison with unabsorbed QSOs; the average flux correction factor for the QSOs from the hard-spectrum Rosat survey is 1.5 (Page et al., 2001b). Thus there are X-ray absorbed QSOs deg-2 with an absorption corrected 0.5–2 keV flux of erg s-1 cm-2. This flux limit corresponds to erg s-1 at , i.e. close to in the epoch when QSO activity peaked (Page et al., 1997). For comparison, there are unabsorbed QSOs at the same X-ray flux limit (Page et al., 1997; Miyaji et al., 2001). Assuming that absorbed and unabsorbed QSOs accrete with the same Eddington ratio, this implies that the X-ray absorbed QSO phase typically lasts only around 15% as long as the unabsorbed phase (even less if QSOs accrete with higher Eddington ratios while they are still absorbed). Second, assuming that they accrete at 10% efficiency, that they do not exceed the Eddington limit, and that 3% of the accretion power is emitted in the 0.5-2.0 keV band (Elvis et al., 1994), their X-ray luminosities imply that they contain black holes of . Thus they are already relatively mature objects, and cannot grow by accretion much further without producing black holes that are larger than those found in typical unabsorbed QSOs. However, since their host spheroids are still forming, this brief phase must precede the unabsorbed QSO with its complete, quiescent spheroid. This strongly suggests that the X-ray absorbed QSOs are observed during a transitional phase which immediately preceeds the unabsorbed QSO, perhaps when the AGN has become powerful enough to eject the remaining cold interstellar medium and thereby terminate the growth of the spheroid (Fabian, 1999; Silk & Rees, 1998).
Before the X-ray absorbed phase, there is an initial phase that is so highly obscured as to have been missed in all but the deepest X-ray surveys undertaken so far. This earliest phase corresponds to the main growth period of the host galaxy spheroid, and so should be luminous in the submillimeter. During this phase the black hole must be accreting rapidly to achieve a mass of , and so must reach X-ray luminosities in excess of . If AGN in this initial phase were not X-ray absorbed, then a significant fraction of unabsorbed QSOs would be luminous submillimeter sources, but this is ruled out by our observations. If they were absorbed to a similar degree as the X-ray absorbed QSOs, they would outnumber this population substantially at the flux limits probed by the hard-spectrum Rosat survey, and certainly would be found in large numbers just below this flux limit in the deeper surveys that are now being carried out with XMM-Newton and Chandra. This is not the case (Mainieri et al., 2002; Page et al., 2003), and hence the earlier evolutionary phases must be characterised by considerably higher levels of X-ray absorption (). Since the great majority of optically selected QSOs show little or no X-ray absorption (Yuan et al., 1998), the earlier phases must also be heavily obscured in the restframe optical/UV. Consequently, AGN in the earliest stages of their evolution will be difficult to detect in any waveband, except for the far-IR/submillimeter where they will be strong sources. At present, the small number of optically faint, hard X-ray detected submillimeter sources reported by Ivison et al. (2002) and Alexander et al. (2003) are probably the best candidates for AGN in this initial phase because they are more heavily obscured than our Rosat-selected objects, although we can anticipate that future high-throughput X-ray observatories could reveal the buried AGN components in many more submillimeter sources. In contrast, the X-ray absorbed QSOs found in the hard-spectrum Rosat survey may be caught at the earliest evolutionary stage readily accessible to conventional X-ray and optical surveys; flourishing and youthful, they may only just be emerging from the obscuring gaseous cocoons of their birth.
References
- Alexander et al. (2003) Alexander, D. M., et al., 2003, AJ, 125, 383
- Antonucci (1993) Antonucci, R., 1993, ARA&A, 31, 473
- Barger et al. (2001) Barger, A. J., Cowie L. L., Bautz, M. W., Brandt, W. N., Garmire, G. P., Hornschemeier, A. E., Ivison, R. J., Owen, F. N., 2001, AJ, 122, 2177
- Boyle et al. (1997) Boyle, B. J., Wilkes, B. J., & Elvis, M., 1997, MNRAS, 285, 511
- Boyle et al. (2000) Boyle, B. J., Shanks, T., Croom, S. M., Smith, R. J., Miller, L., Loaring, N., & Heymans, C., 2000, MNRAS, 317, 1014
- Comastri et al. (1995) Comastri, A., Setti, G., Zamorani, G., & Hasinger, G., 1995, A&A, 296, 1
- Croom et al. (2004) Croom, S. M., Schade, D., Boyle, B. J., Shanks, T., Miller, L., Smith, R. J., 2004, ApJ, 606, 126
- Dunlop et al. (2003) Dunlop, J. S., McLure, R. J., Kukula, M. J., Baum, S. A., O’Dea, C. P., & Hughes, D. H., 2003, MNRAS, 340, 1095
- Elvis et al. (1994) Elvis, M., et al., 1994, ApJS, 95, 1
- Fabian (1999) Fabian, A. C., 1999, MNRAS, 308, L39
- Franceschini et al. (1999) Franceschini, A., Hasinger, G., Miyaji, T., Malquori, D., 1999, MNRAS, 310, L5
- Gehrels (1986) Gehrels, N., 1986, ApJ, 303, 336
- Gilli et al. (2001) Gilli, R., Salvati, M., Hasinger, G., 2001, A&A, 366, 407
- Griffiths et al. (1995) Griffiths, R. E., Georgantopoulos, I., Boyle, B. J., Stewart, G. C., Shanks, T., & della Ceca, R., 1995, MNRAS, 275, 77
- Ivison et al. (2002) Ivison, R. J., et al., 2002, MNRAS, 337, 1
- Kukula et al (2001) Kukula, M. J., Dunlop, J. S., McLure, R. J., Miller, L., Percival, W. J., Baum, S. J., & O’Dea, C. P., 2001, MNRAS, 326, 1533
- Mason et al. (2000) Mason, K. O., et al., 2000, MNRAS, 311, 456
- Mainieri et al. (2002) Mainieri, V., et al., 2002, A&A, 393, 425
- McHardy et al. (1998) McHardy, I. M., et al., 1998, MNRAS, 295, 641
- Merritt & Ferrarese (2001) Merritt, D., & Ferrarese, L., 2001, MNRAS, 320, L30
- Miyaji et al. (2001) Miyaji, T., Hasinger, G., & Schmidt, M., 2001, A&A, 369, 49
- Page et al. (1997) Page, M. J., Mason, K. O., McHardy, I. M., Jones, L. R., & Carrera, F. J., 1997, MNRAS, 291, 324
- Page et al. (2000) Page, M. J., Mittaz, J. P. D., & Carrera, F. J., 2000, MNRAS, 318, 1073
- Page et al. (2001b) Page, M. J., Mittaz, J. P. D., & Carrera, F. J., 2001, MNRAS, 325, 575
- Page et al. (2001a) Page, M. J., Stevens, J. A., Mittaz, J. P. D., & Carrera, F. J., 2001, Science, 294, 2516
- Page et al. (2003) Page, M. J., et al., 2003, AN, 324, 44
- Sanders et al. (1988) Sanders, D. B., Soifer, B. T., Elias, J. H., Madore, B. F., Matthews, K., Neugebauer, G., & Scoville, N. Z., 1988, AJ, 325, 74
- Setti & Woltjer (1989) Setti, G., & Woltjer, L., 1989, A&A, 224, L21
- Silk & Rees (1998) Silk, J., & Rees, M. J., 1998, A&A, 331, L1
- Stevens et al. (2004) Stevens, J. A., Page, M. J., Ivison, R. J., Smail, I., & Carrera, F. J., 2004, ApJ, 604, L17
- Stocke et al. (1991) Stocke, J. T., et al., 1991, ApJS, 76, 813
- Schmidt et al. (1998) Schmidt, M., et al., 1998, A&A, 329, 495
- Tran (2003) Tran, H. D., 2003, ApJ, 583, 632
- Yu & Tremaine (2002) Yu, Q., & Tremaine, S., 2002, MNRAS, 335, 965
- Yuan et al. (1998) Yuan, W., Brinkmann, W., Siebert, J., & Voges, W., 1998, A&A, 330, 108

| Source | log | ||
|---|---|---|---|
| RX J105316.8+573552 | 1.204 | 44.9 | |
| MS 0537.4-2843 | 1.245 | 44.9 | |
| RX J125456.9+564941 | 1.261 | 44.9 | |
| RX J125639.5+472410 | 1.315 | 45.0 | |
| MS 1633.1+2643 | 1.336 | 44.9 | |
| MS 1703.5+6052 | 1.358 | 44.9 | |
| RX J071858.8+712432 | 1.390 | 44.9 | |
| MS 0824.2+0327 | 1.431 | 44.9 | |
| RX J100926.3+533424 | 1.718 | 45.0 | |
| RX J105649.6+493412 | 1.788 | 45.1 | |
| RX J111918.6+211339 | 1.818 | 44.9 | |
| RX J180534.0+694733 | 1.820 | 45.0 | |
| RX J104718.6+541919 | 1.823 | 44.9 | |
| RX J232443.6+231537 | 1.840 | 45.0 | |
| RX J113655.3+295131 | 1.861 | 44.9 | |
| RX J112106.0+133825 | 1.940 | 45.1 | |
| RX J105331.8+572454 | 1.956 | 45.0 | |
| CRSS J1428.3+4231 | 2.171 | 45.1 | |
| RX J141954.3+543014 | 2.248 | 45.1 | |
| CRSS J1415.1+1140 | 2.353 | 45.0 |