The distances to Galactic low–mass X–ray binaries: consequences for black hole luminosities and kicks
Abstract
We investigated the reported distances of Galactic black hole (BH) and neutron star low–mass X–ray binaries (LMXBs). Comparing the distances derived for the neutron stars Cyg X–2 and XTE J2123–058 using the observed Eddington limited photospheric radius expansion bursts with the distances derived using the observed radius and effective temperature of the companion star we find that the latter are smaller by approximately a factor of 1.5–2. The latter method is often employed to determine the distance to BH LMXBs. A possible explanation for this discrepancy is that the stellar absorption lines in fast rotating companion stars are different from those in the slowly rotating template stars as was found before for early type stars. This could lead to a systematic mis–classification of the spectral type of the companion star, which in turn would yield a systematic error in the distance. Further, we derive a distance of 4.0 kpc for V404 Cyg, using parameters available in the literature. The interstellar extinction seems to have been overestimated for XTE J1550–564 and possibly for two other BH sources (H 1705–25, and GS 2000+25) as well. As a result hereof the distance to XTE J1550–564 may have been underestimated by as much as a factor three. We find that, using the new distances for XTE J1550–564 and V404 Cyg, the maximum outburst luminosity for at least 5 but perhaps even 7 of the 15 BH soft X–ray transients exceeds the Eddington luminosity for a BH showing that these systems would be classified as ultra–luminous X–ray sources had we observed them in other Galaxies. This renders support for the idea that many ultra–luminous X–ray sources are stellar–mass rather than intermediate–mass BHs. We find that the rms value of the distance to the Galactic plane for BHs is consistent with that of neutron star LMXBs. This suggests that BHs could also receive a kick–velocity during their formation although this has to be investigated in more detail. We find that the Galactic neutron star and BH l and b distributions are consistent with being the same. The neutron star and BH distribution is asymmetric in l with an excess of systems between -30 over systems with 0.
keywords:
stars: — stars: black holes — stars: neutron stars — X-rays: stars1 Introduction
Low–mass X–ray binaries (LMXBs) are binary systems in which a compact object – either a neutron star or a black hole – accretes matter from a low–mass companion star. Many of these systems are found to be transient, so called soft X–ray transients (SXTs). Several hundreds have been found in our own Galaxy (see Liu et al. 2001) and many of the X–ray point sources in other Galaxies are likely to be LMXBs as well (Fabbiano 1995). However, some of these X–ray sources in other Galaxies have luminosities in excess of the Eddington limits of both neutron star and ten solar mass black hole (BH) LMXBs (cf. Fabbiano 1989). These systems are thought to contain intermediate mass BHs (Colbert & Mushotzky 1999) or stellar mass BHs where the emission is anisotropic (King et al. 2001) or indeed super–Eddington (Begelman 2002).
Determining the distance to LMXBs is important, e.g. to determine the peak or quiescent luminosity and to determine if the compact object in LMXBs receives an (asymmetric) kick velocity at birth or not. Typically, a large distance to the Galactic plane implies the occurrence of a kick, unless the systems at large z–distances were formed in the halo.
In this Paper we collect distance estimates from the literature and discuss possible systematic trends related to the used distance estimation methods (Section 2). In Section 3 we discuss the implications for the Galactic distribution of (BH) LMXBs and the Galactic population of ultra–luminous X–ray sources (ULXs).
2 Distances to LMXBs
2.1 Black hole distances
For most BH SXTs it is not feasible to obtain a trigonometric parallax measurement. Instead the distance generally is determined by comparing the derived absolute –band magnitude with the (dereddened) apparent magnitude, taking into account a possible contribution from residual accretion (the distance derived using this method is sometimes called a photometric parallax). A first guess of the distance can be obtained by assuming that the absolute magnitude is that of a main–sequence star of the observed spectral type, after determining the best–fit spectral type from the data, e.g. via the optimal extraction technique (see Marsh et al. 1994 for a description of this technique). We call this method . However, ideally, the radius, spectral type, and luminosity class are determined directly from the data. We denote this method . The observations give the orbital period, P, the radial velocity of the donor star, K2 and, by comparing the donor star spectrum with templates that are Doppler broadened, the rotational velocity of the donor (v ). The inclination can be estimated from modelling the ellipsoidal variations in the light curve. From Kepler’s third law and the assumptions that the donor fills its Roche lobe and is in co–rotation with the orbit, all system parameters can be determined as follows. The mass function and inclination relate the masses of the two components, while a combination of Kepler’s law and the equation for the volume of the Roche–lobe gives (e.g. Wade & Horne 1988; q is defined here as the mass of the secondary divided by the mass of the primary), giving an independent estimate of q thus providing the system parameters. The radius can be estimated from . Alternatively, if or the inclination are not known, a quite good estimate of the radius can be obtained using the fact that the mean density of a Roche–lobe filling star depends only on the orbital period (Paczyński 1971). The radius of the donor star can be estimated via (where is in hours, in solar masses, and in units of solar radii).
In order to estimate the absolute magnitude one either uses the surface brightness for the observed spectral type or colour, as given e.g. by Barnes & Evans (1976) and Popper (1980) or uses the determined radius and effective temperature, together with an appropriate bolometric correction. Alternatively, one uses the fact that for given surface brightness the observed flux scales with the angular diameter (2 R/d), which together with the radius gives the distance. However, there are (small) differences in surface brightness for different luminosity classes of the same spectral type.
In case of GRO J1655–40 and GRS 1915+105, Hjellming & Rupen (1995) and Fender et al. (1999), respectively determined limits on the distance from the observed proper motion for receding and approaching blobs, assuming the jet ejections are intrinsically symmetric and noting that the maximum velocity of the ejections is the speed of light. We list this method as method . The distance can also be estimated using the interstellar absorption properties of the source. There are different ways to do this. For several interstellar absorption lines and diffuse interstellar bands the observed equivalent width correlates with colour excess (cf. Herbig 1995). The colour excess can be converted in a distance estimate (e.g. using the calibration of Beals & Oke 1953). It is also possible to compare the observed extinction to that of (OB) stars in the observed field for which the distance is known or can be derived (e.g. van Paradijs et al. 1986). The distance can also be constrained by using high–resolution spectroscopic observations of the interstellar absorption lines to trace individual gas clouds and their velocities. Assuming that the apparent velocities of the different gas clouds are projected Galactic rotation velocities, a lower limit on the distance of the object can be found (cf. Hynes et al. 2004). We refer to distances derived using the interstellar absorption properties as method . Finally, we note here that various other methods to estimate the distance to BH SXTs have been proposed and used. We do not discuss these in detail but we merely mention some of them: Hynes et al. (2002) used the normalisation of a model describing the accretion disc flux, Maccarone (2003) used the transition between the high/soft and low/hard X–ray states, and Jonker et al. (2004) proposed to use the normalisation of the radio – X–ray correlation in the low/hard state as a distance indicator.
In Table 1 we show the distance estimates in the literature based on method , , , and for sources for which the best estimate of the mass of the compact object is above the upper limit of the neutron star mass of M⊙ (Rhoades & Ruffini 1974; Kalogera & Baym 1996). Below, we briefly discuss the sources listed in Table 1 for which disparate values for the distance exist in the recent literature.
| Name | l | b | Spectral | Porb | Distance & Method | z | References |
|---|---|---|---|---|---|---|---|
| type | (hours) | (kpc) | (pc) | ||||
| GRO J0422+32 | 165.97 | -11.99 | K9–M2V | 5.09 | 2.5–3.0 () | -525 - -625 | [1,2] |
| 1A 0620–00 | 209.96 | -6.54 | K4–K5V | 7.75 | 1.20.4 () | -125 | [3,4] |
| GS 1009–45 | 275.88 | 9.35 | K6–M0V | 6.84 | 5.70.7 () | 925 | [5,6] |
| XTE J1118+480 | 157.66 | 62.32 | K5–M1V | 4.08 | 1.80.6 () | 1600 | [7,8] |
| GS 1124–684 | 295.30 | -7.07 | K3–K5V | 10.4 | 5.51.0 () | -675 | [9,10] |
| 4U 1543–47 | 330.92 | 5.43 | A2V | 26.8 | 7.50.5 () | 700 | [11,12] |
| XTE J1550–564 | 325.88 | -1.83 | G8IV–K4III | 37.0 | 5.32.3 () | -175 | [13] |
| GRO J1655–40 | 344.98 | 2.46 | F2–F6IV | 62.9 | 3.2 () | 125 | [14,15,16,17] |
| GX 339–4 | 338.94 | -4.33 | ?? | 42.1 | () | -450 | [18] |
| H 1705–250 | 358.59 | 9.06 | K0–K5V | 12.5 | 8.62 () | 1350 | [4,19,20] |
| SAX J1819.3–2525 | 6.77 | -4.79 | B9III | 67.6 | 9.6 () | -800 | [21] |
| XTE J1859+226 | 54.05 | 8.61 | G5–K0V | 9.17 | 950 | [22,23] | |
| GRS 1915+105 | 45.37 | -0.22 | K–MIII | 34 (days) | 11 () | -50 | [24,25,26] |
| GS 2000+25 | 63.37 | -3.00 | K3–K6V | 8.27 | 2.7 () | -150 | [4,27,28] |
| GS 2023+338 | 73.12 | -2.09 | G8–K1IV | 6.47 (days) | 4.0 () | -150 | [29,30, this work] |
a A method to estimate the distance
which has not been discussed here in detail has been used, see
reference 23 for more info.
References: [1] Gelino & Harrison 2003, [2] Harlaftis et al. 1999, [3] Shahbaz et al. 1994a, [4] Barret et al. 1996, [5] Barret et al. 2000, [6] Filippenko et al. 1999, [7] McClintock et al. 2001, [8] Wagner et al. 2001, [9] Orosz et al. 1996, [10] Esin et al. 1997, [11] Orosz et al. 1998, [12] Orosz et al. 2002a, [13] Orosz et al. 2002b, [14] Shahbaz et al. 1999, [15] Orosz & Bailyn 1997, [16] Tingay et al. 1995, [17] Hjellming & Rupen 1995, [18] Hynes et al. 2004, [19] Remillard et al. 1996, [20] Harlaftis et al. 1997, [21] Orosz et al. 2001, [22] Filippenko & Chornock 2001, [23] Hynes et al. 2002, [24] Mirabel & Rodriguez 1994, [25] Fender et al. 1999, [26] Greiner et al. 2001, [27] Harlaftis et al. 1996, [28] Callanan et al. 1996, [29] Wagner et al. 1992, [30] Shahbaz et al. 1994b
1A 0620–00:
Marsh et al. (1994) report a
distance of 485 pc for 1A 0620–00 whereas most other workers report a
distance close to 1.2 kpc (for references see
Table 1). This is due to a numerical error of a factor of 2
in the result of Marsh et al. (1994; also Marsh private communications).
Hence, the distance Marsh et al. (1994) find is 912/ pc. The
correct equation for the stellar distance is:
| (1) |
Where is the stellar diameter.
GRO J0422+32:
Webb et al. (2000) report a
distance of 1.390.15 kpc. However, besides the fact the best–fit
spectral type they derived for the companion star was M4–5, later
than that derived by e.g. Harlaftis et al. (1999) and
Gelino & Harrison (2003) who found a M1–2 spectral
type, they used method which is known to underestimate the radius
of the companion star. In the distance determination
Webb et al. (2000) use the absolute magnitude of a star with
radius R = 0.24 R⊙ (from
Kirkpatrick et al. 1993 via the bolometric magnitude and the
effective temperature), whereas the radius one would derive using the
equation in the first paragraph of Section 2.1 would give R
= 0.53 R⊙.
For that reason, we prefer the distance derived using method by Harlaftis et al. (1999) and Gelino & Harrison (2003). However, Harlaftis et al. (1999) used the same erroneous equation as Marsh et al. (1994). If we correct for this error, Harlaftis et al. (1999) found a distance of 5.01.6 kpc. Interestingly, Gelino & Harrison (2003) found a distance of 2.50.3 kpc even though they also used method . This is due to the fact that Harlaftis et al. (1999) use for an M1–2 star, while, both in Eaton & Poe (1984) and Cox (2000) give a value for the colour closer to 1.5 for a M2V star. Taking a of 1.5 for an M2 as in the relation of Eaton & Poe (1984) would yield a distance close to 2.5 kpc. Indeed, if we take the radius of the secondary and apparent –band magnitude corrected for interstellar extinction and an accretion disc contribution as given by Harlaftis et al. (1999) but use the relation given by Popper (1980) for an M2 star we find a distance of 2.8 kpc. We conclude that the distance to GRO J0422+32 is likely to be 2.5–3.0 kpc.
GX 339–4:
In the case of GX 339–4, the distance
has been estimated to be kpc using the equivalent width of the
CaII–K interstellar line (e.g. Cowley et al. 1987; see
Buxton & Vennes 2003 for an overview). Recently, from high
resolution spectroscopic observations resolving the contributions to
the interstellar Na D absorption lines, Hynes et al. (2004) found that
the distance to GX 339–4 is likely to be more than 6 kpc. They explain
that in order for the distance to be kpc the line–of–sight
towards GX 339–4 must be peculiar. The limit on the distance of
GX 339–4 found by Maccarone (2003) indicates that
d7.6 kpc. In Table 1 we refer to the value derived by
Hynes et al. (2004).
GS 2023+338, a.k.a. V404 Cyg:
The distance to
GS 2023+338 has been reported to be close to 3 kpc
(Shahbaz et al. 1994b) or 8 kpc (White & van Paradijs 1996;
even a distance of 11 kpc has been mentioned
Casares et al. 1992). King (1993) finds that
if the secondary is a stripped–giant, GS 2023+338 must have a
distance 3.5–5.1 kpc. In an attempt to reconcile the different
distances we recalculate the distance using method . We used the
relation between the absolute visual magnitude, spectral type and
radius of the companion star given by Popper (1980). The
spectral type of GS 2023+338 is K01
(Casares et al. 1993). We take for
the radius of the companion star after Shahbaz et al. (1994b) who
obtained this from modelling the ellipsoidal variations in the
–band light curve. From the relation of
Popper (1980) we find for the absolute magnitude
. We further take using the
observed –band magnitude of 18.42 and the fact that approximately
25 per cent of the light in the –band was estimated to come from
the accretion disc, although the uncertainty in the accretion disc
contribution is large (Casares et al. 1993). Here we took
2515 per cent for the accretion disc contribution to the light in
the –band; from this we get for the observed –band magnitude
. Together with an assumed interstellar
absorption of , this yields a distance of
4.0 kpc. Note that this calculation does not include
an uncertainty in the interstellar absorption (see below). Since, as
mentioned above, the accretion disk contribution is uncertain we also
determined the distance assuming that there is no contribution of the
accretion disc to the –band flux (this assumption yields a lower
limit to the distance). For a K0V/III star the colour is
1.96/2.31 (Cox 2000), using the relations between
the colour and the surface brightness as determined by
Bailey (1981) we get a lower limit to the distance
of 2.7 kpc for a K0III and 3 kpc for a K0V companion star (again we
used after Shahbaz et al. 1994b) and
we took A.
2.2 Neutron star LMXB distances
In order to compare the BH distances with the neutron star LMXB distances, we list in Table 2 the distances to neutron star LMXBs. We excluded sources in Globular Clusters since we want to compare the neutron star sample with that of BHs and (so far) BHs have not been found in Globular Clusters.
Some of the type I X–ray bursts, more specifically those showing evidence for photospheric radius expansion can be used as a standard candle (van Paradijs 1978). Using the distance of the Galactic Centre and those of Globular Clusters to estimate the maximum peak luminosity for photospheric radius expansion bursts van Paradijs (1981) found that the average peak luminosity of photospheric radius expansion bursts is erg s-1. Verbunt et al. (1984) used a more extensive sample of X–ray bursters in Globular Clusters and found an average peak luminosity of erg s-1. Recently, Kuulkers et al. (2003) found a neutron star Eddington luminosity of erg s-1 for the peak luminosity of radius expansion bursts in Globular Clusters. This luminosity is consistent with the Eddington luminosity of a 1.4 M⊙ neutron star accreting helium rich material. Kuulkers et al. (2003) also found that a few systems have a lower peak luminosity of erg s-1 which can be interpreted as the Eddington luminosity for hydrogen rich accreted material. Therefore, and for reasons explained in Section 2.3.4, we use both a peak luminosities to calculate the distance to the neutron star LMXB.
For Aql X–1 we determined the burst peak flux in a 0.25 s bin from a photospheric radius expansion burst detected with the RXTE satellite in the observation starting on MJD 51364.834069 (Terrestrial Time). In this we subtracted the average persistent emission 5–105 seconds before the burst. The bolometric burst peak flux is 1.1 erg cm-2 s-1. We corrected the Aql X–1 flux for the fact that fluxes derived using the RXTE satellite are found to be systematically higher by about 20 per cent than the X–ray fluxes in the same band found by other satellites (cf. Tomsick et al. 1999b; Barret et al. 2000; Kuulkers et al. 2003). Finally, we use the distance for Sco X–1 as determined from radio parallax measurements (d=2.80.3 kpc, Bradshaw et al. 1999).
| Name | l | b | T/Pa | Porb | Peak burst flux | Distance | z | References |
|---|---|---|---|---|---|---|---|---|
| hours | erg cm-2 s-1 | 2.0–3.8c (kpc) | 2.0–3.8c (pc) | |||||
| EXO 0748–676 | 279.98 | -19.81 | T | 3.82 | 3.8 (i) | 6.8–9.1 | -2300 – -3075 | [1] |
| 2S 0918–54 | 275.85 | -3.84 | P | ? | 9.4 (ii) | 4.3–5.8 | -300 – -400 | [18,19] |
| Cir X–1 | 322.12 | 0.04 | T/P? | 398 | 2.9 (i) | 7.8–10.5 | 0 – 0 | [2,3] |
| 4U 1608–522 | 330.93 | -0.85 | T | 12.9? | 2.2 (i) | 2.8–3.8 | -50 – -50 | [4] |
| Sco X–1 | 350.09 | 23.78 | P | 18.9 | parallax | 2.8 | 1125 | [20] |
| 4U 1636–53 | 332.91 | -4.82 | P | 3.80 | 1.3 (i) | 3.7–4.9 | -300 – -400 | [21] |
| 4U 1658–298 | 353.83 | 7.27 | T | 7.11 | 2.5 (ii) | 8.4–11.3 | 1075 – 1425 | [5] |
| 4U 1702–429 | 343.89 | -1.32 | P | ? | 6.6 (ii) | 5.3–7.1 | -125 – -175 | [32] |
| 4U 1705–44 | 343.32 | -2.34 | P | ? | 3.7 (ii) | 7.2–9.6 | -300 – -400 | [32] |
| XTE J1710–281 | 356.36 | 6.92 | T | ? | 8.6 (ii) | 14.8–19.8 | 1800 – 2375 | [32] |
| SAX J1712.6–3739 | 348.93 | 0.93 | T | ? | 5.1 (ii) | 5.9–7.9 | 100 – 125 | [6] |
| 1H 1715–321 | 354.13 | 3.06 | P/T? | ? | 6.7 (ii) | 5.1–6.9 | 275 – 375 | [22] |
| RX J1718.4–4029 | 347.28 | -1.65 | P/T? | ? | 4.3 (i) | 6.4–8.6 | -200 – -250 | [23] |
| 4U 1728–34 | 354.30 | -0.15 | P | ? | 8.4 (i) | 4.5–6.1 | 0 – -25 | [24,25] |
| KS 1731–260 | 1.07 | 3.65 | T | ? | 6.3 (ii) | 5.3–7.1 | 325 – 450 | [7] |
| 4U 1735–44 | 346.05 | -6.99 | P | ? | 2.9 (ii) | 8.0–10.8 | -975 – -1325 | [32] |
| GRS 1741.9–2853 | 359.96 | 0.13 | T | ? | 4.0 (i) | 6.6–8.9 | 25 – 25 | [8] |
| 2E 1742.9–2929 | 359.56 | -0.39 | T/P? | ? | 3.7 (ii) | 6.9–9.2 | -50 – -75 | [32] |
| SAX J1747.0–2853 | 0.21 | -0.24 | T | ? | 3.2 (ii) | 7.5–10 | -25 – -50 | [9] |
| GX 3+1 | 2.29 | 0.79 | P | ? | 9.3 (i) | 4.3–5.8 | 50 – 75 | [26] |
| SAX J1750.8–2900 | 0.45 | -0.95 | T | ? | 6.4 (ii) | 5.2–7.0 | -75 – -125 | [10] |
| SAX J1752.3–3138 | 358.44 | -2.64 | P/T? | ? | 2.8(ii) | 7.9–10.6 | -375 – -475 | [27] |
| SAX J1808.4–3658 | 355.38 | -8.15 | T | 2.0 | 2.5 (ii) | 2.7–3.6 | -375 – -500 | [11] |
| SAX J1810.8–2609 | 5.20 | -3.43 | T | ? | 7.0 (ii) | 5.1–6.8 | -300 – -400 | [12] |
| 4U 1812–12 | 18.06 | 2.38 | P | ? | 1.5 (ii) | 3.4–4.6 | 150 – 200 | [28] |
| XTE J1814–338 | 358.75 | -7.59 | T | 4.27 | 2.6 (ii) | 8.2–11.0 | -1075 – -1450 | [13] |
| GX 17+2 | 16.43 | 1.28 | P | ? | 1.2 (ii) | 11.9–16.0 | 275 – 350 | [29] |
| Ser X–1 | 36.12 | 4.84 | P | ? | 2.1 (ii) | 9.5–12.7 | 800 – 1075 | [32] |
| Aql X–1 | 35.72 | -4.14 | T | 19.0 | 9.1 (ii) | 4.4–5.9 | -325 – -425 | [14] |
| 4U 1857+01 | 35.02 | -3.71 | T | ? | 3 (ii) | 7.5–10 | -500 – -650 | [15] |
| 4U 1916–053 | 31.36 | -8.46 | P | 0.83 | 3.1 (ii) | 7.5–10.1 | -1100 – -1475 | [30] |
| XTE J2123–058 | 46.48 | -36.20 | T | 5.96 | 7 (ii) | 15.7–21 | -9275 – -12.4 | [16,17] |
| Cyg X–2 | 87.33 | -11.32 | P | 236.2 | 1.35(ii) | 11.4–15.3 | -2250 – -3000 | [31] |
a T= transient, P=persistent
b Corrected for the fact that RXTE fluxes are found to be higher by 20 per cent
c Determined assuming an Eddington peak flux of 2.0 or 3.8 erg s-1
References: [1] Gottwald et al. 1986, [2]
Tennant et al. 1986, [3] Brandt et al. 1996, [4]
Murakami et al. 1987, [5] Wijnands et al. 2002, [6]
Cocchi et al. 2001a, [7] Muno et al. 2001, [8]
Cocchi et al. 1999, [9] Natalucci et al. 2000b, [10]
Kaaret et al. 2002, [11] in’t Zand et al. 2001, [12]
Natalucci et al. 2000a, [13] Strohmayer et al. 2003, [14]
This work, [15] Chevalier & Ilovaisky 1990a, [16]
Homan et al. 1999, [17] Tomsick et al. 1999a, [18]
Jonker et al. 2001, [19] Cornelisse et al. 2002, [20]
Bradshaw et al. 1999, [21] Fujimoto et al. 1988 and references therein, [22]
Tawara et al. 1984, [23] Kaptein et al. 2000, [24]
Basinska et al. 1984, their “super–burst”, [25]
Hoffman et al. 1980, [26] Kuulkers & van der Klis 2000, [27]
Cocchi et al. 2001b, [28] Cocchi et al. 2000, [29]
Kuulkers et al. 2002, [30] Galloway et al. 2001, [31]
Smale 1998, [32] Galloway et al. 2004, in prep
2.3 Systematics and uncertainties in distance estimates
Orosz & Kuulkers (1999) derived a distance of 7.2 kpc for Cyg X–2, using method (they used the spectral type of the companion derived by Casares et al. 1998). From the radius expansion burst (Smale 1998) we find a distance of 15.3 kpc, approximately a factor two larger. The large differences in these distance estimates are difficult to explain. Even if the radius expansion bursts are hydrogen–rich and hence the burst peak luminosity is lower (see Section 2.3.4), there would still be a difference in distance estimates of a factor 1.5. However, due to the large photon rate deadtime effects could lower the apparent burst peak flux. The bolometric burst peak flux corrected for deadtime effects was 1.5 erg cm-2 s-1 (Smale 1998; compare this with the value in Table 2). This makes the distance smaller by 4 per cent. On the other hand, correcting the observed fluxes for the fact that the RXTE/PCA fluxes are generally found to be 20 per cent higher than fluxes determined using other satellites would make the radius expansion burst distance larger. Furthermore, if Cyg X–2 is a halo object with a low metallicity the absolute –band magnitude would be smaller than that of a star with solar metallicity in order to explain the observed spectral type, making the discrepancy even bigger. A possible solution for the distance discrepancy could be that the neutron star in Cyg X–2 is lighter than the canonical value of 1.4 M⊙ (although this would also affect the optically determined distance). However, this is at odds with the findings of Casares et al. (1998) and Orosz & Kuulkers (1999) who find that the mass of the neutron star in Cyg X–2 is 1.88 M⊙ and 1.780.23 M⊙, respectively.
From spectroscopic observations of XTE J2123–058 in quiescence Casares et al. (2002) determined a best–fit spectral type for the companion star of K7V (they ruled out spectral types earlier than K3 and later than M1). Shahbaz et al. (2003) report a quiescent –band magnitude for XTE J2123–058 of 22.650.06, a reddening in the –band of 0.37 magnitudes, and that the companion star contributes approximately 77 per cent of the flux in the –band. Here we assume that the companion star contributes 70 per cent of the flux in the –band. Again using the relation of Popper (1980) to estimate the absolute –band magnitude gives for the observed mass ratio of 0.49 and assuming a neutron star mass of 1.4 M⊙ (had we assumed a neutron star mass of 2.0 M⊙ we would have gotten ). We again assumed that the companion star fills its Roche lobe. From this we derive a distance of 8.7/9.6 kpc for a neutron star mass of 1.4/2.0 M⊙, respectively (see also Tomsick et al. 2004 and references therein). The distance derived using the radius expansion burst is 15.7–21 kpc (see Table 2; deadtime effects are negligible in case of XTE J2123–058). For the limiting spectral types of the companion star (K3/M0V) the distance would be 14/7 kpc for a 1.4 M⊙ neutron star. So, even for an assumed K3 spectral type the distance is lower than that derived using the radius expansion burst. Again, as in the case of Cyg X–2, correcting the parameters we used in the distance calculations either for the fact that the RXTE/PCA fluxes are generally found to be 20 per cent higher than fluxes determined using other satellites or for the fact that XTE J2123–058 might be a halo object with a low metallicity would make the discrepancy between the photospheric radius expansion burst–distance and the method bigger.
Even though the sample of neutron star sources for which we can compare the distances derived using radius expansion bursts and that derived using the properties of the companion star is small (so far this is only possible for two source), this could mean that distances derived using method are too low, or that the distance derived using the radius expansion burst is too large. Below we will investigate in some detail possible effects responsible for the observed discrepancy in distance estimate between method and the radius expansion burst method.
2.3.1 Systematics in the companion star radius determination and residual accretion
As mentioned earlier, under the assumption that the companion star fills its Roche lobe a first estimate of the radius of the companion star can be obtained (cf. White & van Paradijs 1996). Given the fact that mass accretion must take place in order to explain the multiple outbursts for some of the systems the assumption that the secondary (nearly) fills its Roche lobe seems justified. However, if the temperature distribution on the surface of the star is uneven e.g. due to effects of irradiation, then the luminosity is not determined by the full size of the companion star. Depending on whether the determined temperature is that of the hotter or colder part of the star this yields an over or under estimate of the distance.
An under estimate of the amount of light contributed due to residual accretion would lead to an under estimate of the distance and vice versa.
2.3.2 Systematics in the companion star temperature determination
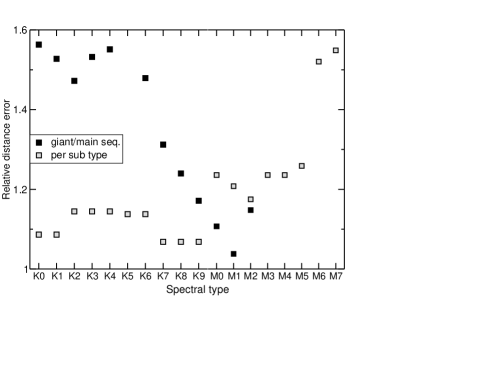
Besides the radius, the temperature of the companion star is important for its luminosity. The temperature is derived from the observed spectral type. A systematic mis–classification of one spectral type for a fixed radius (e.g. using a K1V instead of a K0V star) already results in a distance error of 15–25 per cent for late type stars (see Figure 1). The difference in derived distance between using the surface brightness of main–sequence stars or giants (for fixed radius) is also given in Figure 1. The giant surface brightnesses lead to smaller absolute magnitudes, i.e. smaller distances.
The best–fit spectral type can be determined using the optimal subtraction method (Marsh et al. 1994) which is quite robust. However, this method is rarely applied fully. The broadband spectral energy distribution can also be used to determine the spectral type (cf. Gelino et al. 2001 and Gelino & Harrison 2003 for recent use of this method). However, disentangling the effects of fast rotation, reddening, a possible accretion disc contribution, and the spectral type is difficult with only a few data points. This makes the uncertainty in the temperature of the companion star an important contributor to the uncertainty in the distance. For XTE J2123–058 a spectral type of K2 (just outside the determined range) would already make the two different distance estimates consistent. For Cyg X–2 a spectral type of A0 is needed while the determined type is A92. However, from the effects discussed above, there is no reason to expect a systematic underestimation of the effective temperature of the companion star which would lead to a systematic underestimation of the distance using method .
In using method as described above an implicit assumption about the temperature of the companion star has been made. This is due to the fact that the effective temperature of the companion star is in most cases assumed to be that of a main–sequence star of the observed spectral type. Besides a small variation in temperature with luminosity class there is also a difference in bolometric correction for stars which have the same spectral type but a different luminosity class. Comparing the observed surface gravity with that of different luminosity classes of the observed spectral type the effective temperature of the companion star can be determined. These then determine the bolometric correction, and thus the distance. However, the error in the distance from neglecting the difference in bolometric correction between the luminosity classes is small.
However, it is possible that the observed spectral types are systematically shifted to later spectral types because of effects on the lines and continuum induced by the fast rotation of the companion star. Single late type stars have rotational velocities of less than a few kilometres per second due to the onset of a magnetic–brake in stars later than typically F5 (see Kraft 1967). However, the late type companion stars in LMXBs are likely in co-rotation with the orbit. Therefore, the rotational velocities range from several tens of km s-1 for long orbital period systems (e.g. GRS 1915+105; Harlaftis & Greiner 2004) to hundred or more km s-1 for the short orbital period systems. Studies of rapidly rotating early type stars found that a fast rotation causes a slight increase in absolute magnitude of stars with spectral type later than B5 (the stars are intrinsically less luminous than the non–rotating stars of the same spectral type by typically several tenths of a magnitude; only stars up F8 were studied; Collins & Sonneborn 1977). Additionally, it is known that limb and gravity darkening effects on the line change the equivalent widths of stellar photospheric absorption lines (e.g. Shajn & Struve 1929; Collins & Sonneborn 1977).111e.g. the ratio between equivalent widths of the hydrogen lines and those of weak metallic atoms also changes among other things due to the fact that the strong hydrogen lines respond different to the rotational effects (Collins et al. 1991). Orosz et al. (2001) found that the companion star in V4641 Sgr (a.k.a. SAX J1819.3–2525) is rapidly rotating (v sin123 km s-1). In fact, for an assumed B9III spectral type observed at an inclination close to 60∘ (Orosz et al. 2001), the star is rotating at 80–90 per cent of its break–up speed (cf. Collins & Sonneborn 1977). The fact that the lines of stars with large rotational velocities are similar to the lines in stars of later spectral types (Collins & Sonneborn 1977) can explain the unusually strong Mg II line in V4641 Sgr. Bildsten & Rutledge (2000) noted that the peculiar Li abundances observed in the companion stars of several BH SXTs could also result from the fact that the companion stars are fast rotators similarly to RS CVn stars. Generally, the lines in the spectrum resemble the lines of a later spectral type star (Collins & Sonneborn 1977). However, this depends on the behaviour of the equivalent width of the used lines as a function of the effective temperature. Broadening of template star spectra in the optimal subtraction technique does not take into account these physical changes in the lines. In early type stars the decrease in luminosity of the star due to rotation is outweighed by the apparent shift in spectral type. Hence, the distance estimation method using spectra of non–rotating template stars to estimate the spectral type applied to fast rotating early type stars would likely lead to a net underestimation of the distance, the effect being bigger the later the spectral type of the star (at least up to spectral type F8).
Unfortunately, there are no detailed model atmosphere calculations showing the physical effects of rotation on the absolute magnitude and the lines of stars later than F8 available in the literature. However, effects of limb darkening are larger in late type stars than in early type stars. Furthermore, extrapolating the findings for the early type stars the spectral appearance is likely more affected than the true source luminosity meaning that the distances to the sources would be underestimated using non–rotating template stars to determine the spectral type.
2.3.3 Systematics in the interstellar absorption estimates
If the interstellar extinction, , is systematically overestimated this would yield an underestimate of the distance or vice versa since . The interstellar extinction caused by scattering of light off dust grains is traced by the optical/UV spectrum (through E(B–V) and/or the strength of the absorption feature at 2175Å). Spectral fits to the X–ray data trace interstellar absorption caused by neutral hydrogen and absorption (above 0.5 keV) by K/L–shell electrons of mostly O and Fe (Predehl & Schmitt 1995). Finally, interstellar absorption lines from ions such as Na I and Ca II trace low–ionisation interstellar gas (Sembach & Danks 1994). Over the years relations between and these different sources of interstellar extinction have been established. E.g. Predehl & Schmitt (1995) reported a relation between and . Rieke & Lebofsky (1985) give a relation between and (, with R3.1). Herbig (1995) gives relations between the equivalent widths of the Na I and Ca II absorption lines and . However, the line–depth of some absorption lines saturates quickly leading to an overestimate of the distance. Furthermore, for systems out of the Galactic plane the equivalent width of the interstellar absorption features does not increase much with distance once the system has a z–distance larger than the scale–height of the interstellar material (e.g. the scale–height of Ca II is approximately 800 pc whereas that of Na I is approximately 400–500 pc; Sembach & Danks 1994).
In addition, determining from the observed or from the observed equivalent width of interstellar absorption lines one implicitly assumes that the sight–line for the SXT under investigation has the same gas–to–dust ratio (i.e. /) as the sight–lines for which the relations between and or between the equivalent widths of the Na I and Ca II absorption lines and have been established. It is known that this is not always the case; e.g. the sight–line towards the Gould belt (i.e. Orion, Ophiuchus, and Perseus; Burstein & Heiles 1978) has a low gas–to–dust ratio. Similarly, the sight–line towards the Galactic Centre, where most LMXBs are located, has, in general, a low R (R3.1; Udalski 2003). This caveat has to be kept in mind.
In Table 3 we show the as derived from optical/UV and X–ray data. As was found before (e.g. Vrtilek et al. 1991), the extinction derived using X–ray data is systematically larger than that based on optical/UV data. There are two possible reasons for this. Predehl & Schmitt (1995) used the values derived from fitting an absorbed power–law model to ROSAT X–ray data. Using an absorbed Bremsstrahlung or a black body model to fit the data gave systematically lower values for . However, in the estimates in Table 3 in most cases a power–law model has been used as well.
Another possibility is that local absorbing material is present during outbursts. Since most of the X–ray observations which are sensitive enough to determine are done during outburst this could lead to a systematic overestimation of . The fact that for XTE J1859+226 the value derived from X–ray spectral fits is higher than that derived using the UV data even though both the HST UV and the BeppoSAX X–ray observations were made during outburst can be explained by the fact that the UV and X–ray observations are sensitive to different sources of interstellar extinction. If the extra absorbing material is indeed local to the source, the temperature may be too high for dust to form, on the other hand neutral hydrogen may well be present explaining the difference in derived . This all suggests that the derived from from X–ray spectral fitting, systematically provides an overestimate for . Hence, their use would yield an underestimation of the distance.
In all BH distance estimates in the literature the derived using optical or UV data has been used, except in case of XTE J1550–564, H 1705–25, and GS 2000+25. The diffuse interstellar bands (DIBs) used by Sánchez-Fernández et al. (1999) to estimate the for XTE J1550–564 do not suffer from saturation at relatively low values of . Given the fact that the factor with which the distance to the source changes goes as , the distance to XTE J1550–564 may have been underestimated by a factor 3! Although, as explained above, the sight–line could have properties different from the properties of the sight–line used in deriving the relation between the and the equivalent width of the DIB leading to an anomalous low as derived from the DIB. In case of GS 2000+25 an of 4.4 has been used. However, since the optically derived value for for GS 2000+25 does not seem to be very accurate (it has been determined assuming the intrinsic B-V colour of the source during outburst is 0) it is unclear whether this is an overestimation or not. Unfortunately, it is not possible to estimate whether the distance to H 1705–225 is over or underestimated since there is no optically derived available.
| Name | optical | X–ray | Refs |
|---|---|---|---|
| Opt – X–ray | |||
| GRO J0422+32 | 0.6–1.2a | 2.8 | [1] – [2] |
| 1A 0620–00 | 1.09–1.24 | 1.30.7 | [3,4] – [5] |
| GS 1009–45 | 0.60.2 | X | [6] – [X] |
| XTE J1118+480 | X | 0.0410.004d | [X] – [7] |
| GS 1124–684 | 0.90.1 | 1.280.06 | [8] – [9] |
| 4U 1543–47 | 1.550.15 | 2.40.1 | [10] – [11] |
| XTE J1550–564 | 2.5e | 4.881.15 | [12] – [13] |
| GRO J1655–40 | 3.70.3 | 4.82.8 | [14] – [5] |
| GX 339–4 | 2.8 | 3.90.5 | [15] – [16] |
| H 1705–250 | X | 1.70.5 | [X] – [17] |
| SAX J1819.3–2525 | 1.00.3b | X | [18] – [X] |
| XTE J1859+226 | 1.800.37 | 4.47c | [19] – [20] |
| GS 2000+25 | 3.5b | 6.41.0 | [21] – [22] |
| GS 2023+338 | 3.3–4.0 | 3.90.4 | [23,24] – [5] |
a see the discussion and references in Beekman et al. (1997)
b the uncertainty is large since the value is derived assuming
c no error bars given
d from EUVE observations
e Sánchez-Fernández et al. (1999) report 2.20.3. We
prefer the value derived using the DIB since the Na D line may have
been saturated.
References: [1] Beekman et al. 1997; [2]
Sunyaev et al. 1993; [3] Oke & Greenstein 1977; [4]
Wu et al. 1983 [5] Kong et al. 2002; [6]
della Valle et al. 1997; [7] Hynes et al. 2000; [8]
Cheng et al. 1992; [9] Greiner et al. 1994; [10]
Orosz et al. 1998; [11] van der Woerd et al. 1989; [12]
Sánchez-Fernández et al. 1999; [13] Tomsick et al. 2001; [14]
Hynes et al. 1998; [15] Hynes et al. (2004); [16]
Gallo et al. 2003; [17] Griffiths et al. 1978; [18]
Orosz et al. 2001; [19] Hynes et al. 2002; [20]
dal Fiume et al. 1999; [21] Chevalier & Ilovaisky 1990b; [22]
Tsunemi et al. 1989; [23] Wagner et al. 1991; [24]
Casares et al. 1993
2.3.4 Systematics in the radius expansion burst method
It has been suggested that the burst flux could be anisotropic (Kuulkers et al. 2002). However, given the good agreement between the Globular Cluster distances and the distances to the LMXBs in these Globular Clusters derived from the photospheric radius expansion burst properties (Kuulkers et al. 2003) that seems unlikely. Furthermore, Galloway et al. (2003) showed that considering the burst peak fluxes of 61 photospheric radius expansion bursts in the atoll source 4U 1728–34 the degree of anisotropy in the burst emission in less than 2 per cent.
Two out of the eight neutron star systems studied by Kuulkers et al. (2003) have a photospheric radius expansion peak burst luminosity that is lower than that of the other six. This lower peak luminosity is consistent with the Eddington luminosity limit for hydrogen rather then helium–rich material for a neutron star mass of 1.4 M⊙. So, for some of the neutron star systems in our list we could have overestimated the distance by a factor . If we take a 1:4 ratio as was found by Kuulkers et al. 2003 this would affect 8 systems in our sample. As was noted by Kuulkers et al. (2003) the two sources whose peak luminosity is consistent with hydrogen accretion have an orbital period characteristic for normal LMXBs, rather than ultra–compact X–ray binaries with periods less than 1 hour (which necessarily accrete hydrogen poor material e.g. Verbunt & van den Heuvel 1995). Because the fraction of ultra–compact X–ray binaries in Globular Clusters might be higher than in the field, the ratio between the number of sources with a hydrogen–rich, low Eddington burst luminosity and the number of sources with a helium–rich, high Eddington burst luminosity could be higher. It is unlikely, however, that the distances to all neutron star LMXBs in our sample have been overestimated. E.g. in the long period LMXBs KS 1731–26 and 4U 1636–53 the photospheric radius expansion burst was consistent with a helium–rich explosion (Muno et al. 2000, Sugimoto et al. 1984, respectively, see also Cumming & Bildsten 2000).
3 Implications and discussion
Using the data set compiled above, leaving the distances derived using method as they are, keeping the discrepancy in the distance estimate between method and the radius expansion burst method in mind, we investigate the Galactic distribution of neutron star and BH LMXBs and the peak luminosity of BHs.
3.1 Galactic distribution of LMXBs
van Paradijs & White (1995) investigated the Galactic z–distribution of neutron star LMXBs and concluded that neutron stars should receive an asymmetric kick at birth from the fact that the rms value of the z–distribution was kpc. We obtain an rms z–values of 1025 pc and 1125 pc for persistent and transient neutron star LMXBs, respectively (we round rms z–values to the nearest 25 pc). In this we have excluded XTE J2123–058 since with a z–value of -12.4 kpc it would dominate the outcome and Casares et al. (2002) show that the systemic velocity is consistent with it being a halo source. It can be argued on the basis of the large z values that Cyg X–2 and EXO 0748–676 are also halo sources although this is much less clear. E.g. Kolb et al. (2000) argue that if Cyg X–2 is at a distance of 11.6 kpc it could have originated in the Galactic plane. However, when we also exclude Cyg X–2 and EXO 0748–676 we find an rms z–value for the persistent and transient neutron star LMXBs of 700 pc and 850 pc, respectively. van Paradijs & White (1995) found an rms–z value of 500 pc when they excluded Cyg X–2 and EXO 0748–676 from their sample. Since we have used 3.8 erg s-1 for the Eddington luminosity for the radius expansion peak luminosity for all neutron stars, the rms z–value we derived for neutron star LMXBs corresponds to an upper limit. If we use 2.0 erg s-1 as the photospheric radius expansion peak burst luminosity we find an rms z–value of 775 pc and 850 pc for persistent and transient neutron star LMXBs, respectively (here we only excluded XTE J2123–085, if we also exclude Cyg X–2 and EXO 0748–676 we find 550 and 650 pc for persistent and transient neutron star LMXBs, respectively). I.e. our findings confirm the result of van Paradijs & White (1995).
In a follow–up paper, White & van Paradijs (1996) investigated the differences between the rms values of the neutron star and BH LMXBs z–distributions. They found that the rms value for the BHs was substantially lower than that of the neutron star z–distribution (more than a factor 2). Using the distances of the BHs given in Table 1 we now find an rms–value of 625 pc (we took a distance of 2.5 kpc for GRO J0422+32; we excluded the likely halo object XTE J1118+480; Wagner et al. 2001 [although note that some of the evidence leading to the suggestion that XTE J1118+480 is a halo object was based on the low rms z–value White & van Paradijs 1996 found for BH LMXBs]), i.e. close to the upper limit we find for the neutron star systems. Increasing the distance of XTE J1550–564 with a factor 3 does not significantly increase the rms value of the BH population. The main reason for the difference between the findings of White & van Paradijs (1996) and our findings is that the distance estimates for most BHs have gone up. The conclusion drawn by White & van Paradijs (1996) that BHs receive a significantly smaller kick than neutron stars is no longer tenable.
We plotted the z values for transient and persistent neutron star LMXBs (open diamonds and squares, respectively) and BHs (black dots) using the distances from Table 1 and 2 as a function of their projected distance to the Galactic Centre in Figure 2. It is interesting that the rms value for the projected distance to the Galactic Centre for the neutron stars and BH is 4.8 kpc and 7.0 kpc, respectively (excluding the [likely] halo sources). Because the Galactic potential in the z–direction decreases with increasing Galactocentric radius (e.g. Carlberg & Innanen 1987) the larger scale height of BHs can partly be due to this effect, rather than a kick velocity. E.g. for neutron star systems van Paradijs & White (1995) estimate an rms value of the z–distribution near the Sun of 650 pc. Furthermore, the symmetric kick velocity (imparted due to mass loss in the supernova) scales with the companion mass and the mass lost in the supernova (e.g. Nelemans et al. 1999) both can be (much) larger in the case of BH systems, but it scales inversely with the total mass of the remaining binary. Lastly, for large asymmetric kick velocities the binary is more likely disrupted in case of a neutron star than a BH. A detailed investigation of all the possible explanations for the high rms value for the BHs is needed in order to draw firm conclusions and we defer this to a later paper.

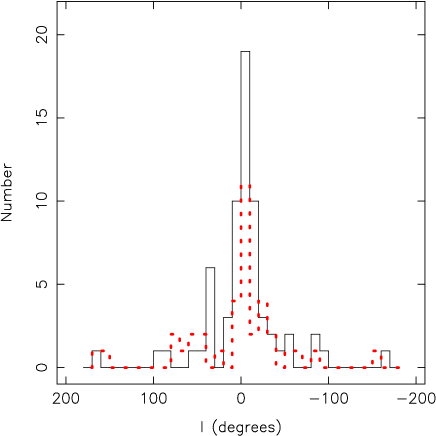
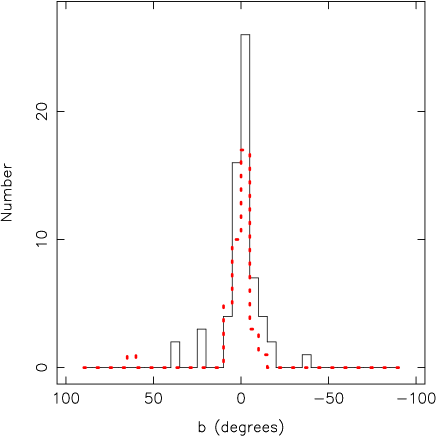
After White & van Paradijs (1996) we also compare the distribution of the l and b coordinates of the neutron star and BH LMXBs. We first compare the l and b coordinates of neutron star LMXBs in Table 2 with those of the BHs listed in Table 1. A K–S test shows that the probability that the distributions are the same is 18 per cent for the l coordinate and 52 per cent for the b coordinate (the K–S D–value is 0.33 and 0.24, respectively. Here and below: the effective number of data point is always larger than 10 so that the probabilities we quote are quite accurate, cf. Press et al. 1992). To investigate this further and to minimise selection effects, we plot the l and b coordinates of all neutron star systems, e.g. systems where a burst was found, and pulsars listed in Liu et al. (2001) (solid line histogram in Figure 3). We compare this with the BH sources listed in Table 1 and the BH candidates for which no mass estimate based on a radial velocity study exist (systems in table 3 in McClintock & Remillard 2004; the dashed line histogram in Figure 3). A one–dimensional K–S test shows that the probability that the neutron star and BH distributions in l are drawn from the same distribution is 37 per cent whereas the probability that b values are drawn from the same distribution is 90 per cent (the K–S D–value is 0.19 and 0.12, respectively). Hence, using a larger sample of neutron stars and BHs makes the probability that the neutron star and BH distributions are the same larger. The probabilities we derive are higher than those derived by White & van Paradijs (1996); a difference we attribute to the fact that White & van Paradijs (1996) had fewer BH systems in their study. We conclude that there is no evidence for a difference in the l and b distributions of neutron star and BH LMXBs.
Interestingly, there seems to be an excess of 12 out of a total of 22 BH and an excess of 19 out of a total of 45 neutron star systems with -30 over systems with 0. There is an excess of 5 out of 35 BH and 13 out of 53 neutron star systems with -10 and 0 (see Figure 3). The expected mean number of systems with a positive/negative l of a symmetric distribution around l=0∘ is , with the total number of systems. The variance on this number is . Comparing this with the observed number of systems yields significances of the observed asymmetries of 2.8 for the neutron star distribution in l, 3.0 for the BH distribution in l, and 3.8 for the combined neutron star and BH distribution in l. The combined significance for the neutron star and BH distribution in b is 1.9 only, so we do not discuss this apparent asymmetry in b further.
The asymmetry in the l–distribution is not an obvious observational selection effect. For instance, the BeppoSAX WFC monitoring the Galactic Centre region had a field–of–view of centred on the Galactic Centre (in’t Zand 2001). The dust maps from Schlegel et al. (1998) do not show a large dust asymmetry around the Galactic Centre. It seems that the neutron star and BH LMXB distribution in l is symmetric around l=-5∘. Possibly this asymmetry is related to the bar structure in the inner part of our Galaxy. It is known that the bar causes asymmetries in the stellar and gas distributions around (l,b) = (0,0) (e.g. see the recent review by Merrifield 2004). Furthermore, Gilfanov (2004) found that the distribution of LMXBs follows the stellar mass distribution, and hence not the spiral arm structure.
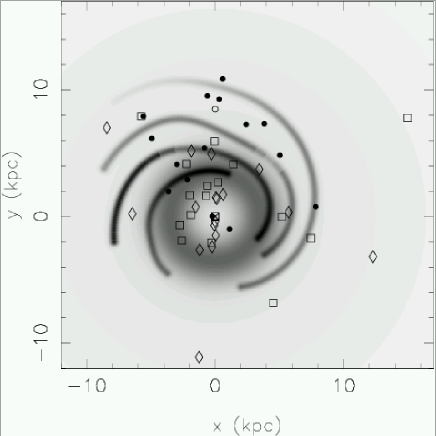
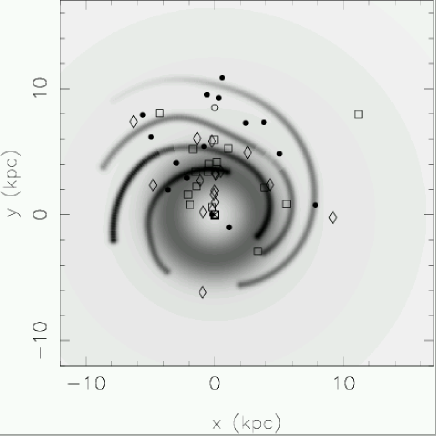
Using the distances listed in Table 1 and 2 we also plot in Figure 4 the Galactic x–y distribution of the neutron stars for which a photospheric radius expansion burst was observed and the BHs for which a dynamical mass estimate has been derived. The Galactic spiral arm structure according to the model described in Taylor & Cordes (1993) has been overplotted. It is clear that few LMXBs at the other side of the Galactic Centre have been detected, especially if the Eddington limit for hydrogen rich material for a 1.4 M⊙ neutron star is applicable to the peak burst flux of most photospheric radius expansion bursts (see also Grimm et al. 2002). There also seems to be a paucity of nearby neutron star LXMBs (this was also noted by Verbunt 2001). In order to try to quantify this we performed a two dimensional Kolmogorov–Smirnov (K–S) test (Press et al. 1992) to test whether the neutron star and BH populations are the same. The K–S test gives a D of 0.45 and a probability that the two populations are the same of 3.8 per cent. If we decrease the distance of all neutron star systems by a factor the probability that the distributions are the same increases only slightly to 5.2 per cent (D=0.44). It is possible that the discrepancy in the spatial distribution of the neutron stars and BHs is a selection effect. Since we only included BHs for which a mass limit larger than 3 has been derived, the optical counterpart must have been detected in quiescence, hence this favours nearby systems.
3.2 The black hole outburst peak luminosity
The BH distances are important for the maximum observed BH luminosity. We found a somewhat larger distance for V404 Cyg than often used previously. Shahbaz et al. (1994b) found an upper limit on the distance of V404 Cyg of 3.7 kpc assuming the peak outburst source luminosity was Eddington limited taking their 90 per cent confidence upper limit to the mass of the BH of 15 M⊙. The distance of 4.0 kpc we find shows that the maximum observed luminosity exceeds the Eddington luminosity for a 10 M⊙ BH (the limit often quoted to decide whether a source is a ULX or not). The distance derived for XTE J1550–564 may have been underestimated by as much as a factor 3: its distance could be as large as 3 kpc, although the uncertainties are large. For this distance the outburst peak luminosity in the 2–20 keV band alone would be 7 erg cm-2 s-1 (taking the flux from Sobczak et al. 1999). For 4U 1543–47, SAX J1819.3–2525 and GRS 1915+105, systems for which the distance was determined by method , , and , respectively, it was noticed earlier that the outburst peak luminosities are super–Eddington for the best–fit BH masses (cf. Revnivtsev et al. 2002; McClintock & Remillard 2004). Garcia et al. (2003) show that the peak outburst of GRO J1009–45 most likely also exceeded the Eddington luminosity for a for BH (even if the distance is 5.7 instead of the 9 kpc they favoured). It seems therefore likely that there are several sources in our own Galaxy which we would classify as transient ULXs had we observed them in other Galaxies. For these sources a mass determination has shown that they are not intermediate mass BHs but rather 5–15 M⊙ BHs. Furthermore, the fact that LMXB sources (an old population) seem to be capable of producing super–Eddington luminosities could also help explain the presence of ULXs in elliptical Galaxies. Assuming that most ULXs are stellar mass BHs the fact that many ULXs are found a few arc seconds away from the young stellar clusters could be caused by kick velocities received at BH formation.
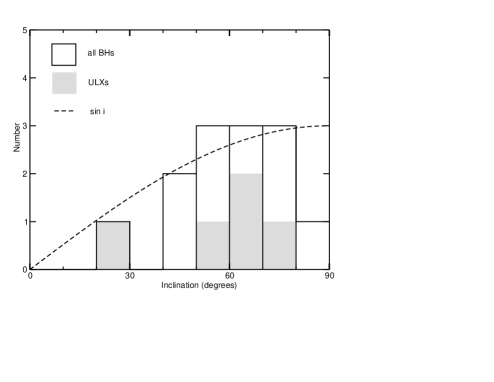
If super–Eddington luminosities were to be explained by effects of “mild–beaming” (cf. King et al. 2001) then one would naively expect the inclinations of the sources with the highest luminosities to be lowest. In Figure 5 we plot the inclination distribution for 13 BH SXTs in Figure 5 (the inclinations for GX 339–4 and XTE J1859+226 are not well known and those sources have therefore not been included; inclinations from Orosz 2003). Although the amount of sources is low we see that the inclination distribution of the BH ULX sources is not skewed to low inclinations but instead clusters around the fiducial 60∘ point. We did not include XTE J1550–564 () and GRO J0422+32 () as ULXs.
4 Conclusions
We studied the distance estimates for BH SXTs in detail. We note that the uncertainties in the distance estimates due to e.g. uncertainties in the spectral type (i.e. temperature) of the companion star are probably large. Comparing the distances derived for the neutron stars Cyg X–2 and XTE J2123–058 using the distance estimation method , which is used for most BH SXTs, with the photospheric radius expansion burst method, we find that the latter gives larger distances. This could mean that for some reason method systematically underestimates the distance. Possibly this is related to an erroneous spectral classification of the companion star caused by its fast rotation. If this is indeed the case this would have important consequences for the reported difference in quiescent X–ray luminosities of BH and neutron star SXTs, for the BH SXT peak outburst luminosities, for the BH masses, and for the Galactic distribution of BH LMXBs. We find that the distance towards XTE J1550–564 may have been underestimated by as much as a factor 3 because the interstellar extinction could have been overestimated in that case. As was noticed before, several BH SXTs observed in our Galaxy would be classified as ULXs had we observed them in another Galaxy (at least 5 but perhaps even 7 out of the 15 dynamically confirmed BH SXTs). This suggests that many (transient) ULXs in other Galaxies could well be stellar mass BHs. A re–evaluation of the distance to the Galactic plane of neutron star and BH LMXBs shows that there is no longer evidence for a smaller rms–value of the z–distribution for BH systems. Such a difference had been interpreted as evidence for the absence of asymmetric kicks during BH formation. However, before firm conclusions can be drawn about the similarities or differences between neutron stars and BH kicks the details of the formation and Galactic distribution have to be investigated. Finally, we found that the l distribution of Galactic LMXBs is asymmetric around l=0∘.
Acknowledgments
Support for this work was provided by NASA through Chandra Postdoctoral Fellowship grant number PF3–40027 awarded by the Chandra X–ray Center, which is operated by the Smithsonian Astrophysical Observatory for NASA under contract NAS8–39073. GN is supported by PPARC. The authors would like to thank the referee for his/her valuable comments which helped improve the manuscript considerably. We would like to thank Hans–Jakob Grimm, Jeff McClintock, Jim Pringle, and Frank Verbunt for useful discussions and Duncan Galloway for sharing results before publication. This research made use of results provided by the ASM/RXTE teams at MIT and at the RXTE SOF and GOF at NASA’s GSFC. The research has made extensive use of NASA’s Astrophysics Data System.
References
- Bailey (1981) Bailey, J., 1981, MNRAS, 197, 31
- Barnes & Evans (1976) Barnes, T. G., Evans, D. S., 1976, MNRAS, 174, 489
- Barret et al. (1996) Barret, D., McClintock, J. E., Grindlay, J. E., 1996, ApJ, 473, 963
- Barret et al. (2000) Barret, D., Olive, J. F., Boirin, L., Done, C., Skinner, G. K., Grindlay, J. E., 2000, ApJ, 533, 329
- Basinska et al. (1984) Basinska, E. M., Lewin, W. H. G., Sztajno, M., Cominsky, L. R., Marshall, F. J., 1984, ApJ, 281, 337
- Beals & Oke (1953) Beals, C. S., Oke, J. B., 1953, MNRAS, 113, 530
- Beekman et al. (1997) Beekman, G., Shahbaz, T., Naylor, T., Charles, P. A., Wagner, R. M., Martini, P., 1997, MNRAS, 290, 303
- Begelman (2002) Begelman, M. C., 2002, ApJ, 568, L97
- Bildsten & Rutledge (2000) Bildsten, L., Rutledge, R. E., 2000, ApJ, 541, 908
- Bradshaw et al. (1999) Bradshaw, C. F., Fomalont, E. B., Geldzahler, B. J., 1999, ApJ, 512, L121
- Brandt et al. (1996) Brandt, W. N., Fabian, A. C., Dotani, T., Nagase, F., Inoue, H., Kotani, T., Segawa, Y., 1996, MNRAS, 283, 1071
- Burstein & Heiles (1978) Burstein, D., Heiles, C., 1978, ApJ, 225, 40
- Buxton & Vennes (2003) Buxton, M., Vennes, S., 2003, MNRAS, 342, 105
- Callanan et al. (1996) Callanan, P. J., Garcia, M. R., Filippenko, A. V., McLean, I., Teplitz, H., 1996, ApJ, 470, L57
- Carlberg & Innanen (1987) Carlberg, R. G., Innanen, K. A., 1987, AJ, 94, 666
- Casares et al. (1992) Casares, J., Charles, P. A., Naylor, T., 1992, Nat, 355, 614
- Casares et al. (1993) Casares, J., Charles, P. A., Naylor, T., Pavlenko, E. P., 1993, MNRAS, 265, 834
- Casares et al. (1998) Casares, J., Charles, P. A., Kuulkers, E., 1998, ApJ, 493, L39
- Casares et al. (2002) Casares, J., Dubus, G., Shahbaz, T., Zurita, C., Charles, P. A., 2002, MNRAS, 329, 29
- Cheng et al. (1992) Cheng, F. H., Horne, K., Panagia, N., Shrader, C. R., Gilmozzi, R., Paresce, F., Lund, N., 1992, ApJ, 397, 664
- Chevalier & Ilovaisky (1990a) Chevalier, C., Ilovaisky, S. A., 1990a, A&A, 228, 115
- Chevalier & Ilovaisky (1990b) Chevalier, C., Ilovaisky, S. A., 1990b, A&A, 238, 163
- Cocchi et al. (1999) Cocchi, M., Bazzano, A., Natalucci, L., Ubertini, P., Heise, J., Muller, J. M., in ’t Zand, J. J. M., 1999, A&A, 346, L45
- Cocchi et al. (2000) Cocchi, M., Bazzano, A., Natalucci, L., Ubertini, P., Heise, J., Kuulkers, E., Muller, J. M., in’t Zand, J. J. M., 2000, A&A, 357, 527
- Cocchi et al. (2001a) Cocchi, M., Bazzano, A., Natalucci, L., Ubertini, P., Heise, J., in’t Zand, J. J. M., 2001a, Memorie della Societa Astronomica Italiana, 72, 757
- Cocchi et al. (2001b) Cocchi, M., Bazzano, A., Natalucci, L., Ubertini, P., Heise, J., Kuulkers, E., Cornelisse, R., in’t Zand, J. J. M., 2001b, A&A, 378, L37
- Colbert & Mushotzky (1999) Colbert, E. J. M., Mushotzky, R. F., 1999, ApJ, 519, 89
- Collins & Sonneborn (1977) Collins, G. W., Sonneborn, G. H., 1977, ApJS, 34, 41
- Collins et al. (1991) Collins, G. W., Truax, R. J., Cranmer, S. R., 1991, ApJS, 77, 541
- Cornelisse et al. (2002) Cornelisse, R., et al., 2002, A&A, 392, 885
- Cowley et al. (1987) Cowley, A. P., Crampton, D., Hutchings, J. B., 1987, AJ, 93, 195
- Cox (2000) Cox, A. N., 2000, Allen’s astrophysical quantities, 4th ed. New York: AIP Press; Springer, 2000. Edited by Arthur N. Cox. ISBN: 0387987460
- Cumming & Bildsten (2000) Cumming, A., Bildsten, L., 2000, ApJ, 544, 453
- dal Fiume et al. (1999) dal Fiume, D., et al., 1999, in International Astronomical Union Circular, p. 7291
- della Valle et al. (1997) della Valle, M., Benetti, S., Cappellaro, E., Wheeler, C., 1997, A&A, 318, 179
- Eaton & Poe (1984) Eaton, J. A., Poe, C. H., 1984, Acta Astronomica, 34, 97
- Esin et al. (1997) Esin, A. A., McClintock, J. E., Narayan, R., 1997, ApJ, 489, 865
- Fabbiano (1989) Fabbiano, G., 1989, ARA&A, 27, 87
- Fabbiano (1995) Fabbiano, G., 1995, Normal galaxies and their X-ray binary population, X-ray Binaries, eds. W.H.G. Lewin, J. van Paradijs, and E.P.J. van den Heuvel (Cambridge: Cambridge Univ. Press), p. 58, p. 390
- Fender et al. (1999) Fender, R. P., Garrington, S. T., McKay, D. J., Muxlow, T. W. B., Pooley, G. G., Spencer, R. E., Stirling, A. M., Waltman, E. B., 1999, MNRAS, 304, 865
- Filippenko & Chornock (2001) Filippenko, A. V., Chornock, R., 2001, in International Astronomical Union Circular, p. 2
- Filippenko et al. (1999) Filippenko, A. V., Leonard, D. C., Matheson, T., Li, W., Moran, E. C., Riess, A. G., 1999, PASP, 111, 969
- Fujimoto et al. (1988) Fujimoto, M. Y., Sztajno, M., Lewin, W. H. G., van Paradijs, J., 1988, A&A, 199, L9
- Gallo et al. (2003) Gallo, E., Fender, R., Corbel, S., 2003, The Astronomer’s Telegram, 196, 1
- Galloway et al. (2001) Galloway, D. K., Chakrabarty, D., Muno, M. P., Savov, P., 2001, ApJ, 549, L85
- Galloway et al. (2003) Galloway, D. K., Psaltis, D., Chakrabarty, D., Muno, M. P., 2003, ApJ, 590, 999
- Garcia et al. (2003) Garcia, M. R., Miller, J. M., McClintock, J. E., King, A. R., Orosz, J., 2003, ApJ, 591, 388
- Gelino & Harrison (2003) Gelino, D. M., Harrison, T. E., 2003, ApJ, 599, 1254
- Gelino et al. (2001) Gelino, D. M., Harrison, T. E., McNamara, B. J., 2001, AJ, 122, 971
- Gilfanov (2004) Gilfanov, M., 2004, MNRAS, 349, 146
- Gottwald et al. (1986) Gottwald, M., Haberl, F., Parmar, A. N., White, N. E., 1986, ApJ, 308, 213
- Greiner et al. (1994) Greiner, J., Hasinger, G., Molendi, S., Ebisawa, K., 1994, A&A, 285, 509
- Greiner et al. (2001) Greiner, J., Cuby, J. G., McCaughrean, M. J., 2001, Nat, 414, 522
- Griffiths et al. (1978) Griffiths, R. E., et al., 1978, ApJ, 221, L63
- Grimm et al. (2002) Grimm, H.-J., Gilfanov, M., Sunyaev, R., 2002, A&A, 391, 923
- Harlaftis et al. (1999) Harlaftis, E., Collier, S., Horne, K., Filippenko, A. V., 1999, A&A, 341, 491
- Harlaftis & Greiner (2004) Harlaftis, E. T., Greiner, J., 2004, A&A, 414, L13
- Harlaftis et al. (1996) Harlaftis, E. T., Horne, K., Filippenko, A. V., 1996, PASP, 108, 762
- Harlaftis et al. (1997) Harlaftis, E. T., Steeghs, D., Horne, K., Filippenko, A. V., 1997, AJ, 114, 1170
- Herbig (1995) Herbig, G. H., 1995, ARA&A, 33, 19
- Hjellming & Rupen (1995) Hjellming, R. M., Rupen, M. P., 1995, Nat, 375, 464
- Hoffman et al. (1980) Hoffman, J. A., Cominsky, L., Lewin, W. H. G., 1980, ApJ, 240, L27
- Homan et al. (1999) Homan, J., Méndez, M., Wijnands, R., van der Klis, M., van Paradijs, J., 1999, ApJ, 513, L119
- Hynes et al. (2000) Hynes, R. I., Mauche, C. W., Haswell, C. A., Shrader, C. R., Cui, W., Chaty, S., 2000, ApJ, 539, L37
- Hynes et al. (2002) Hynes, R. I., Haswell, C. A., Chaty, S., Shrader, C. R., Cui, W., 2002, MNRAS, 331, 169
- Hynes et al. (2004) Hynes, R. I., Steeghs, D., Casares, J., Charles, P. A., O’Brien, K., 2004, ApJ
- Hynes et al. (1998) Hynes, R. I., et al., 1998, MNRAS, 300, 64
- in’t Zand (2001) in’t Zand, J., 2001, in Exploring the gamma-ray universe. Proceedings of the Fourth INTEGRAL Workshop, 4-8 September 2000, Alicante, Spain. Editor: B. Battrick, Scientific editors: A. Gimenez, V. Reglero & C. Winkler. ESA SP-459, Noordwijk: ESA Publications Division, ISBN 92-9092-677-5, 2001, 459, 463
- in’t Zand et al. (2001) in’t Zand, J. J. M., et al., 2001, A&A, 372, 916
- Jonker et al. (2004) Jonker, P. G., Gallo, E., Dhawan, V., Rupen, M., Fender, R. P., Dubus, G., 2004, MNRAS, in press
- Jonker et al. (2001) Jonker, P. G., et al., 2001, ApJ, 553, 335
- Kaaret et al. (2002) Kaaret, P., Zand, J. J. M. i., Heise, J., Tomsick, J. A., 2002, ApJ, 575, 1018
- Kalogera & Baym (1996) Kalogera, V., Baym, G., 1996, ApJ, 470, L61
- Kaptein et al. (2000) Kaptein, R. G., in’t Zand, J. J. M., Kuulkers, E., Verbunt, F., Heise, J., Cornelisse, R., 2000, A&A, 358, L71
- King (1993) King, A. R., 1993, MNRAS, 260, L5
- King et al. (2001) King, A. R., Davies, M. B., Ward, M. J., Fabbiano, G., Elvis, M., 2001, ApJ, 552, L109
- Kirkpatrick et al. (1993) Kirkpatrick, J. D., Kelly, D. M., Rieke, G. H., Liebert, J., Allard, F., Wehrse, R., 1993, ApJ, 402, 643
- Kolb et al. (2000) Kolb, U., Davies, M. B., King, A., Ritter, H., 2000, MNRAS, 317, 438
- Kong et al. (2002) Kong, A. K. H., McClintock, J. E., Garcia, M. R., Murray, S. S., Barret, D., 2002, ApJ, 570, 277
- Kraft (1967) Kraft, R. P., 1967, ApJ, 150, 551
- Kuulkers & van der Klis (2000) Kuulkers, E., van der Klis, M., 2000, A&A, 356, L45
- Kuulkers et al. (2002) Kuulkers, E., Homan, J., van der Klis, M., Lewin, W. H. G., Méndez, M., 2002, A&A, 382, 947
- Kuulkers et al. (2003) Kuulkers, E., den Hartog, P. R., in’t Zand, J. J. M., Verbunt, F. W. M., Harris, W. E., Cocchi, M., 2003, A&A, 399, 663
- Liu et al. (2001) Liu, Q. Z., van Paradijs, J., van den Heuvel, E. P. J., 2001, A&A, 368, 1021
- Maccarone (2003) Maccarone, T. J., 2003, A&A, 409, 697
- Marsh et al. (1994) Marsh, T. R., Robinson, E. L., Wood, J. H., 1994, MNRAS, 266, 137
- McClintock & Remillard (2004) McClintock, J. E., Remillard, R. A., 2004, in X-ray binaries, Cambridge Astrophysics Series, Cambridge, MA: Cambridge University Press, c1995, edited by Lewin, Walter H.G.; Van Paradijs, Jan; Van den Heuvel, Edward P.J.
- McClintock et al. (2001) McClintock, J. E., Garcia, M. R., Caldwell, N., Falco, E. E., Garnavich, P. M., Zhao, P., 2001, ApJ, 551, L147
- Merrifield (2004) Merrifield, M. R., 2004, in Milky Way Surveys: The structure and evolution of our Galxy: ASP conference series eds. Dan Clemens, Tereasa Brainerd, and Ronak Shah
- Mirabel & Rodriguez (1994) Mirabel, I. F., Rodriguez, L. F., 1994, Nat, 371, 46
- Muno et al. (2000) Muno, M. P., Fox, D. W., Morgan, E. H., Bildsten, L., 2000, ApJ, 542, 1016
- Muno et al. (2001) Muno, M. P., Chakrabarty, D., Galloway, D. K., Savov, P., 2001, ApJ, 553, L157
- Murakami et al. (1987) Murakami, T., Inoue, H., Makishima, K., Hoshi, R., 1987, PASJ, 39, 879
- Natalucci et al. (2000a) Natalucci, L., Bazzano, A., Cocchi, M., Ubertini, P., Heise, J., Kuulkers, E., in ’t Zand, J. J. M., Smith, M. J. S., 2000a, ApJ, 536, 891
- Natalucci et al. (2000b) Natalucci, L., Bazzano, A., Cocchi, M., Ubertini, P., Heise, J., Kuulkers, E., in’t Zand, J. J. M., 2000b, ApJ, 543, L73
- Nelemans et al. (1999) Nelemans, G., Tauris, T. M., van den Heuvel, E. P. J., 1999, A&A, 352, L87
- Oke & Greenstein (1977) Oke, J. B., Greenstein, J. L., 1977, ApJ, 211, 872
- Orosz (2003) Orosz, J. A., 2003, IAU Symposium 212, A Massive Star Odyssey: From Main Sequence to Supernova., eds van der Hucht, K. and Herrero, A. and Esteban, C. (San Fransisco, ASP), p. 365
- Orosz & Bailyn (1997) Orosz, J. A., Bailyn, C. D., 1997, ApJ, 477, 876
- Orosz & Kuulkers (1999) Orosz, J. A., Kuulkers, E., 1999, MNRAS, 305, 132
- Orosz et al. (1996) Orosz, J. A., Bailyn, C. D., McClintock, J. E., Remillard, R. A., 1996, ApJ, 468, 380
- Orosz et al. (1998) Orosz, J. A., Jain, R. K., Bailyn, C. D., McClintock, J. E., Remillard, R. A., 1998, ApJ, 499, 375
- Orosz et al. (2002a) Orosz, J. A., Polisensky, E. J., Bailyn, C. D., Tourtellotte, S. W., McClintock, J. E., Remillard, R. A., 2002a, Bulletin of the American Astronomical Society, 34, 1124
- Orosz et al. (2001) Orosz, J. A., et al., 2001, ApJ, 555, 489
- Orosz et al. (2002b) Orosz, J. A., et al., 2002b, ApJ, 568, 845
- Paczyński (1971) Paczyński, B., 1971, ARA&A, 9, 183
- Popper (1980) Popper, D. M., 1980, ARA&A, 18, 115
- Predehl & Schmitt (1995) Predehl, P., Schmitt, J. H. M. M., 1995, A&A, 293, 889
- Press et al. (1992) Press, W. H., Teukolsky, S. A., Vetterling, W. T., Flannery, B. P., 1992, Numerical recipes in FORTRAN. The art of scientific computing, Cambridge: University Press, —c1992, 2nd ed.
- Remillard et al. (1996) Remillard, R. A., Orosz, J. A., McClintock, J. E., Bailyn, C. D., 1996, ApJ, 459, 226
- Revnivtsev et al. (2002) Revnivtsev, M., Gilfanov, M., Churazov, E., Sunyaev, R., 2002, A&A, 391, 1013
- Rhoades & Ruffini (1974) Rhoades, C. E. J., Ruffini, R., 1974, Phys. Rev. Lett, 32, 324
- Rieke & Lebofsky (1985) Rieke, G. H., Lebofsky, M. J., 1985, ApJ, 288, 618
- Sánchez-Fernández et al. (1999) Sánchez-Fernández, C., et al., 1999, A&A, 348, L9
- Schlegel et al. (1998) Schlegel, D. J., Finkbeiner, D. P., Davis, M., 1998, ApJ, 500, 525
- Sembach & Danks (1994) Sembach, K. R., Danks, A. C., 1994, A&A, 289, 539
- Shahbaz et al. (1994a) Shahbaz, T., Naylor, T., Charles, P. A., 1994a, MNRAS, 268, 756
- Shahbaz et al. (1994b) Shahbaz, T., Ringwald, F. A., Bunn, J. C., Naylor, T., Charles, P. A., Casares, J., 1994b, MNRAS, 271, L10
- Shahbaz et al. (1999) Shahbaz, T., van der Hooft, F., Casares, J., Charles, P. A., van Paradijs, J., 1999, MNRAS, 306, 89
- Shahbaz et al. (2003) Shahbaz, T., Zurita, C., Casares, J., Dubus, G., Charles, P. A., Wagner, R. M., Ryan, E., 2003, ApJ, 585, 443
- Shajn & Struve (1929) Shajn, G., Struve, O., 1929, MNRAS, 89, 222
- Smale (1998) Smale, A. P., 1998, ApJ, 498, L141
- Sobczak et al. (1999) Sobczak, G. J., McClintock, J. E., Remillard, R. A., Levine, A. M., Morgan, E. H., Bailyn, C. D., Orosz, J. A., 1999, ApJ, 517, 121
- Strohmayer et al. (2003) Strohmayer, T. E., Markwardt, C. B., Swank, J. H., in’t Zand, J., 2003, ApJ, 596, L67
- Sugimoto et al. (1984) Sugimoto, D., Ebisuzaki, T., Hanawa, T., 1984, PASJ, 36, 839
- Sunyaev et al. (1993) Sunyaev, R. A., et al., 1993, A&A, 280, L1
- Tawara et al. (1984) Tawara, Y., et al., 1984, ApJ, 276, L41
- Taylor & Cordes (1993) Taylor, J. H., Cordes, J. M., 1993, ApJ, 411, 674
- Tennant et al. (1986) Tennant, A. F., Fabian, A. C., Shafer, R. A., 1986, MNRAS, 221, 27
- Tingay et al. (1995) Tingay, S. J., et al., 1995, Nat, 374, 141
- Tomsick et al. (1999a) Tomsick, J. A., Halpern, J. P., Kemp, J., Kaaret, P., 1999a, ApJ, 521, 341
- Tomsick et al. (1999b) Tomsick, J. A., Kaaret, P., Kroeger, R. A., Remillard, R. A., 1999b, ApJ, 512, 892
- Tomsick et al. (2001) Tomsick, J. A., Corbel, S., Kaaret, P., 2001, ApJ, 563, 229
- Tomsick et al. (2004) Tomsick, J. A., Gelino, D. M., Halpern, J. P., Kaaret, P., 2004, ApJ, in press
- Tsunemi et al. (1989) Tsunemi, H., Kitamoto, S., Okamura, S., Roussel-Dupre, D., 1989, ApJ, 337, L81
- Udalski (2003) Udalski, A., 2003, ApJ, 590, 284
- van der Woerd et al. (1989) van der Woerd, H., White, N. E., Kahn, S. M., 1989, ApJ, 344, 320
- van Paradijs (1978) van Paradijs, J., 1978, Nat, 274, 650
- van Paradijs (1981) van Paradijs, J., 1981, A&A, 101, 174
- van Paradijs & White (1995) van Paradijs, J., White, N., 1995, ApJ, 447, L33
- van Paradijs et al. (1986) van Paradijs, J., van Amerongen, S., Damen, E., van der Woerd, H., 1986, A&AS, 63, 71
- Verbunt (2001) Verbunt, F., 2001, in Black Holes in Binaries and Galactic Nuclei, eds Kaper, van den Heuvel, Woudt, Springer, Berlin, p. 279
- Verbunt & van den Heuvel (1995) Verbunt, F., van den Heuvel, E., 1995, Formation andevolution of neutron stars and black holes in binaries, eds Lewin, van Paradijs, van den Heuvel, ISBN 052141684, Cambridge University Press, 1995.
- Verbunt et al. (1984) Verbunt, F., Elson, R., van Paradijs, J., 1984, MNRAS, 210, 899
- Vrtilek et al. (1991) Vrtilek, S. D., McClintock, J. E., Seward, F. D., Kahn, S. M., Wargelin, B. J., 1991, ApJS, 76, 1127
- Wade & Horne (1988) Wade, R. A., Horne, K., 1988, ApJ, 324, 411
- Wagner et al. (1991) Wagner, R. M., Bertram, R., Starrfield, S. G., Howell, S. B., Kreidl, T. J., Bus, S. J., Cassatella, A., Fried, R., 1991, ApJ, 378, 293
- Wagner et al. (1992) Wagner, R. M., Kreidl, T. J., Howell, S. B., Starrfield, S. G., 1992, ApJ, 401, L97
- Wagner et al. (2001) Wagner, R. M., Foltz, C. B., Shahbaz, T., Casares, J., Charles, P. A., Starrfield, S. G., Hewett, P., 2001, ApJ, 556, 42
- Webb et al. (2000) Webb, N. A., Naylor, T., Ioannou, Z., Charles, P. A., Shahbaz, T., 2000, MNRAS, 317, 528
- White & van Paradijs (1996) White, N. E., van Paradijs, J., 1996, ApJ, 473, L25
- Wijnands et al. (2002) Wijnands, R., Muno, M. P., Miller, J. M., Franco, L. M., Strohmayer, T., Galloway, D., Chakrabarty, D., 2002, ApJ, 566, 1060
- Wu et al. (1983) Wu, C.-C., Panek, R. J., Holm, A. V., Schmitz, M., Swank, J. H., 1983, PASP, 95, 391