Reanalysis of the spectrum of the galaxy
In a recent paper Pelló et al. reported observations of a faint galaxy, gravitationally lensed by the galaxy cluster Abell 1835. Deep J–band spectroscopy revealed a weak emission line near 1.34 microns, detected in two spectra with different central wavelengths. The line was interpreted as Ly at redshift . This interpretation is supported by the broad–band photometric spectral energy distribution, and by the location of the galaxy close to the lens critical line for this redshift. We have reanalysed the two spectra, just released from the data archive. Our analysis includes allowance for wavelength shifts due to transverse drift of the object in the slit. We do not detect a significant emission line at the reported location, or nearby, at either grating setting, nor in the combined spectrum. We provide a possible explanation for the reported detection as due to spurious positive flux introduced in the sky–subtraction stage as a result of variable hot pixels. We provide our final reduced 2D frame, and corresponding error array.
Key Words.:
galaxies: high redshift — infrared: galaxies — cosmology: observations — cosmology: early Universe1 Introduction
The new generation of telescopes and instruments have allowed astronomers to explore beyond redshift . Analysis of the spectra of the highest–redshift quasars discovered (Fan et al., 2003), indicate that we may be on the threshold of the epoch at which the intergalactic medium was reionised. The epoch of reionisation is predicted to occur over a relatively short redshift interval (Gnedin, 2000). As such it is seen as a fundamental event in cosmic history, and the study of this epoch is one of the great goals of observational cosmologists. Analysis of the WMAP one–year polarisation cross–power spectra (Kogut et al., 2003) indicates a higher redshift of reionisation than the quasar data, . This may point to a more complex history of reionisation than previously predicted. These results motivate searches for galaxies and quasars beyond , to measure the conditions in the intergalactic medium at these times. Quasars are particularly useful, because bright, but are expected to be extremely rare, requiring very ambitious surveys to find any (Warren and Hewett, 2002). The galaxy population at such high redshifts will comprise objects of low mass, and therefore low luminosity, which, coupled with the large distances, and the bright near–infrared sky, again make detection a considerable challenge. More fundamentally, the expected high optical depth of the neutral fraction of the intervening intergalactic medium could obliterate the Ly line, the principal means of redshift confirmation (Miralda–Escudé, 1998). In this context, at a time when there are no convincing spectroscopically–confirmed detections of galaxies beyond , the publication of the detection of Ly from a galaxy at by Pelló et al. (2004; hereafter P04), is of great interest.
The galaxy detected by Pelló et al., labelled , lies behind the galaxy cluster Abell 1835. The galaxy is detected in the near–infrared H and K bands, but shows a sharp drop in flux in moving into the J band, and is not detected in very deep observations in the optical R and I bands. This spectral energy distribution is consistent with models for young galaxies in the redshift interval , where the spectral break is a consequence of complete absorption blueward of redshifted Ly by neutral gas in the intergalactic medium. This interpretation is supported by the location of the galaxy close to the lens critical line for these redshifts. For these reasons Pelló et al. obtained spectra in the J band, selecting a range of central wavelengths to target Ly over the indicated redshift interval. They reported the detection of a weak emission line at wavelength m. The line appeared in two spectra, in the region of overlap of two wavelength intervals. The flux is erg s-1 cm-2 i.e. (we understand that the ‘’ quoted in the paper refers to the peak pixel (Pelló, private communication)). They identified the line as Ly at . In the published spectrum (fig. 5 in P04), comparison of the line flux with the error spectrum appears to indicate a higher significance than the quoted . Curious to understand this inconsistency, we downloaded the raw data from the ESO archive, when they became publicly available on 2 July 2004. In this paper we present a reanalysis of the two spectra. We do not detect the emission line in either spectrum. In §2 we detail the data reduction steps followed, and in §3 we present the results of analysing the reduced frames, and briefly discuss possible explanations for the discrepancy between our results and those published in P04.
2 Data Reduction
Details of the observations, obtained with the ISAAC instrument on the ESO–VLT, are provided in P04. Briefly, the data comprise 12 frames of 900s integration at the first grating setting, central wavelength m (hereafter ), and 21 frames of 900s integration at the second grating setting, central wavelength m (hereafter ). The particular region of interest for this paper is the region of overlap: the wavelength range 1.3357 - 1.3409 microns. The observations were taken over two nights; 9 frames on the first111This sequence was terminated due to worsening conditions., and 12 on the second. The data were reduced in three sets corresponding to these groupings, then the two groups at were combined. The slit width was , and the seeing to . The wavelength range of each spectrum is m, with 1024 pixels, and a spatial pixel scale of . The nominal resolving power for an object filling the slit is 3100, corresponding to approximately 7 pixels. However, for a point source, because of the good seeing, the expected line width for a spectrally unresolved line becomes 3 or 4 pixels.
Because of the moderately high dispersion, in regions between bright OH sky lines the noise in an individual frame is dominated by detector noise, and not photon noise. The detected emission line lies in such a region; therefore, our data reduction procedure aimed at maximising the signal–to–noise (S/N) of faint emission lines in regions away from bright sky lines, and did not attempt optimal subtraction of the bright sky lines themselves. Although, apparently, the data were nominally taken in the traditional sequence (Richard et al., 2003, hereafter R03) i.e. two slit positions, for processing in pairs, in fact in all three groups the object was placed at several positions along the slit: at 5 positions for two of the groups, and at 6 positions for the third group. The essence of our reduction procedure was to take advantage of this, and to achieve refined bias, dark, and sky subtraction by, for each slit position, averaging all the frames at the other slit positions, and subtracting. Relative to the usual procedure of processing the data in pairs, consideration of the propagation of errors reveals that for slit positions this procedure should reduce the noise by a factor , which gives 1.26 for . In a previous analysis of ISAAC data (Weatherley et al. 2005, MNRAS, submitted), we verified that the improvement predicted by this formula is indeed achieved.
From an analysis of dark frames we noted that the ISAAC dark varies on timescales of a single frame by a DC offset. This needs to be removed before flat–fielding, or the flat–field signature multiplied by the differential DC offset will be added into the frames. Fortunately the slit does not fully cover the array, and we used the unexposed region to monitor this variation. The third data group suffers from 50Hz pick–up noise. This was removed by a Fourier procedure, identifying the relevant wave vectors in the power spectrum, masking all other wave vectors, inverse transforming, and subtracting. In detail, then, the steps we followed were: 1. subtract notional dark; 2. removal of differential DC offset; 3. flat–field; 4. fit sky up columns; 5. create frames for residual dark+bias+sky subtraction by forming, for each slit position, the median of all the other processed frames at the other positions; 6. subtract; 7. remove pick–up noise; 8. refit sky up columns. This procedure will work well if two conditions are satisfied: the dark pattern (modulo a DC offset) is fairly stable over each group, and the error in the flat–field multiplied by the variation in the sky level, is small relative to the detector noise.
At this point the ISAAC data–reduction manual recommends wavelength calibration of the 2D frames. In one sense this is essential, in order to register the frames, because the sky lines are curved – meaning that for a given spatial shift, the required spectral shift varies with position over the frame. Wavelength calibration involves rebinning, which has the unfortunate consequences that bad pixels become harder to recognise (because they become smoothed out) and that covariance between pixels is introduced. We considered it vital to keep the data in pixels independent in order to allow an accurate estimation of the errors (see below). Fortunately this is in fact possible because we are only interested in a small spectral and spatial region; the region where the two wavelength ranges overlap, at the position of the target. For each frame we established the spatial shift by measuring the position of the bright star that was centred in the slit (P04, fig. 1). We then established the appropriate wavelength shift at the spatial position of the target galaxy, from sky lines at a wavelength close to the wavelength of interest. Then, for each group, we registered all the frames using integer pixel shifts, spectrally and spatially. Registration will be correct in the region of interest, but the data will be smeared at other wavelengths and spatial locations. We then scaled the data to the same count level using the counts detected from the bright star. We then measured the noise in a region of low sky (akin to the region of the sought line), and finally combined the 2D frames using inverse–variance weights. There are three objects of interest on the slit: the target emission line, the bright star, and a galaxy at , called , (discussed in R03). The data for this galaxy presented in R03 are the same data analysed by P04. An emission line from galaxy is visible in fig. 4 in P04. We use the emission–line galaxy to flux calibrate our data, using the flux quoted in R03. This ensures that we are on the same flux scale as that of P04, and can compare the noise in our final combined frame to theirs. At the same time we checked our wavelength calibration against theirs, by comparing the two measurements of the wavelength of this line, finding good agreement. The star is useful for measuring the wavelength dependence of atmospheric absorption. To this end we repeated the registration procedures appropriate for the two other targets, and produced combined frames for each object.
There is another registration issue that has not been considered above, caused by the fact that the centering of the target in the slit may vary from frame to frame, resulting in a small wavelength shift of any emission line222We are grateful to Roser Pelló for bringing this to our attention.. We quantified the importance of this effect by measuring the variation of the wavelength difference between the [O iii] line from galaxy , and the adjacent bright sky line. The standard deviation of this difference over the 33 frames is pixels, or 0.1″. It is easy to see that this does not have a significant effect on the detectability of the line. Recall that the resolution of an unresolved line is set by the seeing, because smaller than the slit width. For 0.5″seeing, 3.4 pixels FWHM, adding the spread of shifts in quadrature would increase the wavelength FWHM to 3.7 pixels, an increase of only . Nevertheless for the sake of completeness we added these small increments to the previously computed wavelength shifts, in calculating the relevant integer pixel shifts in the registration process. The results in this paper are with these shifts included. We also produced final frames without these shifts included, and the relevant results are unchanged. We emphasise that we have used exactly the same wavelength information (sky–line map and wavelength drift of the [O iii] line) as P04 to register the pixels containing the claimed emission line. This means that the only difference in our registration procedure is our use of integer pixel shifts. For an image FWHM of 3.4 pixels (spectrally and spatially), we have computed that integer pixel shifts broaden the image by only 2 per cent.
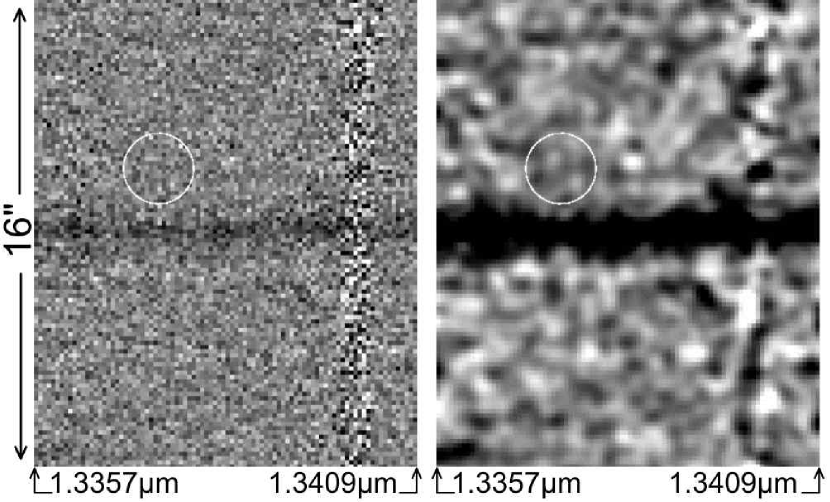
The individual frames suffer from bad pixels and cosmic–ray hits, and it is necessary to identify these and reject them. We experimented with a number of rejection schemes to optimise the rejection of bad data, and to maximise the final S/N. Our preferred scheme compared the counts in a particular pixel to the median counts in that pixel for all the registered frames of the group, -clipping bad data using the estimated error for that pixel (see below). Nevertheless we also produced frames by several other methods, including rejection of the brightest and faintest pixels (IRAF minmax), percentile–clipping (IRAF pclip), and simple medianing. Because our conclusion is that the line is not detected, we closely inspected all these frames, as well as smoothed versions, to search for the line and to look for discrepancies between the different rejection methods. We found no noticeable differences. A final frame was produced for and for , for each of the three targets, of limited spatial extent. Finally, for each object, we registered the and frames, again using integer spatial and spectral shifts, scaled them to a common count level, and averaged, using inverse–variance weights. The final frames were flux calibrated, as explained above. We made no correction for atmospheric absorption in this step, because inspection of the star spectrum indicates that the degree of absorption is similar at the Ly wavelength, and the wavelength of the [O iii] line used in the calibration. The final sub–frame for the Ly emission line is shown in Fig. 1. Residuals of the 50Hz pick–up noise (wavelength in the Y direction 6.5 pixels) are detectable in this frame at a very low level, well below the sky noise. In searching for an emission line in the final frame, we also searched a frame in which we subtracted off the median value of the counts in each row, which will remove any residual pick–up noise, but leave the emission line unaffected.
To assess the significance of any detection requires an accurate estimate of the noise in each pixel. An end–to–end Poisson estimate, accounting for read noise, is one approach. In our experience with near–infrared arrays, this tends to somewhat underestimate the noise. Since we are interested in a faint emission line, we need an accurate estimate of the noise in the sky. For this purpose we measured the standard deviation of the counts up each column of the final frames (estimated by iteratively clipping out sources), and used this as our estimate of the noise in each sky pixel in that column. This procedure would not be valid had we included the wavelength calibration stage.
3 Results
The expected location of the Ly emission line is indicated in Fig. 1 by the circle. The wavelength scale was established from the sky lines. The emission line is not visible in this frame, neither in a smoothed version, nor in the two sub–frames for and . The spatial FWHM in the final combined frame is , or 3.4 spatial pixels. For a point source, this implies a spectral resolution also of about 3.4 pixels. To assess the flux in the reported line we simply integrated the flux and variance in a box of size pixels, centred on the location reported in P04, which is along the slit from galaxy . Our result at the reported location is a measured flux of erg s-1 cm-2. By contrast P04 reported a measured flux of erg s-1 cm-2. However, we note that the distance between the two objects as computed from the quoted coordinates (P04, R03) is , a difference of 2 pixels. Furthermore the optimal length of the box in the spectral direction depends on the intrinsic line width, whether resolved or not. For these reasons we repeated our measurements for smaller ( pixels) and larger ( pixels) boxes, and searched the entire wavelength range visible in Fig. 1, 1.3357m – 1.3409m, shifting the centre from the nominal location by up to 0.5 arcsec, up and down the slit, to be certain we did not miss the line. Over this entire region we found no emission line above significance.
Unfortunately P04 do not quote the aperture used for their measurement of the flux, so we cannot make a direct comparison of the errors. If the aperture sizes are similar, then a direct comparison is valid, in which case it is interesting to note that our quoted error is slightly smaller than theirs, by the factor predicted in the previous section.
Before considering the origin of the discrepancy in the measured fluxes, it is interesting to compare our results for the galaxy with those of R03, measured from the same data. The galaxy lies at a redshift , confirmed by the detection of three lines, [O iii]4959, 5007, and H. The H line is the weakest, for which R03 quote a measured flux of erg s-1 cm-2. We also detect this line. Since this line is evidently real, and of comparable quoted S/N to that of the Ly line, it must be considered surprising that we do not also detect the Ly line if it is also real.
To find the cause of the discrepancy between our results for the Ly line and those reported by P04, we re–reduced the data following the principles of P04, i.e. subtracting frames in pairs, then wavelength calibrating the frames, rebinning onto a linear wavelength scale. In this process we made a careful check for bad data. We identified three variable hot pixels333These have coordinates (28,761), (28, 836), (919, 790) in the raw frames. which result in spurious positive flux in four of the sky–subtracted frames in the region of the emission line. We confirmed that these are very easily identified when the frames are registered to the nearest pixel, but are harder to spot when the data are rebinned in the wavelength calibration step. The summed spurious positive flux, when averaged into the entire data set, corresponds approximately to the flux measured by P04; therefore these variable hot pixels plausibly account for the difference between our results and those of P04. Nevertheless, we hesitate to conclude that we have found the cause of the discrepancy, since in the absence of further details of their reduction process (linear wavelength solution, pixel rejection scheme, frame weights) we are unable to reproduce their results exactly. At the same time this analysis highlights the dangers of rebinning near–infrared array data. Use of a bad–pixel mask is another useful approach to this problem.
Subsequent to the submission of this paper we learnt of the results of Bremer et al. (2004) who re-observed the field, obtaining an image in the H band reaching approximately 1 mag. deeper than the observations of P04. The reported galaxy is not detected in this image. Taken with our non-detection of the reported emission line, a consistent interpretation is that the galaxy does not exist, and that the original reported H () and K () detections are chance superpositions of statistical fluctuations in the background sky.
Acknowledgements.
We are grateful to the anonymous referee for raising issues that have helped clarify this manuscript.References
- Bremer et al. (2004) Bremer M. N., Jensen J. B., Lehnert M. D., Schreiber N. M. F., Douglas L., 2004, ApJ, 615, L1
- Fan et al. (2003) Fan X., Strauss M. A., Schneider D. P., et al., 2003, AJ, 125, 1649
- Gnedin (2000) Gnedin N., 2000, ApJ, 535, 530
- Kogut et al. (2003) Kogut A., Spergel D. N., Barnes C., et al., 2003, ApJS, 148, 161
- Miralda–Escudé (1998) Miralda–Escudé J., 1998, ApJ, 501, 51
- Pelló et al. (2004) Pelló R., Schaerer D., Richard J., Le Borgne J.–F., Kneib J.–P., 2004, A&A, 416, L35 (P04)
- Richard et al. (2003) Richard J., Schaerer D., Pelló R., Le Borgne J.–F., Kneib J.–P., 2003, A&A, 412, L57 (R03)
- Warren and Hewett (2002) Warren S. J., Hewett P. C., 2002, in ‘A New Era in Cosmology’ ASP Conference Proceedings, Vol. 283, p369, eds N. Metcalfe, T.Shanks, (astro–ph/0201216)
-
Weatherley et al. (2005)
Weatherley S. J., Warren S. J., Møller P., Fall S. M.,
Fynbo J. U., Croom S. M., 2005, MNRAS, submitted