Discovery of multiple shells around V838 Monocerotis
We report the discovery of multiple shells around the eruptive variable star V838 Mon. Two dust shells are seen in IRAS and MSX images, which themselves are situated in a shell of CO. This securely establishes V838 Mon as an evolved object. We revisit the light echo, which arises from scattering off the innermost resolved dust shell, to infer a distance to V838 Mon of kpc. The dynamical timescales of the ejected shells, location in the Milky Way and inferred luminosity are consistent with V838 Mon being a low-mass AGB star experiencing thermal pulses of which the 2002 eruption might have sent the star into the post-AGB phase. This scenario, however, is inconsistent with the presence of a (young and massive) B3 V companion.
Key Words.:
Stars: AGB and post-AGB – circumstellar matter – Stars: distances – Stars: individual: V838 Monocerotis – Stars: mass-loss – Stars: peculiar1 Introduction
V838 Monocerotis was discovered on January 6, 2002, (Brown 2002) as a new eruptive variable star, and peaked at mag on February 5, 2002. It then declined in the optical whilst becoming brighter in the IR (Munari et al. 2002). This was accompanied by dramatic changes in the photosphere, making the object an L-type supergiant (Evans et al. 2003). The cause of the eruption of V838 Mon and the nature of its progenitor are unclear.
The distance to V838 Mon may be estimated from the evolution of the light echo, which was discovered in mid-February 2002 (Henden, Munari & Schwartz 2002). After first interpretations suggested a distance of pc (Munari et al. 2002; Kimeswenger et al. 2002), subsequent revisions have led to ever increasing values for the distance of kpc (Wisniewski et al. 2003), kpc (Bond et al. 2003) and kpc (Tylenda 2004). Early estimates supported the scenario proposed by Soker & Tylenda (2003) for the merger of two main-sequence stars, but later estimates allow for post-main-sequence scenarios.
We present here evidence for multiple mass-loss events from the progenitor of V838 Mon, which have occurred before the 2002 eruption. A dust shell is visible on IRAS images, and the central object is resolved by MSX. The double-shell system is situated within a larger shell which is visible on CO maps. We also revisit the evolution of the light echo and discuss the implications of our findings for the nature of the progenitor and eruption of V838 Mon.
2 Fossil dust shells seen in infrared emission
Warm dust, such as found in the vicinity of stars, emits at mid-IR wavelengths, whilst cold dust, such as encountered in the interstellar medium, emits at far-IR wavelengths. The sky around V838 Mon is included in both the IRAS all sky survey (12, 25, 60 and 100 m), and the Galactic plane survey by the MSX in several mid-IR bands of which band A (8.3 m) was the most sensitive. Both surveys were completed well before the recent outburst of V838 Mon (1983 and 1996 for IRAS and MSX, respectively).
2.1 IRAS data
We retrieved IRAS images from the IRAS server111http://www.astro.rug.nl/IRAS-Server/, of a area centred on V838 Mon (Equ J2000 RA, Dec), corrected for zodiacal light. Because of the scanning, IRAS maps suffer from striping patterns. The worst of these was corrected by subtracting a ‘flatfield’, which was created by rotating the image through , median-filtering within a box of (12 and 25 m) or (60 and 100 m), averaging the rows, expanding the result to create a two-dimensional image and rotating through .
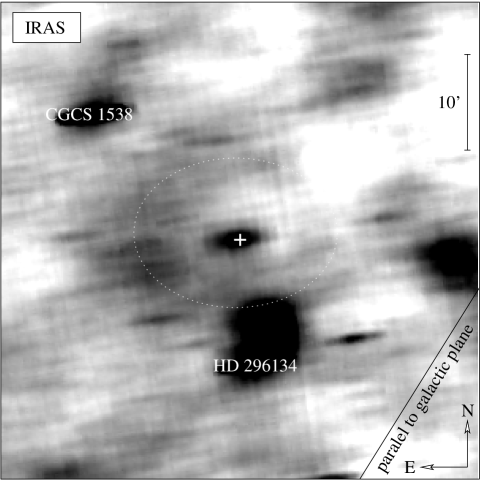
V838 Mon is clearly detected in all four IRAS bands as a compact source, surrounded by an elliptical ring of diffuse emission at from the central object in the North-South direction and East-West (Fig. 1). The image is an average of the four images, after scaling them to a similar dynamic range in intensity (this was done by subtracting the mean and dividing by the mode, which were determined within an area encompassing the ring). There are two bright IR objects nearby which are identified as the foreground star HD 296134 and the dusty carbon star CGCS 1538, but the diffuse IR source immediately North of HD 296134 does not have a known counterpart.
The presence of a ring-like structure of emission surrounding the position of V838 Mon and its persistence in all four IRAS bands lend support to the significance of its detection. We developed a computer code to test this in a more objective manner. The procedure is as follows: (1) Along a circle with radius , the median surface brightness and the difference between the and quartiles of surface brightness values (“spread”) are determined. The ratio of median and spread is a measure of the significance of the emission structure. Because a resolved structure is much more significant than the average signal-to-noise per pixel, the maps are multiplied by a factor , where is the size of a resolution element for which we adopt a conservative ; (2) This is repeated taking, in turn, every pixel in the image as the centre of the circle. Hence a map of the significance of ring-like emission around a certain position is produced; (3) This is repeated for increasing circle radii.
This is a conservative approach, as the observed ring structure is clearly elliptical and a circular ring will therefore never be able to capture all of the most significant structure. Yet it did recover a ring with a radius of centred less than North of the position of V838 Mon as the most likely (semi-)circular structure in the image, with a significance of 6.3 .
With an average surface brightness of MJy sr-1 the ring around V838 Mon is brightest at 100 m, where the central source is quite weak. But with an average surface brightness of MJy sr-1 it is also clearly visible at 12 m where the central source is much brighter than the ring; probably the dust in the ring is colder than the dust in the central source. The latter is marginally resolved at 12 and 25 m.
2.2 MSX data
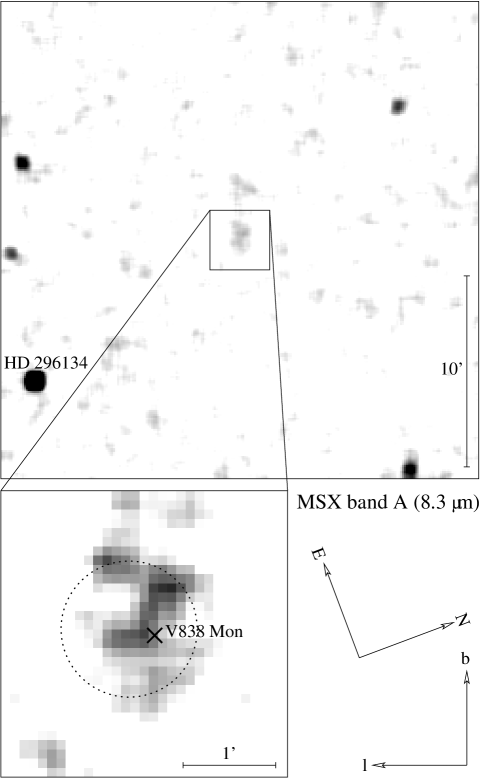
The MSX survey reaches a similar depth to the IRAS survey, but the spatial information within the MSX data is superior. The central source in the IRAS image is clearly resolved in the MSX data into several emission structures within a roughly circular area of diameter (Fig. 2). The band A (8.3 m) image was corrected for striping along the Galactic longitude direction by subtracting an image created from an average of the columns in between the bright point sources seen in the picture. V838 Mon is located near the centroid of the emission complex. None of the emission knots near V838 Mon could be identified with stars in 2MASS JHK images (which do show what is believed to be the progenitor of V838 Mon).
The significance of the emission is estimated by rebinning the image such that the emission extends over only two (adjacent) pixels, each with a surface brightness of W m-2 sr-1. Excluding the emission from the five obvious stars, the standard deviation of the fluctuations in the rebinned map is W m-2 sr-1; the emission associated with V838 Mon is significant at the level, i.e. more than 6 . Being the brightest square arcminute in the entire field (apart from the five bright stars), and its disposition with respect to V838 Mon, lead us to conclude that it is very unlikely to be a chance superposition of fluctuations in the background. At nearly , the next-significant patch of emission in this part of the MSX band A image is the smudge at North of HD 296134, which may be identified with the bright IR source above HD 296134 in the IRAS image (Fig. 1).
3 A large shell of carbon monoxide?
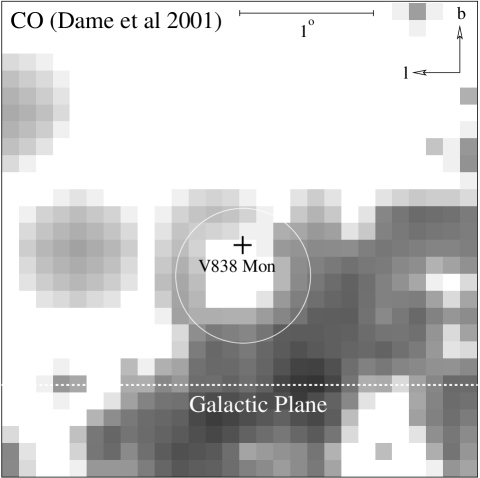
Due to its proximity to the Galactic plane (, ) the sky around V838 Mon was included in several surveys of emission from carbon monoxide (CO), of which the latest compilation is presented by Dame, Hartmann & Thaddeus (2001). Located in the direction just shy of what looks like a molecular cloud, V838 Mon seems to be situated off-centre within a bubble of CO emission with a diameter of (Fig. 3).
The eastern rim of the bubble (“upper left” in Fig. 3) has only been covered in the Superbeam survey (Dame et al. 1987), at a relatively poor spatial resolution (). Its velocity-integrated flux level is K km s-1 per angular resolution element. The western part adjoining the molecular cloud was recorded at a higher spatial resolution (; May et al. 1993), and is also discernible on 60 and 100 m IRAS maps. The flux level of the edge of the molecular cloud delineating this part of the bubble is K km s-1 per angular resolution element. We note that in constructing the composite CO map, Dame et al. only integrated emission that exceeded the rms noise level in the spectra, and hence any emission seen in their maps is statistically significant.
The radial velocity of V838 Mon of km s-1 (Kipper et al. 2004) is rather high and suggests a location in the outskirts of the Milky Way disc (Fig. 3 in Dame et al. 2001). Given the fact that there is no other bubble to be seen within an area of at least 10 square degree, the chance for the line-of-sight towards V838 Mon to intersect the bubble (which covers an area less than 1 square degree) by sheer coincidence is certainly . New, sensitive high-spatial resolution CO (and radio continuum) maps are desired in order to confirm (or otherwise) the physical association of the CO bubble with V838 Mon.
4 The light echo revisited
Since its discovery in February 2002, the light echo of V838 Mon’s eruption has been monitored and used to infer the distance to V838 Mon. The latest interpretation was presented by Tylenda (2004), who analysed images of the light echo taken in 2002. However, images are already available over a much larger timespan, and in light of our discovery of circumstellar dust shells around V838 Mon it is timely to revisit how the light echo can inform us about the distance and nature of V838 Mon.
| Observatory | diameter (′′) | ratio | ||
|---|---|---|---|---|
| (days) | East-West | North-South | ||
| WHT1 | 53 | 12.0 | 11.2 | 1.07 |
| HST2 | 86 | 14.3 | 14.0 | 1.02 |
| SAAO3 | 101 | 16.4 | 15.3 | 1.07 |
| HST2 | 106 | 17.2 | 16.2 | 1.06 |
| HST2 | 211 | 24.4 | 23.1 | 1.06 |
| SAAO3 | 224 | 24.2 | 23.1 | 1.05 |
| HST2 | 267 | 27.5 | 25.3 | 1.09 |
| USNO4 | 291 | 29.3 | 27.0 | 1.09 |
| HST2 | 317 | 29.7 | 27.9 | 1.06 |
| USNO4 | 625 | 42.8 | 40.2 | 1.06 |
| HST2 | 735 | 46.5 | 43.6 | 1.06 |
1Munari et al. 2002
2http://hubblesite.org/newscenter/newsdesk/archive/releases/
2003/10 and 2004/10
3http://da.saao.ac.za/news/v838mon.jpg
4http://www.ghg.net/akelly/v838lar2.jpg and v838lar3.jpg
We measured the diameter of the outer rim of the light echo visible on high quality images taken at the WHT, HST, SAAO and USNO over a period of more than two years since outburst (Table 1). There are many sources of uncertainty entering the error on the measured value, but the most important of these — irregularity and limited contrast of the rim — are small enough for a sensible analysis, and the values given are accurate to . Although the echo is clearly elliptical, the axial ratio (EW over NS) of is quite close to unity.
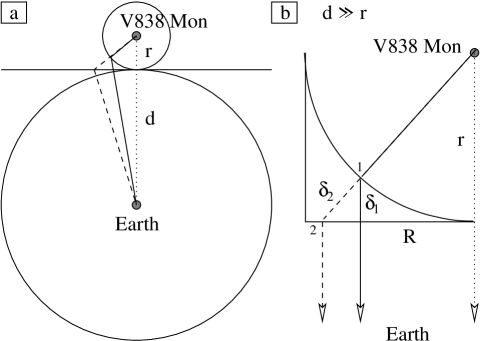
Simple models for the evolution of the light echo, valid for the small angular extent of the echo, predict that the diameter grows with time since outburst, , as:
| (1) |
(see Fig. 4) where the minus sign is appropriate for a thin shell of radius and the plus sign for a thin plane of scattering dust at a distance in front of the light source and perpendicular to the line-of-sight ( is the speed of light and is the distance to the light source).
Both the optical images of the light echo and the infrared emission as imaged by MSX show significant substructure in the scattering medium. Nevertheless, the evolution of the light echo diameter is remarkably monotonic in time (Fig. 5), which gives credence to the employment of simple models to describe the global geometry of the scattering medium.

At a distance kpc, a small shell with radius pc (projected radius 26) fits the early 2002 data but is inconsistent with the more recent data, whereas a larger shell with radius pc (projected radius ) fits the 2004 data but not the earlier data (Fig. 5). The only single shell solution is obtained by placing V838 Mon at kpc, allowing for a larger shell (projected radius ). This would place V838 Mon beyond the edge of the Milky Way disc, either within the Milky Way halo or within an as yet unrecognised dwarf galaxy. This is extremely unlikely, given the proximity of V838 Mon to the Galactic plane and its apparent association with a CO shell at the edge of a molecular cloud.
Alternative solutions for kpc include a hybrid solution of a thin shell (with radius pc) and a thin plane, but the plane would have to be only pc in front of V838 Mon and hence intersect the shell — an unlikely and rather ad hoc geometry.
The data may be reconciled with a reasonable distance if we relax the assumption of a thin scattering medium. For a distance of kpc, the most recent data may be reproduced by scattering under right angles ( in Eq. 1) from dust at from V838 Mon. Also at kpc, the early 2002 data may be reproduced by scattering off a shell with pc (projected radius ). The rim of the light echo might first arise from scattering off the dense inner edge of the shell, but continue to advance through the shell outward after the reflection off the inner shell edge turns back into itself after about a year. The circumstellar material echoing the light of the February 2002 outburst is thus identified with the innermost resolved dust shell as seen in the MSX image. For small dust grains (m) scattering under angles greatly different from is inefficient; the outer rim of the echo will dim faster than by geometric dilution alone.
This scenario will not work for a distance less than kpc, because once scattering occurs under right angles we expect the projected expansion of the light echo to proceed linearly with time — and this is not yet seen. But it works for larger distances, where the scattering does not yet occur under right angles. We thus predict the light echo to enter a stage of linear expansion with time, which then yields an unambiguous value for the distance.
5 The nature of V838 Monocerotis
Despite a geometric method (the light echo) to estimate the distance to V838 Mon there remains uncertainty about its value as it depends on our interpretation of the circumstellar dust environment and the scattering properties of the dust grains. Although the simplest model for the light echo would place V838 Mon outside the Milky Way, we also present an interpretation where the echo proceeds through an extended shell, whereby the scattering angle approaches . Accepting the latter as the more likely scenario, we adopt a distance of kpc, but remind the reader that this is a lower limit.
To determine the time at which the fossil shells were ejected we also need to know the expansion velocity. Although this might, in principle, be estimated for the inner shell from spectra of the scattered light echo, such an observation has yet to be made and will not be feasible for the outer dust shell. The CO shell expansion velocity might be measured from spectra of the CO line profile in the line-of-sight towards V838 Mon, but this has not yet been feasible (cf. Rushton et al. 2003) due to the great amount of dilution rendering only the rim visible (where the radial velocity due to expansion is minimal).
We here calculate dynamical timescales by assuming a constant outflow velocity of km s-1. This would yield yr per projected parsec. A further complication in case of the CO shell is that V838 Mon is placed considerably off-centre and that the material might have slowed down as it had to plough through surrounding interstellar medium. For the subsequent dust shells this may not have been an issue as the CO shell would have swept clean a cavity for the dust shells to expand freely into, unless the removed interstellar medium was replenished by stellar mass loss in between eruptions.
We thus estimate dynamical timescales, for the CO shell yr, for the outer dust ring yr, and for the inner dust ring yr. If the current eruption is the fourth such event, then it seems that these events have occurred at an increasing rate.
Placing V838 Mon at a distance of (at least) 5.5 kpc makes its outburst peak at a bolometric luminosity L⊙. The total energy radiated throughout the eruption (Bond et al. 2003) must then have been J. The putative progenitor would have had L⊙. The 2002 eruption and possibly earlier eruptions that produced the fossil shells might thus have been the result of helium-flashes (thermal pulses) on the AGB. Indeed, Kipper et al. (2004) report enhanced abundances of s-process elements, suggesting -dredge-up on the thermal-pulsing AGB.
Situated in the outskirts of the Galaxy, V838 Mon is likely to be metal poor (Kipper et al. (2004) estimate ) and of low mass ( M⊙). Inter-pulse timescales are longer for lower-mass AGB stars, typically several yr for a 1 M⊙ star, but decrease in time as the core mass grows (Vassiliadis & Wood 1993), in accordance with the above dynamical timescales of the shells around V838 Mon. An AGB star with little envelope mass will be severely affected by a thermal pulse at the base of its envelope. We therefore propose that V838 Mon experienced its fourth and final thermal pulse, resulting in the ejection of what may become a planetary nebula.
Our scenario for a low-mass AGB star progenitor of V838 Mon, however, is inconsistent with the presence of a B3 V companion (Munari, Desidera & Henden 2002). Membership of a binary system in which the companion is a young and massive star implies that the erupting star must be young and massive too. Future studies must find a way of reconciling these two contrasting sets of observational evidence.
Acknowledgements.
We would like to thank Dr. Joana Oliveira for valuable discussions, and an anonymous referee for her/his critical remarks which helped improve the presentation of the results. This research made use of the IRAS data base server of the Space Research Organisation of the Netherlands (SRON), data products from the Midcourse Space Experiment, the NASA/ IPAC Infrared Science Archive, and Aladin. MTR is supported by a PPARC studentship.References
- (1) Bond H.E., et al. 2003, Nature 422, 405
- (2) Brown N.J. 2002, IAUC 7785
- (3) Dame T.M., et al. 1987, ApJ 322, 706
- (4) Dame T.M., Hartmann D., Thaddeus P. 2001, ApJ 547, 792
- (5) Evans A., et al. 2003, MNRAS 343, 1054
- (6) Henden A., Munari U., Schwartz M. 2002, IAUC 7859
- (7) Kimeswenger S., Lederle C., Schmeja S., Armsdorfer B. 2002, MNRAS 336, L43
- (8) Kipper T., et al. 2004, A&A 416, 1107
- (9) May J., Bronfman L., Alvarez H., Murphy D.C., Thaddeus P. 1993, A&AS 99, 105
- (10) Munari U., et al. 2002, A&A 389, L51
- (11) Munari U., Desidera S., Henden A. 2002, IAUC 8005
- (12) Rushton M.T., et al. 2003, A&A 412, 767
- (13) Soker N., Tylenda R. 2003, ApJ 582, 105
- (14) Tylenda R. 2004, A&A 414, 223
- (15) Vassiliadis E., Wood P.R. 2004, ApJ 413, 641
- (16) Wisniewski J.P., et al. 2003, ApJ 588, 486