The Dense Molecular Cores in the IRAS 21391+5802 region
We present a detailed kinematical study and modeling of the emission of the molecular cores at ambient velocities surrounding IRAS 21391+5802, an intermediate-mass protostar embedded in IC 1396N. The high-density gas emission is found in association with three dense cores associated with the YSOs BIMA 1, BIMA 2, and BIMA 3. The CS (=54) and CH3OH (=54-1) emission around BIMA 1 has been modeled by considering a spatially infinitely thin ring seen edge-on by the observer. From the model we find that CS is detected over a wider radii range than CH3OH. A bipolar outflow is detected in the CS (=21) line centered near BIMA 1. This outflow could be powered by a yet undetected YSO, BIMA 1W, or alternatively could be part of the BIMA 1 molecular outflow. The CS and CH3OH emission associated with the intermediate-mass protostar BIMA 2 is highly perturbed by the bipolar outflow even at cloud velocities, confirming that the protostar is in a very active stage of mass loss. For YSO BIMA 3 the lack of outflow and of clear evidence of infall suggests that both outflow and infall are weaker than in BIMA 1, and that BIMA 3 is probably a more evolved object.
Key Words.:
ISM: individual: IC 1396N, IRAS 21391+5802 — ISM: jets and outflows — ISM: molecules — radio lines: ISM — stars: formation1 Introduction
It is well known that Young Stellar Objects (YSOs) are embedded in dust and gas. For low-mass stars, the youngest and more embedded Class 0 objects have most of their emission in large scale gas and dust structures, consistent with envelopes, while more evolved optically visible T Tauri stars have compact continuum emission, associated with disks, with little or no extended emission (e.g. Ohashi et al. ohashi91 (1991), ohashi96 (1996); Chen et al. chen92 (1992); Looney et al. looney00 (2000)). This well-defined evolutionary sequence found for low-mass stars, however, does not have a counterpart for higher mass stars, such as Herbig Ae and Be stars and their intermediate-mass precursors with masses in the range 2 . For the intermediate-mass YSOs, the difficulty of identifying the youngest protostars, which are still in the infalling envelope phase, and the fact that they tend to be located at greater distances make them less studied and less well understood objects. The immediate vicinity of such protostars is a very complex environment, where the extended emission is usually resolved into more than one source when observed at high resolution (e.g. G173.58+2.45: Shepherd & Watson shepherd02 (2002); IRAS 21391+5802: Beltrán et al. beltran02 (2002), hereafter Paper I). In addition, the molecular outflows driven by intermediate-mass objects are more energetic. Thus, their interaction with the circumstellar gas and dust material surrounding the protostars is expected to be stronger and more dramatic, disrupting the envelopes and pushing away the dense gas at high velocities.
For the intermediate-mass protostar IRAS 21391+5802 we conducted a detailed high angular resolution study by carrying out centimeter and millimeter continuum and spectral line BIMA observations (Paper I). The continuum emission at centimeter and millimeter wavelengths was resolved into three sources: BIMA 1, BIMA 2, and BIMA 3. The strongest source at millimeter wavelengths is BIMA 2, which is most likely the object associated with IRAS 21391+5802, and it has a circumstellar mass of . Regarding the CO emission, at least two molecular outflows were detected in the region, one of them is elongated along the north-south direction centered on BIMA 1, and the other one is a stronger east-west outflow centered at the position of the intermediate-mass protostar BIMA 2. The BIMA 2 CO outflow presents a complex structure and kinematics. While at high outflow velocities the outflow is clearly bipolar, at low outflow velocities the blueshifted and redshifted emission are highly overlapping, and the strongest emission shows a V-shaped morphology. The CS and CH3OH emission from the BIMA 2 outflow exhibits two well differentiated and clumpy lobes, with two prominent northern blueshifted and redshifted clumps. The curved shape of the clumps and the spectral shape at these positions are consistent with shocked material. In addition, CS and CH3OH are strongly enhanced toward these positions with respect to typical quiescent material abundances in other star-forming regions. These kinematical and chemical evidences suggest that the clumps are tracing gas entrained within the surface of interaction between the molecular outflow and the dense ambient quiescent core, and that the morphology of the molecular outflow is a result of this interaction. As compared to the low-mass counterparts, the properties of the outflow driven by BIMA 2 are consistent with those of the outflows driven by low-mass young objects, and it fits well the correlations found for low-mass outflows by Cabrit & Bertout (cabrit92 (1992)), Anglada (ang96 (1996)), and Bontemps et al. (bontemps96 (1996)). In addition, the morphology and properties of the circumstellar structures around this intermediate-mass protostar are similar to those of low-mass counterpart Class 0 objects. The other two sources in the region BIMA 1 and BIMA 3, have a mass of each, and their small dust emissivity index is suggestive of grain growth in dense regions (e.g. Mannings & Emerson mannings94 (1994)). This fact together with the more compact appearance of their dust emission suggest that they could be more evolved low-mass objects. The results presented in Paper I analyzed and discussed the kinematics of the dense gas as it relates to the molecular outflows detected in the region. On the other hand, in order to continue our study of this intermediate-mass star-forming region, in this present work we analyze and model the kinematics of the gas at ambient velocities as it relates to the molecular cores in which BIMA 1, BIMA 2, and BIMA 3 are embedded. The results of this study are presented here.
2 Observations
The details of the observations, carried out with the 10–antenna BIMA array111 The BIMA array is operated by the Berkeley–Illinois–Maryland Association with support from the National Science Foundation. between 2000 March and 2001 January, are given in Paper I. The maps at 3.1 mm were done by using a robust weight of 0.5, with a resulting synthesized beam of , P.A.. Channel maps at 1.2 mm were also done with a robust weight of 0.5, with a resulting synthesized beam of , P.A., and the integrated intensity maps were done with a robust weight of 1, and the resulting synthesized beam is , P.A.. The spectral resolution of the observations was 0.30 km s-1 for CS (=21) at 97.981 GHz, and 0.12 km s-1 for CS (=54) at 244.936 GHz and CH3OH (=54-1) at 241.767 GHz. We note that for the velocity range at which the ambient gas arises (between and 3 km s-1) the CS (=21) emission appears to be quite extended (see Fig. 1). This suggests that there is possibly a significant fraction of the total flux missed by the BIMA interferometer. The CS (=21) BIMA observations were done in the C array, so these observations should be sensitive to structures up to 60′′ (Wright 1996). The dense cores associated with BIMA 1, BIMA 2 and BIMA 3 have sizes (FWHM ) significantly below this value. The 1 mm observations (CH3OH and CS (=54)) were done using the B and C arrays, so they should be sensitive to structures up to 24′′. This value is still larger than the CS (=21) sizes of the three dense cores. Therefore, the 3 and 1 mm line emission from the three dense cores studied in this paper should not be significantly affected by missing flux.
3 Results
3.1 Lines observed
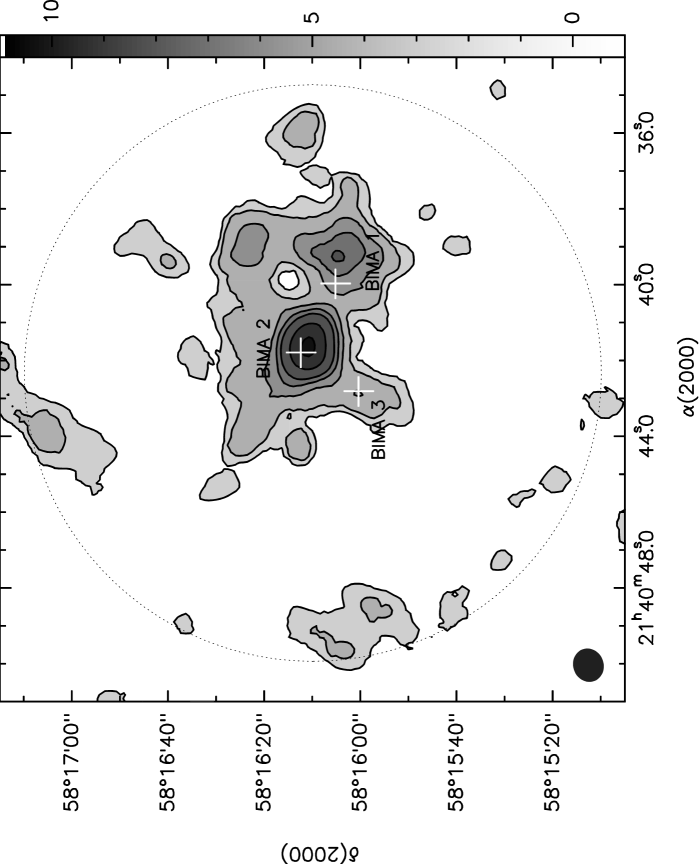
CS (=21), CS (=54), and CH3OH (=54-1) were observed toward IRAS 21391+5802. Figure 1 shows the integrated emission of the CS (=21) at ambient velocities km s-1. The strongest emission arises from a core associated with the YSO BIMA 2. West to this core, there is another core, which is associated with the YSO BIMA 1. Surrounding these two cores, there is extended and weaker emission spanning about 20-30′′ from the cores. The other YSO detected in the region, BIMA 3, is also associated with CS emission. Additionally, an elongation is also visible toward the northeast of BIMA 2. This emission is clearly seen in CS (=54) as a clump located from BIMA 2 (see Fig. 11 of Paper I).
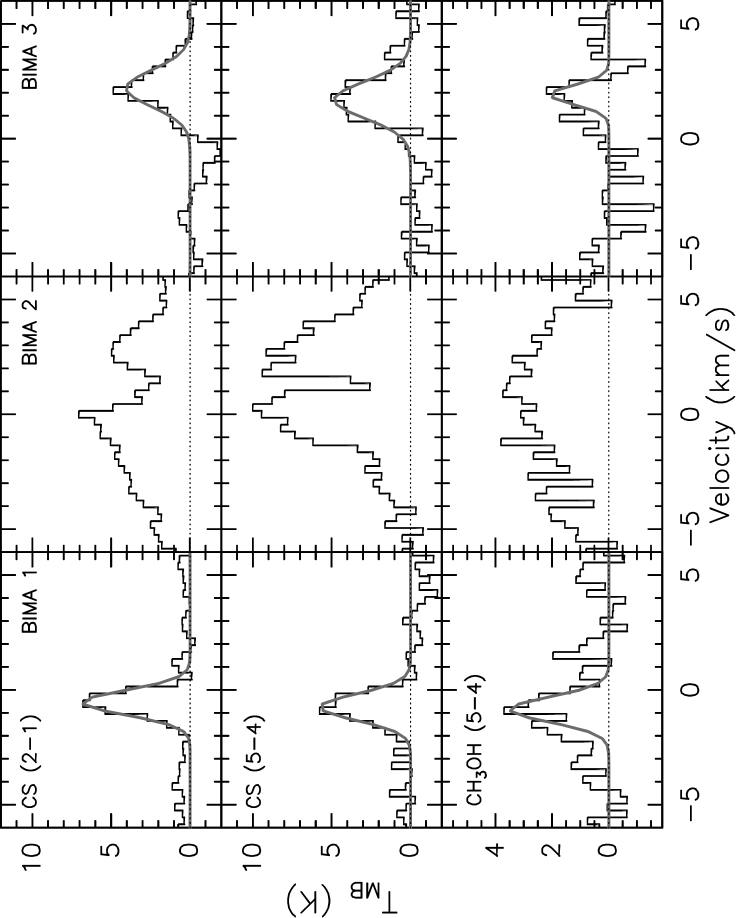
CS (=54) and CH3OH (=54-1) emission are also associated with the three YSOs BIMA 1, BIMA 2, and BIMA 3. The strongest and more extended emission for both species arises from the core associated with BIMA 2. Figure 2 shows the spectra obtained for CS (=21), CS (=54), and CH3OH (=54-1) toward the positions of BIMA 1, BIMA 2, and BIMA 3.
3.2 Physical parameters
| Molecule & | |||||||
|---|---|---|---|---|---|---|---|
| Position | Transition | (K km s-1) | (K) | ( km s-1) | ( km s-1) | (arcsec) | () |
| BIMA 1 | CS (=21) | ||||||
| CS (=54) | |||||||
| CH3OH | |||||||
| BIMA 3 | CS (=21) | ||||||
| CS (=54) | 0.3 – 4.6(c) | ||||||
| CH3OH | s |
(a) Deconvolved geometric mean of the major and minor axes of the 50% of the peak contour of the CS (=54) map.
(b) Virial mass obtained from the CS (=54) using a of 0.5 km s-1, intrinsic line width (i.e. the line width corrected for kinematics) obtained from the collapsing ring model for BIMA 1 (see ).
(c) We cannot disentangle the kinematics of BIMA 3. Therefore we give the values for the virial mass assuming that the CS line width is the intrinsic line width (which gives an upper limit), and the value adopting km s-1, the intrinsic line width derived for BIMA 1.
Table 1 lists the fitted line parameters for each transition for BIMA 1 and BIMA 3. The core associated with the YSO BIMA 2 is being strongly disturbed by the outflow even at velocities close to the systemic value, km s-1. As can be seen in the spectra in Figure 2, the BIMA 2 profiles are not Gaussian and show emission at high velocities. This is probably because the molecular outflow dominates the emission. In addition, both CS (=21) and (=54) lines also show a clear redshifted self-absorption feature. Thus, because of the difficulty to disentangle the cloud emission from the outflow emission, we cannot study the properties of the molecular core associated with BIMA 2. The outflow clearly enhanced the integrated emission map shown in Figure 1.
From the spectra (Fig. 2) and their fits (Table 1) it is clear that while BIMA 1 has a systemic velocity of km s-1, the core associated with BIMA 3 is at a different velocity, km s-1. In Table 1 we also show the deconvolved size of the cores obtained from the CS (=54) data, and the virial mass estimated from the intrinsic line width (i.e. the line width corrected for kinematics) obtained from the collapsing ring model for BIMA 1 (see ), assuming a homogeneous spherical clump, and neglecting contributions from magnetic field and surface pressure. In such a case the virial mass can be computed from the expression (see e.g. MacLaren et al. maclaren88 (1988)):
| (1) |
where is the distance, 750 pc for IRAS 21391+5802 (Matthews matthews79 (1979)), is the deconvolved size of the source, and is the intrinsic line width. It should be noted that the virial mass depends on the density profile. For a power-law density distribution of the type , the virial mass obtained from Eq. (1) should be multiplied by a factor which is for (MacLaren et al. maclaren88 (1988)). Thus, the values given in Table 1 should be taken as upper limits.
4 Discussion
4.1 BIMA 1
As seen in the previous section the high-density gas emission at ambient velocities km s-1 around IRAS 21391+5802 is found in association with three dense cores associated with the YSOs BIMA 1, BIMA 2, and BIMA 3. We conducted a kinematical study of each core that revealed important properties of the cores and of their evolutionary stage.
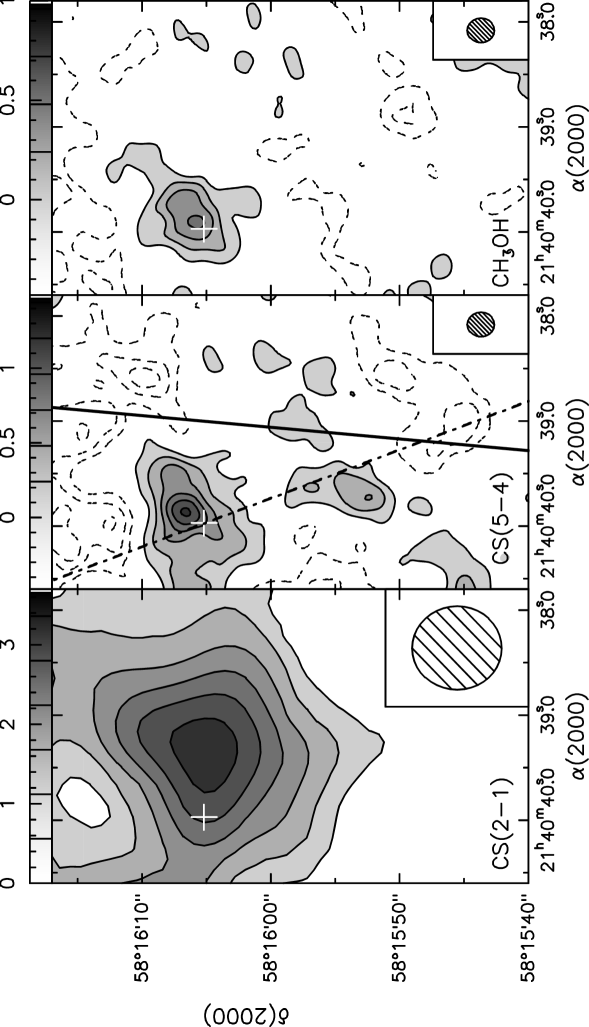
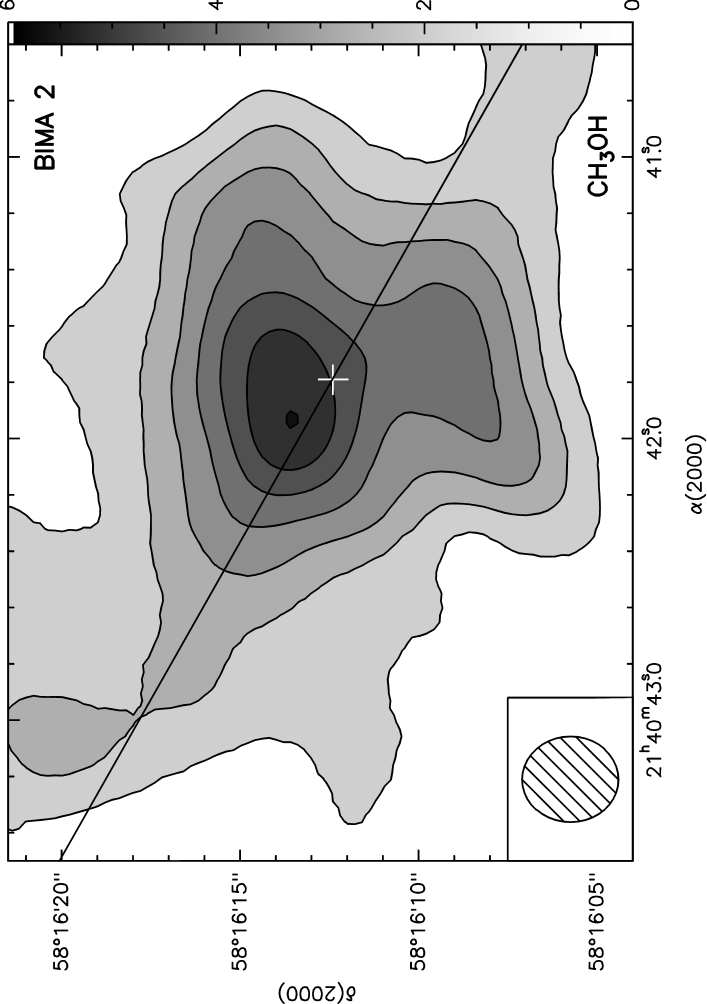
Figure 3 shows the emission of CS (=21), CS (=54), and CH3OH (=54-1) toward BIMA 1, integrated for the velocity range km s-1. The core associated with the YSO BIMA 1, which is likely the powering source of the north-south bipolar molecular outflow detected in the region (Paper I), is well traced by the three transitions. On the one hand, CS (=54) and CH3OH peak at the same position as the 3.1 mm continuum emission (Paper I). On the other hand, as can be seen in this figure, the CS (=21) emission peaks at a position shifted to the west from that of the CS (=54) and CH3OH emissions. This shift in position is of the order of the CS (=21) beam (), and thus, significant. Note that this is not an instrumental or calibration effect, since the observations were carried out by configuring the BIMA digital correlator to observe simultaneously the 3.1 mm continuum emission and the CS (=21) line.
The morphology of the emission of the three species is also different. Despite the CS (=21) observations having a lower angular resolution than CS (=54), CS (=21) is tracing a more extended region, with a deconvolved size of , about 3 times larger than that traced by CS (=54). All this suggests that CS (=21) is tracing different material than CS (=54) and CH3OH, and thus, the physical properties and kinematics of the gas traced by them might be different. CS (=54) and CH3OH would be likely tracing dense and hot gas associated with the YSO BIMA 1, while CS (=21) would be tracing more extended, less dense and cooler material.
4.1.1 CS (=54) and CH3OH (=54-1)
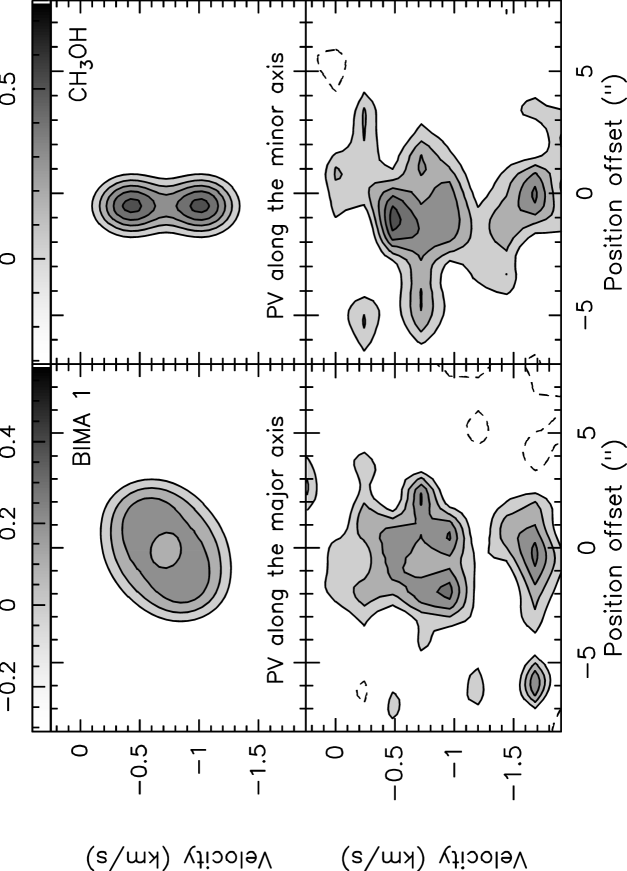
As seen in Fig. 3, the integrated emission of CS (=54) and CH3OH (=54-1) shows an elongated core at P.A., perpendicular to the outflow axis with P.A.. The deconvolved size of this core is , or AU at the distance of the source. Schwartz et al. (schwartz91 (1991)) have mapped in C18O (=10) a similar structure toward the position of BIMA 1. If this morphology corresponds to a disk-like structure seen nearly edge-on, the ratio between the major and minor axes of the emission gives an inclination angle of .
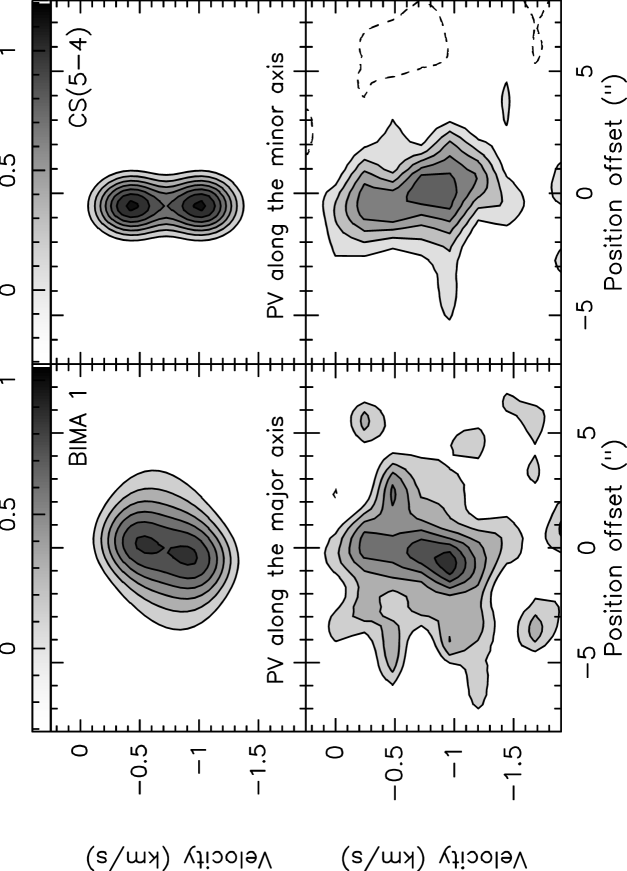
The kinematics of the gas surrounding BIMA 1 can be seen in the position-velocity (PV) cuts done along the major axis () and the minor axis () of the dense core (see Figs. 4 and 5). For both molecules, the PV plot along the major axis shows a structure roughly symmetric both in velocity, respect to a velocity of km s-1, and in position, respect to the center. The plot along the minor axis shows two blobs at the central position, symmetric respect to a velocity of km s-1 as well.
For CH3OH (=54-1), the PV plot along the major axis shows a ringlike morphology, suggesting that the gas is collapsing (or expanding) radially and that the emission arises from a ringlike or toroidal structure. The CS (=54) PV plot, however, shows a different morphology. The highest velocities (relative to km s-1) of the core appear only near the central position, while for the largest position offsets, , the relative velocities are smaller. This can be interpreted as the emission of superposing rings of different radius, with an infall (or expansion) velocity that decreases with increasing radius.
We considered a model of a spatially infinitely thin disk with infall and rotation, similar to that of Ohashi et al. (ohashi99 (1999)) for L1554 and that of Girart et al. (girart01 (2001)) for HH 80N. Regarding the inclination, we considered a disk seen edge-on by the observer. We think that the inclination of the disk is small because the PV signature seen in the data agrees with (see Figs. 4 and 5): for both molecules the emission along the major axis extends roughly from to , while along the minor axis it is compact, and for CH3OH the PV plot along the major axis shows a characteristic ring shape. In case the disk is not edge-on, one should apply a correction factor proportional to . We assumed that the infall velocity was a power law of the radius, with index (the value expected for free fall), . Since the fit showed that the rotation velocity was very small, we assumed it to be independent of radius. In addition, we assumed that the intensity was proportional to . In case of optically thin emission, this would correspond to a disk with a surface density proportional to . The free parameters of the model were the inner and outer radii of the disk, and , the infall velocity at a fixed radius (taken to be 1000 AU), , and the rotation velocity, . The synthetic PV diagrams were computed along the projected major and minor axes of the disk, and convolved with a Gaussian in the PV plane, with a resolution of in position and 0.5 km s-1 in velocity, to compare with the observed diagrams for both molecules.
The observed and synthetic PV diagrams are shown in Figs. 4 and 5 . We explored the parameter space of the model and found that it was possible to found a good fit to the four observed PV diagrams simultaneously, for the same values of the velocities ( km s-1, km s-1), and different values of the inner and outer radii of the disk for each molecule (CS: AU, AU; CH3OH: AU).
Assuming that the infalling material is in free fall, the dynamical mass required is given by . From the value and uncertainty of the infall velocity obtained from the fit, we can estimate it to be . The virial mass estimated from the CS (=54) intrinsic line width is (Table 1) for a homogeneous density distribution. However, for typical density distributions, , with –1.5, the virial mass is 0.18–0.24 . Thus, taking into account the uncertainties of the model, such values are consistent with the dynamical mass. Regarding the circumstellar mass, the value estimated from the dust emission (Paper I) is 0.07 , roughly half of the dynamical mass. If the observed velocities are infall, this would require a total (circumstellar plus protostar) mass similar to the dynamical mass, and thus, the protostar should have a mass similar to the circumstellar mass. This is consistent with BIMA 1 being a late Class 0 or Class I protostar (André et al. andre00 (2000)). Thus, the data available are consistent with the BIMA 1 core being in collapse.
As mentioned above the radii of the ring were AU and AU for CS, and AU for CH3OH. The value of the outer radius can be affected by sensitivity. Its value is constrained by the extension of the PV map in the position direction. However, this should not affect significantly the estimate of the mass of the disk because the power-law index for the density obtained is . Note that the CS emission spreads over a larger range of radii, up to 3750 AU, while that of CH3OH is detected only at a radius of 1500 AU. This probably traces molecular abundance variations with radius (CH3OH being confined within a narrow range of radii from the protostar), or different excitation conditions for both species. In the latter case the non detection of CS and CH3OH at radii smaller than could be attributed to the fact that higher energy transitions than those observed are excited for the higher temperature near the protostar. Note that a CH3OH knot visible at a velocity of km s-1 (Fig 5) is not fitted by the model. The velocity of this knot does not fit the kinematic structure of the circumstellar gas. However, the knot may be part of the blueshifted gas, since the blueshifted lobe of the outflow encompasses the position of BIMA 1 (see next section and Fig. 6).
4.1.2 CS (=21)
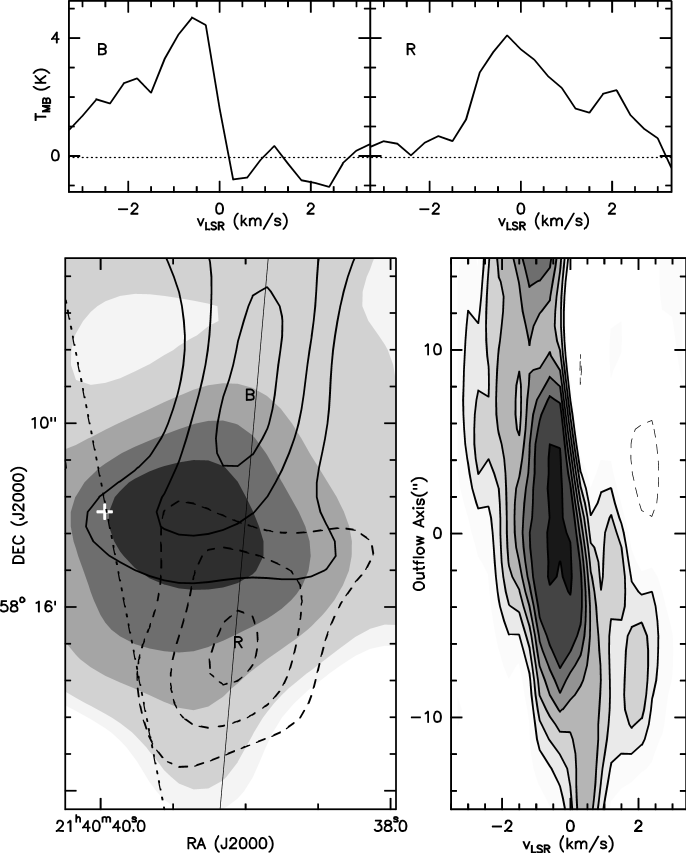
CS (=21) spectrum in Fig. 2 shows marginally wings of emission, especially at blueshifted velocities with respect to the of the core, km s-1. Figure 6 shows the CS (=21) emission integrated for the velocity intervals corresponding to the dense core, to the blueshifted and to the redshifted emission. The blueshifted and redshifted lobes are located roughly symmetrically on both sides of the peak of the CS (=21) core emission. This suggests that the CS (=21) emission traces outflowing gas at moderate velocities. The axis of this outflow has a P.A.. The PV diagram along this axis is shown in the right panel of Fig. 6, where the blueshifted wing is clearly visible toward the north of the core, and the redshifted wing toward the south. The spectra of the CS (=21) emission taken at the center of each lobe (see top panel of Fig. 6) shows the presence of blueshifted and redshifted material, confirming the existence of an outflow traced by the CS (=21) emission. Assuming that the CS emission is in LTE and is optically thin, we calculated a mass of roughly 0.02 for the gas associated with the outflow, for a excitation temperature of 10 K, and a CS abundance of 3 (e.g., NGC 1333 IRAS2A: Jorgensen et al. jorgensen04 (2004)). The momentum and kinetic energy of the BIMA 1W outflow is km s-1 and ergs, respectively, which are clearly lower than those of the BIMA 1 and BIMA 2 outflows traced by CO (Paper I).
The center of symmetry of the CS (=21) outflow is located west of BIMA 1, a shift that is slightly larger than the synthesized beam diameter along the right ascension. An inspection of the channel maps at the ambient gas velocities shows that the peak emission is located between BIMA 1 and the center of symmetry of the CS (=21) outflow. This is also shown in the map of the integrated emission for the ambient gas velocities (Fig. 6). All this suggests that the CS (=21) outflow could be powered by a yet undetected YSO, BIMA 1W, located at the center of symmetry of this outflow (see Fig. 6 caption for the absolute coordinates). Based on the millimeter continuum observations (Paper I), the upper limit for the dust mass of this embedded object would be . Note that if BIMA 1W has associated a compact core traced by CS (=21), as the other YSOs in this region do, BIMA 1 and BIMA 1W could not be spatially resolved because of the CS (=21) angular resolution, and the blended emission will appear to peak between the two sources, as it is the case.
Alternatively, we cannot discard that the CS (=21) outflow is not an independent outflow but it is part of the outflow associated with BIMA 1 and detected in CO (=10) at higher velocities (see Paper I). The northern and southern lobes of this CO outflow are redshifted and blueshifted, respectively, which is the reverse situation than that of the CS outflow. Yet, this could be explained if the BIMA 1 outflow axis is near to the plane of the sky. In any case, in this scenario the CS (=21) bipolar emission would possibly be tracing the denser part of the low velocity cavity of the BIMA 1 outflow.
It is clear that further high angular resolution () and high sensitivity observations at millimeter and submillimeter wavelengths would be needed to confirm the presence of the BIMA 1W embedded young source and its association with the CS (=21) outflow.
4.2 BIMA 2
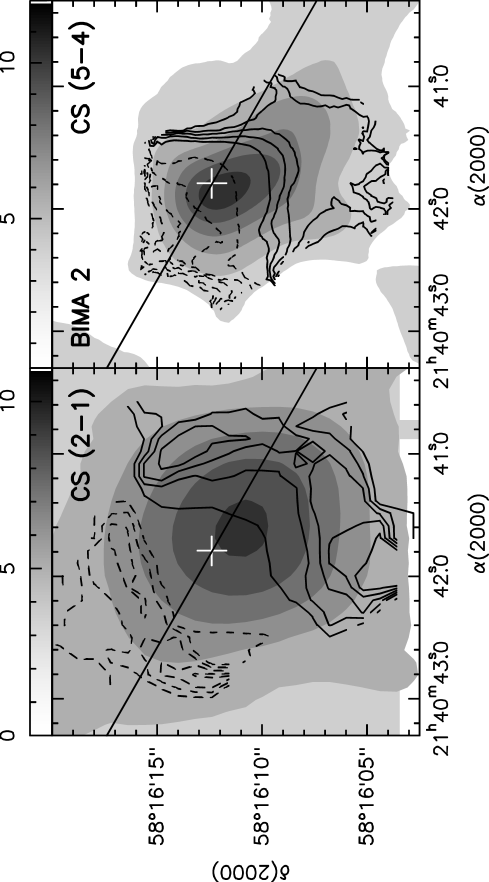
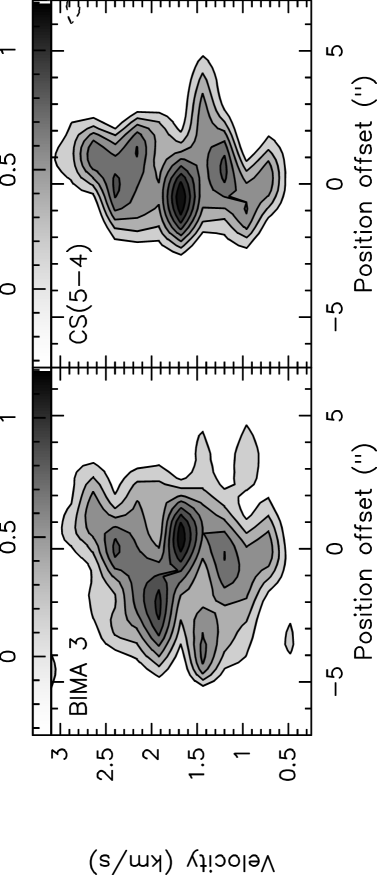
BIMA 2 is the intermediate-mass protostar associated with IRAS 21391+5802 and is powering a strong east-west molecular outflow (Paper I). As seen in Fig. 1 the molecular core associated with this YSO is the strongest core in the region. The CS and CH3OH emission are being strongly disturbed by the outflow even at ambient velocities. Thus, it is not possible to study in much detail the kinematics of the core because the presence of outflowing gas along the line-of-sight makes any interpretation of the motions very difficult. This can be seen in Fig. 7, where the first-order moment (intensity weighted mean ) of the CS (=21) and (=54) emission around BIMA 2 shows a velocity gradient across the source in the direction of the molecular outflow (P.A.). This velocity is correlated with the molecular outflow; that is, blueshifted velocities toward the southwest and redshifted velocities toward the northeast. This can also be seen in the PV diagrams of Fig. 8 that show CS (=21), CS (=54), and CH3OH (=54-1) along the axis of the molecular outflow.
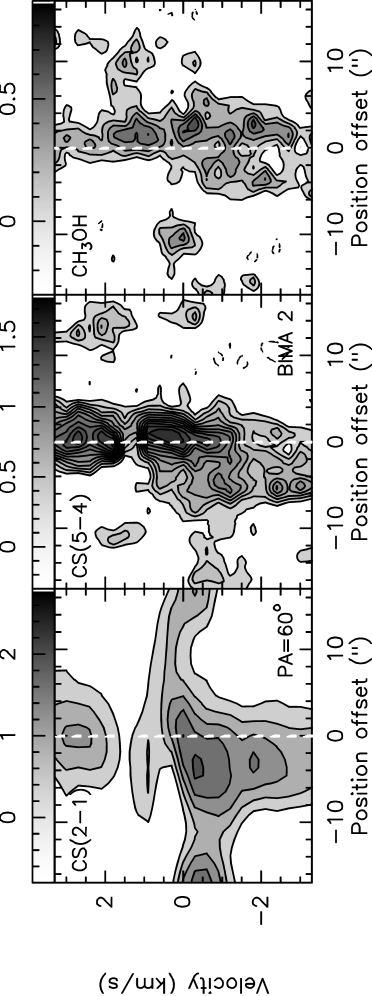
For this core, the CS (=21) and CS (=54) integrated emission peaks close to the position of 3.1 mm continuum source (Paper I). However, Fig. 8 shows that around BIMA 2 the CS (=21) emission peaks at km s-1 whereas the CS (=54) emission peaks at 0.5 km s-1. This along with the clear self-absorption feature seen in both transitions at the position of the dust source (Fig. 2) is likely due to a high optical depth of ambient gas emission. Therefore, this suggests that most of the CS emission at ambient velocities is not tracing the dense core around BIMA 2 but the interaction layer of the molecular outflow with the dense core. This is supported by the kinematical correlation of the CS emission at ambient velocities with the molecular outflow.
The CH3OH (=54-1) emission peak is offset by with respect to the CS (=54) emission peak, of the order of the beam size, in the outflow direction (see Fig. 9). The PV cuts of Fig. 8 show a deficit of CH3OH emission toward the position of the 3.1 mm source for all velocities. This molecule is usually produced by low-velocity shocks induced by the molecular outflow and it is more often found in association with the outflowing gas (e.g. Bachiller et al. bachiller98 (1998)). Thus, this suggests that the chemistry of CH3OH is probably being affected by shocks between the molecular outflow driven by BIMA 2 and the dense core at ambient velocities. However, the spatial offset between the CS and CH3OH suggests that they trace different outflowing material, due either to different chemical conditions or to different excitation conditions.
In summary, for this intermediate-mass protostar, both CS and CH3OH are not good tracers of the dense core at ambient velocities but of the interaction of the molecular outflow with the core. This scenario is different from the low-mass case, where the high-density gas surrounding the protostar is clearly tracing the dense core at ambient velocities. Thus, in order to study the kinematics of the dense core associated with BIMA 2, observations of different high-density tracers are needed.
4.3 BIMA 3
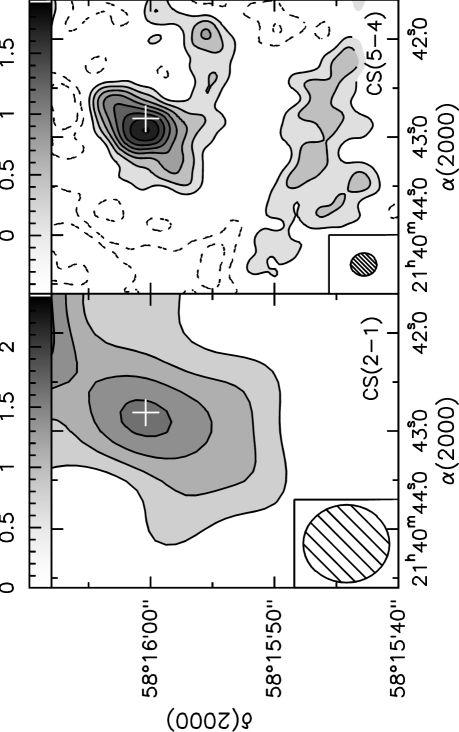
The molecular core associated with the YSO BIMA 3 has been clearly detected in CS (=21) and CS (=54), and marginally, in CH3OH (=54-1) (see Figs. 2 and 10). However, no molecular outflow was found in association with it in Paper I. This core is well defined but it is clearly at a velocity different to that of the BIMA 1 and BIMA 2 cores, as shown by the spectra (Fig. 2) and by the different moment maps of the velocity field. The of this core is around km s-1. The CS (=54) integrated emission shows a northwest-southeast flattened core, which has a deconvolved size of , or AU at the distance of the source, at a P.A. (see Fig. 10).
CS (=54) PV cuts done roughly in the direction of this elongation (P.A.) and in the direction perpendicular (P.A.) are shown in Figure 11. These diagrams are similar to those of BIMA 1 (Fig. 4), and thus, they could be indicative of collapse or expansion of the molecular core. The CS (=54) PV cuts could not be properly fitted by our simple model (the CH3OH emission is too marginal to include it in the fit). This suggests a non-uniform density distribution of the circumstellar material around BIMA 3, which might be due to fragmentation and the presence of subcores within BIMA 3. Alternatively, the infall process in BIMA 3 could be weaker than in BIMA 1.
4.4 Evolutionary stage of the dense cores
A detailed study of the emission of the molecular cores at ambient velocities surrounding the intermediate-mass protostar IRAS 21391+5802 has allowed us to infer or confirm the evolutionary stage of the cores studied in Paper I.
For YSO BIMA 1, we suggest a model for the CS and CH3OH emission, proposing that it is a low-mass object undergoing collapse. From the CO (=10) data (Paper I) we estimated that the dynamical timescale for the north-south molecular outflow centered at the position of BIMA 1 is of the order of 104 years. Such a value is consistent with dynamical timescales estimated for outflows driven by Class 0 objects (e.g. André et al. andre00 (2000); Richer et al. richer00 (2000)). Near BIMA 1 the detection of a CS (=21) bipolar outflow suggests the existence of a yet undetected YSO, BIMA 1W. The dynamical timescale estimated for the CS (=21) outflow is 1–2 years, which suggests that the powering object is also a very YSO. However, further observations are required in order to confirm this new source and derive its properties.
We found that the CS and CH3OH emission associated with YSO BIMA 2 is strongly disturbed by the outflow, indicating that the protostar is in a very active stage of mass loss, which confirms that this intermediate-mass object is a very young stellar object, probably a Class 0 object. The dynamical timescale estimated for the CO (=10) east-west molecular outflow driven by BIMA 2 (Paper I) is of the order of 104 years, which also confirms that BIMA 2 is a very YSO.
Regarding YSO BIMA 3, it is much less massive (; Paper I) than BIMA 2 (; Paper I), and its emission is more compact. This core is associated with maser emission (Tofani et al. tofani95 (1995)) and centimeter continuum emission (Paper I). Both are clear signposts of star formation and indicate that the outflowing phase has already started. Furthermore, the detection of CH3OH, although marginal, indicates the occurrence of shocks in this core, likely produced by an outflow, although can also indicate mantle evaporation due to the heating from the protostar. However, although those observations suggest that BIMA 3 is a YSO, no large scale molecular outflow emission has been detected, and no clear and conclusive infall evidence is visible from the PV plots (see Fig. 11). Thus, both infall and outflow are probably weaker for BIMA 3 than for BIMA 1, which suggests that BIMA 3 would be a more evolved object, possibly a low-mass Class I object. The molecular outflows powered by such objects are usually much weaker than the ones driven by Class 0 objects (e.g. Bontemps et al. bontemps96 (1996)), which would explain the non detection of the molecular outflow toward BIMA 3.
None of the YSOs BIMA 1, BIMA 2, or BIMA 3 has been detected at , , or band through the infrared 2MASS survey. However, in the immediate vicinity of the YSOs there are other infrared (proto)stellar sources detected at band (m). This means that in a relatively small region there are very young stellar objects, detected at millimeter wavelengths (the BIMA sources) together with more evolved young objects (the 2MASS sources).
5 Conclusions
We conducted a kinematical study and modeled the gas emission of the molecular cores at ambient velocities surrounding IRAS 21391+5802, an intermediate-mass protostar embedded in the core of IC 1396N. The high-density gas has been found in association with three dense cores associated with the YSOs BIMA 1, BIMA 2, and BIMA 3.
For the YSO BIMA 1, the integrated emission of CS (=54) and CH3OH (=54-1) shows an elongated core at a P.A. of , perpendicular to the outflow axis. We modeled the gas emission by considering a spatially infinitely thin ring with infall and rotation seen edge-on by the observer, with the intensity and infall velocity distributions being power laws of the radius. The best fit was obtained with the intensity proportional to , an infall velocity km s-1, and a rotation velocity km s-1. Assuming that the infalling material is in free fall, the dynamical mass required is 0.16 , which is similar to the total (circumstellar + protostar) mass in the core.
The CS (=21) emission toward BIMA 1 peaks at a position west from that of the 3.1 mm continuum, CS (=54), and CH3OH emissions. The high-velocity CS (=21) emission is tracing outflowing gas at moderate velocities ( km s-1). The center of symmetry of this CS outflow is near the CS (=21) emission peak. This outflow could be powered by a yet undetected YSO, BIMA 1W, or alternatively could be part of the BIMA 1 molecular outflow.
The CS and CH3OH emission associated with the intermediate-mass protostar BIMA 2 are not tracing the dense core but they are highly perturbed by the bipolar outflow even at velocities close to the systemic value. This confirms that the protostar is in a very active stage of mass loss, and also supports the idea that intermediate-mass outflows interact more dramatically with the dense gas surrounding the protostar than those driven by low-mass protostars. It also suggests that CS and CH3OH are likely not good tracers for studying the properties of dense cores associated with intermediate-mass protostars.
The core associated with BIMA 3 is at a systemic velocity different to that of the BIMA 1 and BIMA 2 cores. The CS (=54) integrated emission shows a northwest-southeast flattened core. The lack of molecular outflow and of clear evidence of infall suggests that both outflow and infall are weaker than in BIMA 1. Thus, BIMA 3 is probably a more evolved, Class I, object.
CS (=54) PV cuts are similar to those of BIMA 1, and thus, they could also be indicative of collapse of the molecular core, with an infall velocity of km s-1 at a radius of 1000 AU. This infall velocity corresponds to a dynamical mass of 0.14 , comparable to the total mass.
Acknowledgements.
We thank the referee Debra Shepherd for her valuable comments. RE acknowledges support from Generalitat de Catalunya grant 2002BEAI400032. RE, JMG, MTB are partially supported by MCyT (Spain) grant AYA2002-00205. This research has made use of the NASA/IPAC Infrared Science Archive, which is operated by the Jet Propulsion Laboratory, California Institute of Technology, under contract with the National Aeronautics and Space Administration.References
- (1) Anglada, G. 1996, in ASP Conf. Ser. 93, Radio Emission from the Stars and the Sun, eds. A. R. Taylor & J. M. Paredes (San Francisco: ASP), 3
- (2) André, P., Ward-Thompson, D., & Barsony, M. 2000, Protostars and Planets IV, eds. V. Mannings, A. P. Boss, & S. S. Russell (Tucson: University of Arizona Press), 59
- (3) Bachiller, R., Codella, C., Colomer, F., Liechti, S., & Walmsley, C. M. 1998, A&A, 335, 266
- (4) Beltrán, M. T., Girart, J. M., Estalella, R., Ho, P. T. P., & Palau, A. 2002, ApJ, 573, 246 (Paper I)
- (5) Bontemps, S., André, P., Terebey, S, & Cabrit, S. 1996, A&A, 311, 858
- (6) Cabrit, S., & Bertout, C. 1992, A&A, 261, 274
- (7) Chen, H., Fukui, Y., & Yang, J. 1992, ApJ, 398, 544
- (8) Girart, J. M., Estalella, R., Viti, S., Williams, D. A., & Ho, P. T. P. 2001, ApJ, 562, L91
- (9) Jorgensen, J. K., Schöier, F. L., & van Dishoeck, E. F. 2004, A&A, 415, 1021
- (10) Looney, L. W., Mundy, L. G., Welch, W. J. 2000, ApJ, 529, 477
- (11) MacLaren, I., Richardson, K. Mn., & Wolfendale, A. W. 1988, ApJ, 333, 821
- (12) Mannings, V., & Emerson, J. P. 1994, MNRAS, 267, 361
- (13) Matthews, T. J. 1979, A&A, 75, 345
- (14) Ohashi, N., Hayashi, M., Kawabe, R., & Ishiguro, M. 1996, ApJ, 466, 317
- (15) Ohashi, N., Kawabe, R., Ishiguro, M., & Hayashi, M. 1991, AJ, 102, 205
- (16) Ohashi, N., Lee, S. W., Wilner, D. J., & Hayashi, M. 1999, ApJ, 518, L41
- (17) Richer, J., Shepherd, D., Cabrit, S., Bachiller, R., & Churchwell, E. 2000, Protostars and Planets IV, eds. V. Mannings, A. P. Boss, & S. S. Russell (Tucson: University of Arizona Press), 867
- (18) Schwartz, R. D., Gyulbudaghian, A. L., & Wilking, B. A. 1991, ApJ, 370, 263
- (19) Shepherd, D. S., & Watson, A. M. 2002, ApJ, 566, 1
- (20) Tofani, G., Felli, M., Taylor, G., & Hunter, T. 1995., A&A, 112, 299
- (21) Wright, M. C. H. 1996, BIMA memoranda No 45