11email: tsutomu.takeuchi@oamp.fr 22institutetext: Kwasan Observatory, Kyoto University, Yamashina-ku, Kyoto, 607–8471, Japan
22email: ishii@kwasan.kyoto-u.ac.jp
Dust emission model of Lyman-break galaxies
Lyman-break galaxies (LBGs) contain a non-negligible amount of dust. Takeuchi et al. (2003a) (T03) constructed a model of the infrared spectral energy distribution (SED) for very young galaxies by taking into account the dust size distribution in the early stage of galaxy evolution, which can be different from that of present-day evolved galaxies. We applied T03 model to LBGs and constructed their expected SED. In order to examine the grain size distribution of dust, we calculated the SEDs based on two distinct type of the distribution models: a single-sized distribution and a power-law distribution with a slope of . We found that the single-sized and power-law dust size distributions yield a very similar detectability of LBGs at the submillimetre (submm). We also found that galaxies with a power-law dust distribution have much less flux at mid-infrared (MIR) than the other. By making use of this fact we can explore the dust grain size distribution in high-redshift galaxies through (observer-frame) FIR observations. Then, we applied the model to a gravitationally lensed LBG MS 1512cB58 (cB58), a unique probe of the dust emission from LBGs. Observations by SCUBA suggest that the dust is hot in this galaxy. Our model framework well reproduced the hot dust temperature under a natural assumption for this galaxy. We also examined the detectability of LBGs at submm wavelengths in an eight-hour deep survey by ALMA. The LBG population with an age and a SFR can be detected in such a survey. By integrating over their redshifted SEDs with the observed luminosity functions, we obtained the contribution of LBGs to the cosmic infrared background radiation (CIRB). Although they have non-negligible amount of dust, their contribution was found to be small, especially in the FIR m. Thus, we need a strongly obscured population of galaxies which contains a large amount of star formation, at some epoch in the history of the universe.
Key Words.:
dust, extinction – galaxies: evolution – galaxies: formation – galaxies: high redshift – infrared: galaxies.
1 Introduction
Star formation and metal enrichment in an early stage of galaxies are of great importance to understand the history of the universe. With the aid of a variety of new observational techniques and large facilities, studies on such young galaxies are being pushed to higher and higher redshifts. The surveys that have most efficiently secured large population of galaxies at a redshift are those that exploit the Lyman break to identify high- candidates: Lyman-break galaxies (LBGs) (Steidel et al. 1999, 2003).
Even in LBGs, there is clear evidence that they contain non-negligible amount of dust (e.g., Sawicki & Yee 1998; Adelberger & Steidel 2000; Calzetti 2001; Shapley et al. 2001). Dust grains absorb stellar light and re-emit it in the far infrared (FIR), hence it is crucial to evaluate the intensity and spectrum of FIR emission from galaxies for understanding their star formation properties (e.g., Buat et al. 2002; Hirashita et al.2003, and references therein). Despite its importance, there still remains a large uncertainty in our understanding of the properties of dust emission from LBGs (for a review, see Calzetti 2001).
Ouchi et al. (1999) have estimated the submm flux from LBGs and, for the first time, found empirically that the dust temperature should be high in order to explain their non-detection by SCUBA. Chapman et al. (2000) also pointed out that the SCUBA submm flux of LBGs were much weaker than that expected from their UV spectral slope index. They discussed that it is hard to reconcile unless dust temperature is higher than that of local starbursts (K). For the analysis of SCUBA flux of a highly lensed LBG, MS 1512cB58 (hereafter cB58), Sawicki (2001) (S01) performed a thorough survey of the parameter space of dust temperature and emissivity index, and concluded that the dust temperature and/or emissivity index in cB58 is substantially higher than those seen in local galaxies.
Another important issue to be addressed is the contribution of dust emission from LBGs to the cosmic infrared background (CIRB) ( Gispert et al.2000; Hauser & Dwek 2001; Takeuchi et al. 2001a; Totani & Takeuchi 2002). The star formation rate (SFR) density of LBGs is now believed to increase toward redshifts , if we ‘correct’ dust extinction (Steidel et al. 1999). Then, the re-emission from dust in LBGs is an interesting target to examine. Some resent observations suggest that their contribution to the total CIRB is not very large, at most % (Webb et al. 2003). If so, there must be other contributors to the CIRB, which should bear an intense star formation comparable or even larger than that in LBGs. Hence, theoretical prediction of the dust emission plays an important role in the interpretation of the cosmic SFR and the CIRB.
In order to address these issues and to make a consistent picture of the dust emission from LBGs, we must consider their star formation history, chemical evolution and dust mass evolution, radiation process with nonequilibrium temperature fluctuation, and dust composition properly. Recently, (Hirashita et al.2002) (H02) have developed a model for the evolution of dust content in very young galaxies (age ). Type II supernovae (SNe II) are the dominant source for the production of dust grains in young star-forming galaxies (Dwek & Scalo 1980). H02 have modeled the evolution of FIR luminosity and dust temperature in such a young starburst on the basis of SNe II grain formation model of Todini & Ferrara (2001) (TF01).
Takeuchi et al. (2003a) (T03) subsequently constructed a model of infrared (IR) spectral energy distribution (SED) of galaxies starting from the H02 model. It has been believed that the size of dust grains formed in SNe II cannot be as large as m (TF01), and host galaxies are too young for grains to grow in the interstellar space. T03, for the first time, properly considered the dust size distribution peculiar to the very early stage of galaxy evolution, and construct a model of the IR SED of very young galaxies. T03 model successfully reproduced the peculiar SED of a local metal-deficient galaxy SBS 0335052 (), which we regarded as an analogue of genuine young galaxies. However, in clear contrast, recently Nozawa et al. (2003) has presented a new model of dust grain formation in SNe II, which produce larger grains (m) than the previously believed conjecture. Their dust has a broken power-law grain size distribution. Based on the known physical condition in LBGs, we discuss the possible geometrical configuration of dust, and show that we can test the dust size distribution at high redshift by an observation of LBGs in the IR and submm. Such observations will be soon possible by, e.g.,SPICA, Herschel, SMA and ALMA.
The layout of this paper is as follows: In Section 2 we briefly describe our model framework. We present our basic results for the SEDs of LBGs in Section 3. Related discussions are given in Section 4. First we focus on a gravitationally magnified LBG MS 1512cB58, a unique probe of the internal physics of LBGs. Then we consider some cosmologically important problems. Section 5 is devoted to our summary and conclusions.
2 SED Model for Extremely Young Galaxies
2.1 SED construction
Since H02 treats the evolution of dust content in a galaxy younger than yr, the only contributor to the total dust mass () in a young ( yr) galaxy is the supply from SNe II. The rate of SNe II is given by
| (1) |
where is the SFR at age (we define at the beginning of the star formation), is the initial mass function (IMF), is the lifetime of a star whose mass is , and it is assumed that only stars with produce SNe II. H02 assume a constant SFR, , and a Salpeter IMF. Then the rate of increase of is written as ( is the typical dust mass produced by one SN II). H02 adopted .
In general we must take into account not only the production but also destruction of dust grains. However, the timescale of dust destruction is much longer than that we consider in this work, hence the effect of the destruction appears to be negligible. Detailed evaluation can be found in H02 [their eq. (2)].
Dust grains are roughly divided into silicate and carbonaceous ones. TF01 have presented that the sizes of silicate and carbonaceous grains formed in SN II ejecta to be about 10 Å and 300 Å, respectively. Classical studies claimed that the dust grains originating from SNe II cannot be as large as those formed in the atmosphere of evolved AGB stars or grown in the diffuse interstellar space (Kozasa & Hasegawa 1987; TF01). In this case, the discrete and small grain sizes make the appearance of the IR SED of young galaxies drastically different from that of aged normal galaxies. On the other hand, recently Nozawa et al. (2003) have proposed a drastically different picture of dust size distribution from SNe II. They showed that, under some condition, dust grains can grow large even within the expansion timescale of SNe ejecta. Consequently, their size distribution of grains have a broken power-law shape. For comparison, we also consider this case by using the simple description of Galactic dust ( Mathis et al1977) as
| (2) |
for both grain species, i.e., silicate or carbon dust. Here we note that we do not include polycyclic aromatic hydrocarbons (PAHs) in our dust grain model, because they are rarely found in metal-poor systems and/or in intense radiation environments (e.g., Madden 2000; Galliano et al. 2003).
It is well accepted that very small grains are stochastically heated, that is they cannot establish thermal equilibrium with the ambient radiation field (Draine & Anderson 1985; Draine & Li 2001): the heat capacity of very small grains is too small to maintain its temperature until the next photon impinges. As a result, the temperature of a grain varies violently in time, and we can define a distribution of the instantaneous temperature of a grain, which will be introduced in eq. (9). For the heat capacity of a grain, , we apply the multidimensional Debye model according to Draine & Li (2001).
Then we calculated the temperature distribution of dust as a function of size by Monte Carlo simulations, following Draine & Anderson (1985). The UV radiation field strength is determined by the history of OB star luminosity of H02 and the size of the star forming region . For the geometry, we assume that the OB stars are concentrated in the centre of the system, and dust is assumed to be distributed as a shell. We regard the radius of the sphere, as the size of the spherical star forming region, . The flux is expressed by , hence the UV energy density, , is obtained by . The spectral UV energy density is calculated from the assumed spectrum of the UV radiation field.
The rate at which a grain absorbs a photon with energy is expressed as111We note that there are two typographic errors in Equations (13) and (14) of T03. The equations we show here are the correct expressions.
| (3) |
where is the absorption efficiency of a dust grain. We used the values proposed by Draine & Lee (1984) for of silicate and carbon grains.
The heating is represented as follows:
| (4) |
where is the peak temperature achieved by a grain hit by a photon with energy , and is the grain temperature just before absorption. On the other hand, the grain cools through radiation as
| (5) |
where is the blackbody function represented as a function of wavelength.
From Equations (3), (4), and (5), we obtain the sample path of a grain temperature as a function of time.
The total mass of each grain component is given by TF01. The mass ratio we adopt here is (H02). With this value and material density of each species ( and : Draine & Lee 1984), we obtain the normalization of the dust size distribution ,
| (6) |
where subscript denotes the species of dust, sil or C, and is the mass fraction of dust of species . The total number of grains, , is expressed as
| (7) |
For the TF01 dust distribution, is fixed for each dust component to a specific value , i.e., . In this case, with Equations (7) and (6), the normalization reduces to
| (8) |
We drop the prime in the following expressions.
Total IR emission spectrum from a galaxy is then calculated by superposing each of the continuum from silicate and carbonaceous grains,
| (9) |
where is the temperature probability density function, i.e., the fraction of time for which a grain with species in a UV radiation field with energy density stays in a temperature range . The starburst age is incorporated with (i.e., ) and through and . Here we put a constraint that the amount of absorbed light is equal to the FIR luminosity. Lastly, if the dust opacity is very large, then self-absorption occurs, and even MIR radiation from dust is absorbed by the dust itself. We treat the extinction as given by a shell model. We crudely approximate the dust opacity and extinction to the first order as
| (10) | |||||
| (11) |
The absorbed light is re-emitted at longer wavelengths, mainly in the submm, and consequently, the SED is deformed by the self-absorption. Final SED is obtained via this absorption–re-emission process. For further technical details, see T03.
2.2 Input parameters for LBGs
Here we consider the input physical parameters in the model calculation for LBGs. We adopted the dust grain sizes and for our canonical model. They are the same as those for SBS 0335052 and I Zw 18 used in T03, because LBGs are thought to be young, and hence we expect similar dust properties to them.
The SFR of LBGs spreads over the range of with a median value of (e.g., Erb et al. 2003). We assumed a constant SFR up to the age shorter than yr, which may be a good approximation (e.g., Baker et al. 2004). Within the young age of yr, neither SNe I nor RGB/AGB stars contribute to the dust production. Other dust growth mechanism in the interstellar medium cannot work effectively, either (see, e.g., Whittet 1992). Thus, the basic framework of T03 model is valid for LBGs.
The most important information to calculate the IR SED is the effective size of the star forming region, but it is the most uncertain quantity at the same time. It is still beyond the possibility of the present facilities to measure the size directly from observations. The mean half-light radius of LBGs is estimated to be from HST observations (Erb et al. 2003), hence it may be a general value for LBG populations. The similarity between the rest UV and optical morphologies suggests that the dust in LBGs may not preferentially obscure particular regions in these galaxies (Dickinson 2000; Calzetti 2001). Then we can safely use the galaxy radius as the radius of a star-forming region, , i.e., . We will revisit this issue with more physical considerations in Section 4.
3 Results


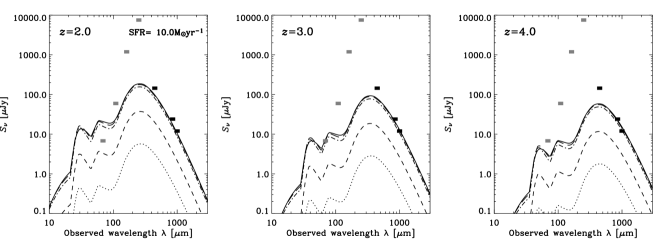
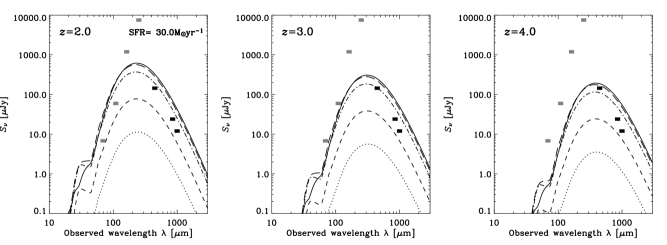
Based on the above-mentioned settings, we calculated the IR SEDs of LBGs with , 30, and as representative cases. We traced the evolution of the SEDs from to .
Figure 1 shows the evolution of the SED for the single-sized dust size distribution. The dust opacity is found to be not very large, and consequently, the silicate features appeared in emission. Only in the case of , these features becomes a significant absorption after . Most of the LBGs have a lower SFR than , hence basically we can expect the silicate emission band feature in their MIR spectra. Along the same line, since the self-absorption is not significant for LBG spectra, we also expect a strong MIR continuum emission from LBGs if the single-sized dust distribution takes place.
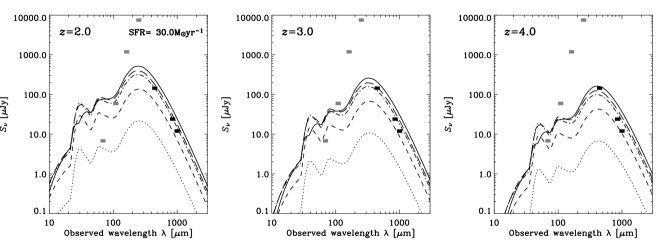
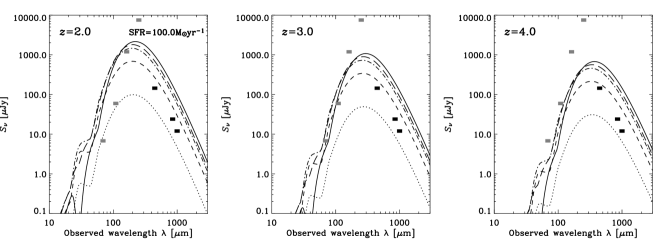
For comparison, we next show the evolution of the SED for the power-law dust size distribution in Figure 2. In this case, an obvious difference is that the MIR radiation is an order of magnitude weaker than that for the single-sized dust results. This is because the power-law size distribution has much smaller amount of small grains (Å) than the single-sized distribution. The extinction properties are similar to that of single-sized dust case, despite the drastic difference of the SEDs. Thus, if the geometrical configuration of dust is similar among LBGs, the MIR observation can be a strong tool to explore the size distribution of dust grains.
4 Discussions

4.1 MS 1512cB58
It is still difficult to compare a model prediction for young galaxies to observational data of LBGs. Among the LBGs, a typical LBG cB58 is a fortunate exception: it has been observed in various wavelengths (e.g., Ellingson et al. 1996; Bechtold et al. 1997; Nakanishi et al. 1997; Teplitz et al. 2000; Baker et al. 2001), because of a strong magnification by gravitational lensing (factor : Seitz et al. 1998). We adopt a commonly used value of 30 for magnification. The half-light radius of cB58 is estimated to be kpc from a detailed image reconstruction Seitz et al. (1998)222Throughout this paper, we adopt a cosmology with , where .
From spectroscopic observations of nebular lines, the SFR of cB58 is estimated to be (Pettini et al. 2000). The age of major star formation in cB58 was estimated to be (Matteucci & Pipino 2002). An older age estimate of Myr is given by (Baker et al. 2004), and we adopt both of these values for our calculations. This is broadly consistent with other observational suggestions (e.g., Pettini et al. 2000; Ellingson et al. 1996), and significantly younger than the median value of those of general LBGs (Myr: Shapley et al. 2001).
The optical extinction of cB58 is estimated to be (Pettini et al. 2000; Ellingson et al. 1996; Teplitz et al. 2000). Emission from dust in cB58 is measured at two wavelengths: Sawicki (2001) observed this galaxy at m by SCUBA on the JCMT, and no signal was detected above level of 3.9 mJy. Another observation by SCUBA (van der Werf et al. 2001) detected a m flux to be mJy. Baker et al. (2001) reported a detection at 1.2 mm by MAMBO (Max-Planck Millimeter Bolometer) array, and the flux was mJy ().
The submm flux from the foreground cD galaxy (6′′ away from cB58) may contaminate the observed data (Sawicki 2001). After careful examination of the new submm mapping data, it has been concluded that the contamination is % at m and % at 1.2 mm, respectively (Baker et al. 2004), though there still remain some other uncertainties (e.g., Baker et al. 2004 discusses a possible contribution of emission lines or background sources. We may need an interferometric observation to solve this problem). In addition, the uncertainties in the lensing correction and in the UV based SFR estimation may also be as large as that of the contamination correction. We should keep these issues in mind in the following discussions.
4.1.1 IR SED
We use a commonly accepted value of as a SFR (Baker et al. 2004) and assume the SFR to be constant in time. For the age of the major star formation in cB58, as we mentioned above, we adopt Myr and Myr. Because of its young age, dust is predominantly produced by SNe II and the framework of T03 model is again valid for cB58. The half-light radius of the reconstructed image of cB58 ( Seitz et al. 1998) is very similar to that of general LBGs ( Erb et al. 2003).
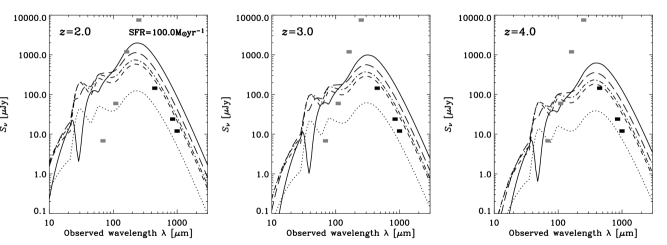
We show the model SED of cB58 in Figure 3. Left panel presents the SED with a single-sized dust, and Right panel shows the SED with a power-law distribution (Equation 2), respectively. Symbols represent the measured flux densities reported by Sawicki (2001) (upper limits), Baker et al. (2001) (open triangles) and van der Werf et al. (2001) (open squares). There are two open symbols at each wavelength: the upper open symbols are the measured values, and the lower ones represent the flux densities corrected for the possible contamination by the point source at the lens cluster center (Baker et al. 2004). It is still not clear whether the point source is the cD galaxy or not (Baker et al. 2004).
The apparent peak of the SED is located at a wavelength shorter than m at the restframe of cB58. Actually, the dust temperature is higher than that of the local () sample of normal galaxies observed by SCUBA, but comparable to the most intense dusty starbursts (Dunne & Eales 2001). It is mainly because of an intense UV radiation field of cB58 and low dust opacity. The mean dust temperature of the power-law dust model is lower than that of the single-sized dust model, but the superposition makes the submm part of its final SED similar to that of a hot dust emission. We find that both models predict slightly lower flux densities than observed. Considering the uncertainties mentioned above, we conclude that the model is roughly consistent with observations within a few factors. Some authors claim that the submm flux densities of cB58 is surprisingly low (e.g., Baker et al. 2004), but in our framework, they are naturally explained by our model framework (the model predicts even smaller fluxes). The power-law model predicts a slightly larger flux at submm wavelengths, but it is difficult to distinguish the two models only by submm observations.
The prominent feature in the MIR is the silicate band of m. For the single-sized dust model, the NIR–MIR part of the SED is dominated by the radiation from small silicate grains, and FIR–submm part by larger carbonaceous grains. In contrast, relatively lower abundance of small grains in the power-law model makes the MIR radiation considerably weaker.
4.1.2 Extinction and size of the star-forming regions

Besides IR emission, dust extinction is a fundamental quantity to specify the dust properties. We relate the extinction in magnitude () with (Equation 10) by
| (12) |
When we adopt the , the extinction at -band is . Again we adopt the extinction curve of (Cardelli et al.1989), we expect from our model. The measured color excess is , hence by adopting as a representative value in a diffuse ISM (Krügel 2003), we have , which is in perfect agreement with our model prediction. (Vijh et al.2003) performed a sophisticated analysis of the attenuation in LBGs by using a radiative transfer model. They showed the attenuation is in the range of at , and is well represented by Calzetti law ( Calzetti et al.1994). Our extinction estimate is also consistent with their result. They also showed that the shell geometry is appropriate for the dust in LBGs, which is in accordance with our assumption. Thus, we see that the extinction in the visible stellar system of cB58 is consistent with its dust amount and spatial scale of .
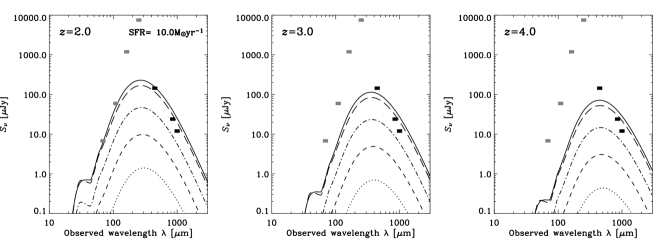
Then, can a heavily hidden star formation exist in this galaxy? Actually, SBS 0335052 hosts a completely extinguished starburst ( Hunt et al.2001; Plante & Sauvage 2002), and its SED is well understood by T03 model. To consider this problem, we have calculated the SEDs with various smaller star-forming region sizes. This means that the bulk of the dust in cB58 could be confined in a small part of its volume. They are shown in Figure 4. Dotted, dashed, and dot-dashed lines are those with pc, 120 pc, and 30 pc, respectively. Smaller sizes make the opacity in the region significantly larger, and the conversion from UV to FIR becomes much more efficient. Considering the observational upper limits, the allowed smallest size is pc, with a possible range of if we take into account the uncertainties in the estimates of the SFR and lensing magnification.
It has been pointed out that the galactic wind can transport the dust into larger radius (T03). Actually, precise spectroscopy by Pettini et al. (2003) clearly shows the outflowing motion of gas with a velocity of in cB58. They consider the wind and extinction, and suggest that the superwind shell size is comparable to the galaxy size. Hence the wind crossing timescale is . If dust closely couples with the gas motion, it is difficult to keep dust grains confined in a region much smaller than the galaxy size through its age of . Strong radiative pressure may also expand the dusty region, as suggested by (Inoue 2002). Here we should comment the effect of the patchiness of dust, which may be realistic for LBGs. In the FIR, since the opacity of dust is small (), the FIR emission escapes from a galaxy without significant absorption. Then the flux is controlled simply by energy conservation, and the patchiness does not affect the result significantly (see, e.g., Witt et al. 2000; Gordon et al. 2000).
Together with its high SFR and SN rate, which are considered to provide a large amount of radiative and kinetic energy to gas-dust system, we conclude that a compact dusty star formation may not be plausible for cB58. Hence, the dust configuration of cB58 may be similar to the present model. This suggests that we can safely discriminate the effect of dust size distribution on the SED from that of the configuration and geometry of dust in the galaxy. Again, this conclusion can hardly be affected by the clumpiness of dust, just the same reason mentioned above.
4.1.3 Follow-up observations of cB58
Our single-sized dust model provides an SED with bright continuum in the rest NIR–MIR regime, hence we expect that cB58 will be detected by MIR–FIR observations (m). At present, Spitzer Space Telescope333URL: http://sirtf.caltech.edu/. MIPS and ASTRO-F444URL: http://www.ir.isas.ac.jp/ASTRO-F/index-e.html. IRC will be suitable instruments for such observations. For example, both instruments have the same level of sensitivity around m, and the flux of 0.06–0.08 mJy will be detected. For FIR, both can detect 0.8–1 mJy at m. Therefore, the MIR continuum can be detected by the future MIR–FIR observations if the single-sized dust takes place
On the other hand, if the power-law distribution takes place, the flux densities will be an order of magnitude smaller than those of our canonical model, because the number of the stochastically heated grains is reduced. As we mentioned, the uncertainty caused by dust geometry is not very large for a LBG because the configuration becomes more or less shell-like in these galaxies just as a scale-up of SBS 0335052. Therefore, the MIR observation will be a strong test for the size distribution.
We should note, however, that even by Spitzer, confusion limit can be severe in FIR (e.g., Ishii et al.2002, Dole et al.2003; Takeuchi & Ishii 2004). Larger space IR facilities such as Herschel Space Observatory555URL: http://www.rssd.esa.int/herschel/. or SPICA666URL: http://www.ir.isas.ac.jp/SPICA/index.html., and IR interferometry missions are longed to improve the confusion limit. At longer wavelengths, of course ALMA will be useful.
4.2 Observability of the dust emission from LBGs
Considering the non-negligible extinction in LBGs, their energy budget radiated in the IR should be significant (Adelberger & Steidel 2000; Calzetti 2001). Stimulated by the consideration, the relation between LBGs and dusty starbursts, another representative star-forming galaxy population at , has gathered the researchers’ attention. In fact, however, most of the LBGs have not been detected by SCUBA observations (Chapman et al. 2000; Webb et al. 2003), except for a few extreme cases (e.g., Chapman et al. 2002). Calzetti et al. (2000) pointed out the possibility that the dust is hot in LBGs based on the observed SED of a low-metallicity galaxy Tol 1924416. Hot dust in LBGs was also suggested by S01 from his observation of a lensed LBG cB58. Since their consideration is empirical, and we need some explanation for the hot dust, if it exists. As seen in the above, our model naturally predict a high dust temperature. Here, we discuss how LBGs look like in the IR/submm wavelengths. It is also useful to estimate the observational feasibility of LBGs by forthcoming submm facilities like ALMA.
The observed flux density of a source at observed frequency, is obtained by
| (13) |
where is the luminosity distance corresponding to a redshift , and and are observed and emitted frequency, respectively. We show the observed IR/submm SEDs of LBGs at , 3, and 4 in Figures 5–10. Figures 5–7 represent the SEDs for the single-sized dust size distribution, and Figures 8–10 for the power-law distribution (Equation 2). The thick black short horizontal lines indicate the 3- detection limits for 8-hour observation by ALMA. Here we assumed 64 antennas and three wavelength bands, 450, 850, and m. We also show the 3- source confusion limit of Herschel at 75, 160, 250, and 350m bands by thick gray horizontal lines. These limits are based on ‘the photometric criterion’ of ( Lagache et al.2003). (Ishii et al.2002) also report similar estimates for the confusion limits.777 Generally, in a sky region suitable for cosmological surveys, the cirrus confusion is less severe than the galaxy confusion (see, e.g., Dole et al.2003).
From Figures 5–10, we recognize that the detectability of these galaxies at submm bands are not significantly dependent on the redshift. This is because of the ‘negative -correction’, well-known in the field of submm astronomy. On the contrary, the galaxy age and SFR are more important for the detection of LBGs. If the age and , a LBG can be detected at a wide range of redshifts in the submm.
In general, the longer the wavelength is, the easier the detection becomes for millimetre (mm) observations. In the submm and mm wavelengths, the detectability is not quite different between LBGs with single-sized dust and those with power-law dust. It is a natural consequence that the radiation in these wavelengths is dominated by relatively large dust grains that can establish a thermal equilibrium with the radiation field.
The apparent peak of the dust emission lies in a relatively short wavelength of about m at . Thus, the accumulated background radiation spectrum from LBGs may have its peak in the FIR. The expected dust emission from LBGs is, however, too faint to be detected even by Hershel deep survey, except some rare exceptionally bright sources, e.g., lensed galaxies like MS 1512cB58, or in the case of extremely high SFR (in order to reach the confusion limits, unrealistic integration time might be required). Hence, still more powerful instruments at these wavelengths would be required.
In the shorter wavelengths (MIR–FIR), the size distribution affects the possibility of detection drastically, just as we have seen in the case of cB58 (4.1). Surveys in the MIR by Spitzer and ASTRO-F will be desirable to detect these objects. These observations are important to compare the overall SEDs of LBGs directly with those of “local analogues”, such as SBS 0335052 and I Zw 18. Existence of such local galaxies with hot dust is reported by recent studies (see e.g., Calzetti et al. 2000; Takeuchi et al.2003b). Similarity and difference between them provides us a unique clue to the physics of galaxy formation.
4.3 Contribution of LBGs to the CIRB
The implication of hot dust also offers a potentially important cosmological insight into high- galaxies: if dust in high- object is as cool as usually assumed, then we cannot expect a high comoving SFR density because in a realistic cosmology the cosmic IR background (CIRB) spectrum strongly constrains the high- IR emission (Takeuchi et al. 2001a). However, very hot dust in such high- object reconciles the CIRB constraint with high SFR, and allows vigorous star formation hidden by dust in the early Universe (Totani & Takeuchi 2002).
Actually, non-detection of LBGs in the submm wavelengths (Chapman et al. 2000; Webb et al. 2003) suggests the hot dust temperature. Considering the non-negligible extinction in these galaxies, their energy budget radiated in the IR is significant (Adelberger & Steidel 2000; Calzetti 2001). However, their contribution to the submm radiation cannot be quite large because of the high dust temperature. In fact, the contribution to the extragalactic submm background radiation has been suggested to be at most % (Webb et al. 2003).
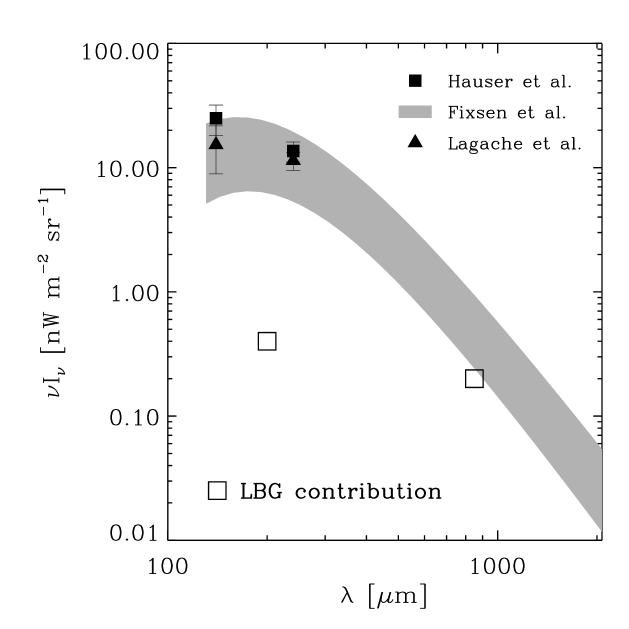
Using our model SED and the luminosity function of LBGs (Shapley et al. 2001), we calculate the integrated IR light from LBGs to the CIRB. In order to have a rough estimate, we correct the extinction to the observed luminosity function, and converted it to the distribution of the SFR by converting the UV luminosity to the SFR according to our model. Here we crudely assumed that all the LBGs have the same star forming region size . We also assumed that the number of LBGs rapidly decreased at .888 Actually, this assumption affect the results little. By using the SFR distribution, we obtained the multiband FIR luminosity function of the LBGs. We finally integrated it over the FIR luminosity to get the CIRB intensity.
Our model predicts at , and at m, respectively. The difference of the dust size distribution does not affect the CIRB spectrum almost at all. This result is shown in Figure 11. The m intensity is quite consistent with the LBG contribution at m estimated by Webb et al. (2003). Since the CIRB intensity at m is much smaller than the measured peak ( at m) Lagache et al. 1999), it strongly supports the existence of heavily obscured dusty galaxy population. Therefore, LBGs are not the dominant population contributing to the CIRB.
Straightforward conversion of the UV radiation from galaxies into the IR by recent models cannot reproduce the strong peak (e.g., Balland et al.2003). In addition, the large energy budget radiated in the IR requires an effective energy release, which may related to starburst phenomena, even if they are nearby galaxies (Takeuchi et al. 2001a; Franceschini et al. 2001; Hauser & Dwek 2001). Therefore, hidden starbursts are necessary to explain the strong evolution of submm source counts (e.g., Takeuchi et al. 2001a, b). At present, redshifts of the starburst population contributing to the CIRB are almost unknown. If the dusty starburst is a low- phenomenon, there must be a strongly obscured era at (Takeuchi et al. 2001a). In this case it is interesting to discuss a possible relation between the activation of star formation and the peak of merger rate in hierarchical structure formation scenarios (e.g., Lacey & Cole 1993; Kitayama & Suto 1996). On the other hand, if the obscured galaxies reside in a high- Universe, it implies that the high- cosmic SFR density may be higher than the dust-corrected value (Steidel et al. 1999) because it would be a sum of the contributions both from LBGs and hidden starbursts.
5 Summary and conclusion
Lyman-break galaxies (LBGs) contain a non-negligible amount of dust. Takeuchi et al. (2003a) (T03) constructed a model of the infrared spectral energy distribution (SED) for very young galaxies by taking into account the dust size distribution in the early stage of galaxy evolution, which can be different from that of present-day evolved galaxies.
In this work, we applied T03 model to LBGs and constructed their expected SED. In order to examine the grain size distribution of dust, we calculated the SEDs based on two distinct type of the distribution models: a single-sized distribution predicted by Todini & Ferrara (2001), and a power-law distribution with a slope of , which is often used to describe the Galactic dust ( Mathis et al1977).
We found that the single-sized and power-law dust size distributions yield a very similar detectability of LBGs at the submillimetre (submm). We also found that the difference of the grain size distribution affects the SED drastically at mid-infrared (MIR) wavelengths. Galaxies with power-law dust distribution have much less flux at MIR than the other. Generally, strong outflow is observed in LBGs, and consequently their geometry of dust configuration might be relatively simple. It reduces the uncertainty of complex radiative transfer, and we can safely explore the dust grain size distribution high-redshift galaxies by (observer-frame) FIR observations.
Then, we applied the model to a gravitationally lensed LBG MS 1512cB58 (cB58), a unique probe of the dust emission from LBGs. Thanks to the large magnification factor, the dust emission has been detected in the submm by SCUBA observations. These observations suggest that the dust is hot in this galaxy. Our model framework well reproduced the hot dust temperature under a natural assumption for this galaxy.
We also examined the detectability of LBGs at submm wavelengths in an eight-hour deep survey by ALMA. The LBG population with an age and a SFR can be detected in such a survey. The detectability of LBGs in the submm is not strongly affected by redshift, because of the well-known negative -correction. Hence, the detected LBG sample will be undoubtedly an ideal sample to study the early evolution of metal and dust content in galaxies.
By integrating over their redshifted SEDs with the observed luminosity functions, we obtained the contribution of LBGs to the cosmic infrared background radiation (CIRB). Although they have non-negligible amount of dust, their contribution was found to be small, especially in the FIR m. Thus, we need a strongly obscured population of galaxies which contains a large amount of star formation, at some epoch in the history of the universe.
Acknowledgements.
First we deeply thank the anonymous referee whose careful comments improved the quality and clarity of this paper very much. This work has been motivated by a stimulating discussion with Marcin Sawicki at a conference in Mykonos island. Akio K. Inoue is kindly thanked for his careful reading of the manuscript. We are greatly indebted to Hiroyuki Hirashita, Veronique Buat, Masato Onodera, Leslie K. Hunt, Andrea Ferrara, Atsunori Yonehara, Tracy M. Webb, Kouichiro Nakanishi, and Ichi Tanaka for their helpful comments and suggestions.References
- Adelberger & Steidel (2000) Adelberger, K. L., & Steidel, C. C. 2000, ApJ, 544, 218
- (2) Balland, C., Devriendt, J. E. G., & Silk, J. 2003, MNRAS, 343, 107
- Baker et al. (2001) Baker, A. J., Lutz, D., Genzel, R., Tacconi, L. J., & Lehnert, M. D. A&A, 372, L37
- Baker et al. (2004) Baker, A. J., Tacconi, L. J., Genzel, R., Lehnert, M. D., & Lutz, D. 2004, ApJ, 604, 125
- Bechtold et al. (1997) Bechtold, J., Yee, H. K. C., Elston, R, & Ellingson, E. 1997, ApJ, 477, L29
- Buat et al. (2002) Buat, V., Boselli, A., Gavazzi, G., & Bonfanti, C. 2002, A&A, 383, 801
- (7) Calzetti, D., Kinney, A., & Storchi-Bergmann, T. 1994, ApJ, 429, 582
- Calzetti et al. (2000) Calzetti, D., Armus, L., Bohlin, R. C., et al. 2000, ApJ, 533, 682
- Calzetti (2001) Calzetti, D. 2001, PASP, 113, 1449
- (10) Cardelli, J. A., Clayton, G. C., & Mathis, J. S. 1989, ApJ, 345, 245
- Chapman et al. (2000) Chapman, S. C., Scott, D., Steidel, C. C. et al. 2000, MNRAS, 319, 318
- Chapman et al. (2002) Chapman, S. C., Shapley, A., Steidel, C., & Windhorst, R. 2002, ApJ, 572, L1
- Dickinson (2000) Dickinson, M. 2000, Phil. Trans. R. Soc. Lond. A, 358, 2001
- (14) Dole, H., Lagache, G., & Puget, J.-L. 2003, ApJ, 585, 617
- Draine & Anderson (1985) Draine, B. T., & Anderson, L. 1985, ApJ, 292, 494
- Draine & Lee (1984) Draine, B. T., & Lee, H. M. 1984, ApJ, 285, 89
- Draine & Li (2001) Draine, B. T., & Li, A. 2001, ApJ, 551, 807
- Dunne & Eales (2001) Dunne, L., & Eales, S. A. 2001, MNRAS, 327, 697
- Dwek & Scalo (1980) Dwek, E., & Scalo, J. M. 1980, ApJ, 239, 193
- Edge et al. (1999) Edge, A. C., Ivison, R. J., Smail, I., Blain, A. W., & Kneib, J.-P. 1999, MNRAS, 306, 599
- Ellingson et al. (1996) Ellingson, E., Yee, H. K. C., Bechtold, J., & Elston, R. 1996, ApJ, 466, L71
- Erb et al. (2003) Erb, D. K., Shapley, A. E., Steidel, C. C., et al. 2003, ApJ, 591, 101
- Fixsen et al. (1998) Fixsen, D. J., Dwek, E., Mather, J. C., Bennett, C. L., & Shafer, R. A. 1998, ApJ, 508, 123
- Franceschini et al. (2001) Franceschini, A., Aussel, H., Cesarsky, C. J., Elbaz, D., & Fadda, D. 2001, A&A, 378, 1
- Galliano et al. (2003) Galliano, F., Madden, S. C., Jones, A. P., et al. 2003, A&A, 407, 159
- (26) Gispert, R., Lagache, G., & Puget, J. L. 2000, A&A, 360, 1
- Gordon et al. (2000) Gordon, K. D., Clayton, G. C., Witt, A. N., & Misselt, K. A. 2000, ApJ, 533, 236
- Hauser & Dwek (2001) Hauser, M. G., & Dwek, E. 2001, ARA&A, 39, 249
- Hauser et al. (1998) Hauser, M. G., Arendt, R. G., Kelsall, T., et al. 1998, ApJ, 508, 25
- (30) Hirashita, H., Hunt, L. K., & Ferrara, A. 2002, MNRAS, 330, L19 (H02)
- (31) Hirashita, H., Buat, V., & Inoue, A. K. 2003, A&A, 410, 83
- (32) Hunt, L. K., Vanzi, L., & Thuan, T. X. 2001, ApJ, 377, 66
- Inoue (2002) Inoue, A. K. 2002, ApJ, 570, 688
- (34) Ishii, T. T., Takeuchi, T. T., & Sohn, J.-J. 2002, in Infrared and Submillimeter Space Astronomy, EDP Sciences, Les Ulis, p.169
- James et al. (2002) James, A., Dunne, L., Eales, S., & Edmunds, M. G. 2002, MNRAS, 335, 753
- Kitayama & Suto (1996) Kitayama, T., & Suto, Y. 1996, MNRAS, 280, 638
- Kozasa & Hasegawa (1987) Kozasa, T., & Hasegawa, H. 1987, Prog. Theor. Phys., 77, 1402
- Krügel (2003) Krügel, E. 2003, The Physics of Interstellar Dust, Institute of Physics Publishing, Bristol
- Lacey & Cole (1993) Lacey, C., & Cole, S. 1993, MNRAS, 262, 627
- Lagache et al. (1999) Lagache, G., Abergel, A., Boulanger, F., Désert, F. X., & Puget, J.-L. 1999, A&A, 344, 322
- (41) Lagache, G., Dole, H., & Puget, J.-L. 2003, MNRAS, 338, 555
- Madden (2000) Madden, S. C. 2000, NewAR, 44, 249
- (43) Mathis, J. S., Rumpl, W., & Nordsieck, K. H. 1977, ApJ, 217, 425
- Matteucci & Pipino (2002) Matteucci, F., & Pipino, A. 2002, ApJ, 569, L69
- Nakanishi et al. (1997) Nakanishi, K., Ohta, K., Takeuchi, T. T., et al. 1997, PASJ, 49, 535
- Nozawa et al. (2003) Nozawa, T., Kozasa, T., Umeda, H., Maeda, K., & Nomoto, K. 2003, ApJ, 598, 785
- Ouchi et al. (1999) Ouchi, M., Yamada, T., Kawai, H., & Ohta, K. 1999, ApJ, 517, L19
- Pettini et al. (2000) Pettini, M., Steidel, C. C., Adelberger, K. L., Dickinson, M., & Giavalisco, M. 2000, ApJ, 528, 96
- Pettini et al. (2003) Pettini, M., Rix, S., Steidel, C. C., et al. E. 2003, ApJ, 569, 742
- Plante & Sauvage (2002) Plante, S., & Sauvage, M. 2002, AJ, 124, 1995
- Sawicki (2001) Sawicki, M. 2001, AJ, 121, 2405 (S01)
- Sawicki & Yee (1998) Sawicki, M., & Yee, H. K. C. 1998, AJ, 115, 1329
- Seitz et al. (1998) Seitz, S., Saglia, R. P., Bender, R., et al. 1998, MNRAS, 298, 945
- Shapley et al. (2001) Shapley, A. E., Steidel, C. C., Adelberger, K. L., et al. 2001, ApJ, 562, 95
- Steidel et al. (1999) Steidel, C. C., Adelberger, K. L., Giavalisco, M., Dickinson, M., Pettini, M. 1999, ApJ, 519, 1
- Steidel et al. (2003) Steidel, C. C., Adelberger, K. L., Shapley, A. E., et al. 2003, ApJ, 592, 728
- (57) Takeuchi, T. T., Yoshikawa, K., Ishii, T. T. 2000, ApJS, 129, 1
- Takeuchi et al. (2001a) Takeuchi, T. T., Ishii, T. T., Hirashita, H., et al. 2001a, PASJ, 53, 37
- Takeuchi et al. (2001b) Takeuchi, T. T., Kawabe, R., Kohno, K., et al. 2001b, PASP, 113, 586
- Takeuchi et al. (2003a) Takeuchi, T. T., Hirashita, H., Ishii, T. T., Hunt, L. K., Ferrara, A. 2003a, MNRAS, 343, 839 (T03)
- (61) Takeuchi, T. T., Yoshikawa, K., Ishii, T. T. 2003b, ApJ, 587, L89 (erratum: Takeuchi, T. T., Yoshikawa, K., Ishii, T. T. 2004, ApJ, 606, L171)
- Takeuchi & Ishii (2004) Takeuchi, T. T., & Ishii, T. T. 2004, ApJ, 604, 40
- Teplitz et al. (2000) Teplitz, H. I., McLean, I. S., Becklin, E. E., et al. 2000, ApJ, 533, L65
- Todini & Ferrara (2001) Todini, P., & Ferrara, A. 2001, MNRAS, 325, 726 (TF01)
- Totani & Takeuchi (2002) Totani, T., & Takeuchi, T. T. 2002, ApJ, 570, 470
- van der Werf et al. (2001) van der Werf, P. P., Knudsen, K. K., Labbé, I., & Franx, M. 2001, in Deep Millimeter Surveys: Implications for Galaxy Formation and Evolution, ed. J. D. Lowenthal & D. H. Hughes (Singapore: World Scientific Publishing), 103
- (67) Vijh, U. P., Witt, A. N., & Gordon, K. D. 2003, ApJ, 587, 533
- Webb et al. (2003) Webb, T. M., Eales, S., Foucaud, S., et al. 2003, ApJ, 582, 6
- Witt et al. (2000) Witt, A. N., & Gordon, K. D. 2000, ApJ, 528, 799
- Whittet (1992) Whittet, D. C. B. 1992, Dust in the Galactic Environment, IOP, New York
- Yee et al. (1996) Yee, H. K. C., Ellingson, E., Bechtold, J., Carlberg, R. G., & Cuillandre, J.-C. 1996, AJ, 111, 1783