High energy photon emission in the early afterglow of GRB’s
Abstract
We consider the emission within the fireball model framework of very high energy, GeV to TeV photons, on a minute time scale, during the onset of fireball deceleration due to interaction with surrounding medium. Our time dependent numerical model includes exact treatment of electron synchrotron emission, inverse-Compton scattering, pair production, and evolution of electromagnetic cascades (initiated by pair production or photo-production of pions). We find that (i) The 1 GeV–10 GeV flux is not sensitive to model parameters and is for bursts, well within the detection capabilities of GLAST; (ii) The sub-TeV flux depends on the surrounding medium density and on the fraction of thermal energy carried by the magnetic field, : It ranges from in the case of typical ISM density and to in the case of a source surrounded by a wind and ; (iii) The sub-TeV flux is detectable by high energy -ray experiments such as HESS, MAGIC, MILAGRO, and VERITAS; (iv) Combined , and sub-TeV observations will allow to determine both and the ambient medium density; (v) The spectra depend only weakly on the spectral index of the energy distribution of the accelerated electrons. Pion production energy loss of high energy protons may contribute significantly in the wind case to the luminosity of high energy photons. However, it is difficult to distinguish in this case between the electron and proton contributions since the spectral shape is determined primarily by the energy dependence of the pair production optical depth.
Subject headings:
gamma rays: bursts — gamma rays: theory — radiation mechanisms: nonthermal1. Introduction
In the standard fireball model of gamma-ray-bursts (GRB’s), the observable effects are due to the dissipation of kinetic energy in a highly relativistic fireball (for reviews, see, e.g., Piran, 2000; Mészáros, 2002; Waxman, 2003). The observed radiation is well explained as synchrotron and inverse-Compton emission from shock accelerated electrons. Electrons accelerated in internal shock waves within the expanding fireball produce the prompt -ray emission, while electrons accelerated in the external shock wave driven by the fireball into the surrounding medium produce the afterglow emission, from the X to the radio bands, that can last months after the burst (Paczyński & Rhoads, 1993; Mészáros & Rees, 1997; Vietri, 1997a; Waxman, 1997a, b; Sari, Piran & Narayan, 1998; Gruzinov & Waxman, 1999).
At the early stages of the afterglow, as the energy density of the surrounding matter swept by the external shock wave equals the energy density of the fireball plasma, a reverse shock crosses the fireball plasma (Mészáros, Rees & Papathanassiou, 1994; Sari & Piran, 1995). At this transition phase, lasting over a duration comparable to that of the burst itself, both forward and reverse shocks accelerate particles, which subsequently emit the early afterglow. Early optical emission from several GRBs has been identified as reverse shock emission (Akerlof et al. (1999); Sari & Piran (1999); Mészáros & Rees (1999); Kobayashi (2000); Kobayashi & Sari (2000); Wei (2003); Zhang, Kobayashi & Mészáros (2003)).
In the past few years, evidence accumulated for the existence of a high energy emission component () associated with gamma-ray bursts (GRBs), which are typically observed at much lower energies, few keV to few MeV. Such a component was first observed by EGRET in the range (Schneid et al., 1992; Hurley et al., 1994). There is evidence for even higher energy, emission, observed in one burst out of 54 BATSE GRBs in the MILAGRITO field of view (Atkins et al., 2000, 2003).
The mechanism responsible for high energy photon emission is still controversial. High energy electrons inverse Compton (IC) scatter low energy photons to high energies, 1 GeV- 1 TeV (Mészáros, Rees & Papathanassiou, 1994) extending the spectrum to high energy. The exact shape of the spectrum depends on the values of the uncertain parameters of the model (Chiang & Dermer, 1999; Wang, Dai & Lu, 2001; Zhang & Mészáros, 2001). An additional source of high energy emission is the possible acceleration of baryons, first suggested by Waxman (1995a), Vietri (1995) and Milgrom & Usov (1995). Accelerated protons can emit synchrotron radiation at this energy band (Vietri, 1997b; Totani, 1998a, b; Bötcher & Dermer, 1998). High energy baryons can also produce energetic pions, via photo-meson interactions with the low energy photons, creating an alternative source of high energy photons and neutrinos (Waxman & Bahcall, 1997, 2000; Bötcher & Dermer, 1998). A high energy component may also be created by the decay of energetic pions, produced in proton-proton(neutron) collisions, if the expanding plasma collides with a dense () cloud (Katz, 1994; De Paolis, Ingresso & Orlando, 2000).
In this paper, we analyze the high energy emission component during the early afterglow (transition phase) on a time scale of tens to hundreds of seconds following the GRB, within the framework of the fireball model. We explore the dependence of photon spectrum on uncertain model parameters, in particular on the energy density of the magnetic field, the power law index of the accelerated particles and the density of the medium surrounding the fireball. The ambient medium density differs widely between different scenarios for GRB production. In the neutron star merger scenario (Goodman, 1986; Paczyński, 1986; Eichler et al., 1989), for example, a density typical to the ISM () is generally expected, while in the massive stellar collapse scenario (Woosley, 1993; Levinson & Eichler, 1993; Paczyński, 1998) a much higher density () may be expected in a wind surrounding the progenitor, due to mass loss preceding the collapse (Chevalier, 2001). In addition, we explore the possible contribution of high energy protons.
Calculation of the early high energy emission spectrum is complicated due to several reasons: First, IC scattering is partly in the Klein-Nishina regime. Second, high energy photons (produced by IC scattering or via pion decay) initiate high energy electro-magnetic cascades, the evolution of which is difficult to study analytically. Studies of cascade processes in the past ( Bonometto & Rees (1971); Guilbert, Fabian & Rees (1983); Svensson (1987)) have shown that it may have a significant effect on the spectrum at high energies. And third, the optical depth to pair production may be large at high energy, leading to the formation of a large number of pairs which affect the resulting spectra. Due to these complications, numerical calculations are required to accurately determine the high energy spectra and their dependence on uncertain model parameters.
Numerical methods where extensively used in the past in the study of active galactic nucleus (AGN) plasma (Guilbert, Fabian & Rees, 1983; Zdziarski & Lightman, 1985; Fabian et al., 1986; Lightman & Zdziarski, 1987; Coppi, 1992). Using these methods, new results were obtained, such as the complex pattern of the spectral indices in the X-ray () range, that were not obtained by previous analytic calculations. In the context of the high energy emission from GRB’s, numerical calculations are challenging. The large difference between the characteristic time scales for the evolution of high energy and low energy particles, and the fact that the distribution of low energy particles evolves on a time scale comparable to the dynamical time and does not reach a steady-state, implies that the numerical code must follow processes characterized by widely differing time scales. Due to these difficulties, the accuracy of existing numerical calculations of emission from GRB’s (Panaitescu & Mészáros, 1998) is limited above . Here we present numerical results using a code that allows to overcome the difficulties mentioned above. Our time dependent model includes an accurate description of synchrotron emission, direct and inverse Compton scattering, pair production and the evolution of high energy electromagnetic cascades.
Several new high energy photon detectors will become fully operational in the near future. These include the GLAST111http://www-glast.stanford.edu satellite, which will greatly improve the sensitivity at and will open a new window of observation up to GeV. GLAST sensitivity, at 1 GeV will allow detection of many hundreds of bursts per year, if GRB’s emit equal amount of energy at GeV and keV bands. In addition, new generation of sub-TeV Cerenkov detectors such as MAGIC222http://hegra1.mppmu.mpg.de/MAGICWeb, HESS333http://www.mpi-hd.mpg.de/hfm/HESS/HESS.html VERITAS444http://veritas.sao.arizona.edu/ and CANGAROO III555http://icrhp9.icrr.u-tokyo.ac.jp/ will open new era in GRB observations. The universe is transparent to 100 GeV photons up to redshift of (e.g. Salamon & Stecker, 1998). Given the local rate of GRBs (Guetta, Piran & Waxman, 2003), the sensitivity of these detectors at , for a 100 second burst, will allow a detection of few to few tens of GRB’s per year at this energy band (depending on the exact instrument energy threshold) if the GRB spectrum in the keV - sub TeV range is flat, . The field of view of the Cerenkov telescopes is small, which implies that fast slewing to the GRB position, on minute time scale, would be required. This may be achievable with the fast alerts that will be provided by SWIFT666http://www.swift.psu.edu/. The sensitivity of the MILAGRO777http://www.lanl.gov/milagro/ shower detector at TeV would allow it to detect event per year. The results presented here may therefore be useful for planning the observing strategy of the detectors and may allow to use high energy data to constrain the values of uncertain parameters of the model.
This paper is organized as follows. In §2 we derive the plasma conditions during the transition phase, which is the duration over which the reverse shock exists. We calculate the critical synchrotron frequencies and luminosities in the ”wind” scenario (§2.1) and in the ”uniform density ISM” scenario (§2.2). In §2.3 we discuss proton energy loss and its contribution to high energy photon emission. Our numerical model is briefly presented in §3; A detailed description of the model may be found in Pe’er & Waxman (2004). In §4 we present our numerical results. We summarize and conclude in §5, with special emphasis on implications for high energy photon telescopes.
2. Model assumptions, plasma conditions and proton energy loss at the transition phase
The interaction of fireball ejecta with surrounding gas produces a reverse shock which propagates into and decelerates the fireball ejecta. As the reverse shock crosses the ejecta, it erases the memory of the initial conditions, and the expansion then approaches the Blandford-McKee self-similar solutions (Blandford & McKee, 1976). We derive in this section the plasma parameters, the low energy photon luminosity and spectrum, and the proton energy loss time scales expected during this transition phase, for fireball expanding into a wind and into a uniform medium with density typical to the ISM.
2.1. Wind scenario
The mass loss preceding a collapse creates a density profile , where the proportionality constant is taken as , and a value of is assumed for a typical Wolf-Rayet star (Willis, 1991). During the self similar expansion, the Lorentz factor of plasma behind the forward shock is , where is the energy density of the surrounding medium, , and is the (isotropically equivalent) fireball energy. The characteristic time at which radiation emitted by shocked plasma at radius is observed by a distant observer is (Waxman, 1997c).
The reverse shock is relativistic if the energy density of the surrounding matter swept by the forward shock equals the energy density of the propagating plasma. Since both energy densities decrease with the second power of the radius, a relativistic shock is formed if , i.e. if
| (1) |
where is the original ejecta Lorentz factor, and is the burst duration. At higher explosion energy, the reverse shock is not relativistic. Both prompt and afterglow observations suggest that , implying that a relativistic reverse shock should in general be formed.
The duration (measured in the observer frame) of the transition phase, during which the reverse shock exists, is comparable to the longer of the two time scales set by the initial conditions (Waxman, 2003): The (observed) GRB duration and the (observed) time at which the self-similar Lorentz factor equals the original ejecta Lorentz factor , . This implies that the transition radius to self similar expansion, , is
where . During the transition, shocked plasma expands with Lorentz factor close to that given by the self-similar solution, , i.e.,
| (2) |
The Lorentz factor of the reverse shock in the frame of the unshocked plasma is .
We denote by and the fractions of the thermal energy density that are carried, respectively, by electrons and magnetic fields. The characteristic Lorentz factor of electrons accelerated at the forward shock is . Electrons accelerated at the reverse shock are characterized by . The minimum Lorentz factor of a power law accelerated electrons is
where is the power law index of the accelerated electrons energy distribution, .
Synchrotron emission peaks at . Using
| (3) |
for the energy density behind the forward shock at the transition radius, the synchrotron emission peak at the reverse and forward shocks is given by
where , assumed, , and . These energies are above , the characteristic synchrotron energy of electrons for which the synchrotron cooling time, , is comparable to the ejecta (rest frame) expansion time, ,
| (4) |
is comparable to the synchrotron self absorption energy, below which the optical depth becomes larger than 1,
| (5) |
(for ). Equating the particle acceleration time, and the synchrotron cooling time, gives the maximum Lorentz factor of the accelerated electrons (in the plasma rest frame), . Synchrotron emission from these electrons peaks at
| (6) |
The reverse shock specific luminosity at is
| (7) |
For a power law energy distribution with of the accelerated electrons, the specific luminosity is above .
2.2. Uniform density ISM
During self similar expansion into uniform density medium, the Lorentz factor of plasma is given by (Blandford & McKee, 1976). The transition to self similar expansion occurs at a radius
where a typical value of the ambient number density assumed. Calculations of the characteristic Lorentz factors, synchrotron frequencies and characteristic luminosities closely follow the steps of the wind scenario calculations, and partly appear in Waxman & Bahcall (2000). The peak energy of synchrotron emission from electrons accelerated at the reverse shock,
| (8) |
is comparable to the synchrotron self absorption energy,
| (9) |
and is below
| (10) |
Synchrotron emission from electrons accelerated at the forward shock peaks at higher energy,
| (11) |
The reverse shock specific luminosity, at is
| (12) |
For a power law energy distribution with of the accelerated electrons, at higher energies, .
2.3. Proton energy loss and its contribution to high energy photon emission
Protons accelerated to high energy in the reverse shock contribute to the emission of high energy photons by synchrotron emission and photo-production of pions, which decay to produce high energy photons and electrons (and neutrinos). The maximum energy to which protons are accelerated is determined by equating the proton acceleration time (in the plasma frame), , to the minimum of the dynamical time, the synchrotron energy loss time, and the pion production energy loss time. For expansion into a wind, the acceleration time is equal to the dynamical time, , for protons with (plasma frame) Lorentz factor
| (13) |
and to the synchrotron loss time, , for protons with (plasma frame) Lorentz factor
| (14) |
The time for energy loss via pion production may be approximated as (Waxman & Bahcall, 1997)
| (15) |
is the cross section for pion production for a photon with energy in the proton rest frame, is the average fraction of energy lost to the pion, and is the threshold energy. The specific photon density, , is related to the observed luminosity by . Photo-meson production is dominated by interaction with photons in the energy range , where , thus
| (16) |
A contribution from the -resonance comparable to that of photons of higher energy was assumed in evaluating the first integral. Using and at the resonance , and for the peak width, the acceleration time equals the pion production loss time for protons with (plasma frame) Lorentz factor
| (17) |
Comparing eqs. (13), (14) and (17) we find that proton acceleration is limited by energy losses, and that pion production losses dominates over synchrotron losses for
| (18) |
Note, that this is valid independent of the proton energy, since . X-ray afterglow observations suggest that is close to equipartition, (Freedman & Waxman, 2001; Berger, Kulkarni & Frail, 2003). Thus, we expect proton energy losses to be dominated by pion production. Comparing eqs. (13) and (17) we find that for the highest energy protons lose all their energy to pion production. Assuming a power law distribution of proton energies, , roughly 0.1 of the energy carried by protons will be converted in this case to pions, and roughly half of this energy would be converted to high energy photons through the decay to photons and electrons (positrons). Since shock accelerated electrons lose all their energy to radiation, this implies that the contribution of protons to the luminosity is similar to that of the electrons. This is valid also for values of well below equipartition, , since the contribution to the luminosity of both electrons and protons is in this case.
In the case that eq. (18) is not satisfied, and the proton energy loss is dominated by synchrotron losses, comparing eqs. (13) and (14) implies that the highest energy protons lose all their energy to synchrotron losses if the magnetic field is close to equipartition. For lower values of , the highest energy protons lose a fraction of their energy by synchrotron emission. In this case, proton synchrotron emission would dominate the electron luminosity if .
For explosion into a uniform density ISM, similar arguments imply that pion production losses dominate over synchrotron losses when eq. (18) is satisfied. Following the analysis of Waxman & Bahcall (2000), protons which are expected to be accelerated up to , lose a fraction of their energy to pion production. Therefore, for a power law index of the accelerated protons, pions receive a fraction of the total proton energy. Since in this scenario as well electrons lose almost all their energy to radiation, the total proton contribution to the photon flux is of the electron contribution, independent on the value of . If eq. (18) is not satisfied, proton synchrotron losses dominate over pion production. A similar calculation to the former case shows that proton synchrotron emission dominates the electron luminosity in this scenario only if .
The discussion presented above demonstrates that the energy loss of protons is expected to be dominated by pion production, and that this energy loss may produce a luminosity similar to that of the electrons in the scenario of explosion into a wind. Finally, it should be pointed out that if protons are accelerated to a power-law energy distribution with an index significantly larger than 2, their contribution to the luminosity will be significantly reduced, since the fraction of energy carried by the highest energy protons will be small.
3. The numerical model
The acceleration of particles in the two shock waves that exist during the transition phase is accompanied by numerous radiative processes. In the numerical calculations, we use the time dependent numerical model described in Pe’er & Waxman (2004). Our time dependent model follows the evolution of the particle distribution and the emergent spectra, by solving the kinetic equations for the electron and photon distributions, taking into account synchrotron emission, inverse Compton scattering, pair production and pion photo-production interactions. These calculations are done for a wide range of particle energies, including the evolution of rapid electro-magnetic cascades at high energies.
In the calculations, we focus on particles that pass through the forward or the reverse shock waves and therefore are in the downstream region of the flow, relative to the relevant shock wave. While the upstream relativistic flow is highly anisotropic, the shocked gas thermalize, hence isotropise (in the plasma comoving frame) immediately after passing the shock, on a characteristic length scale of several skin-depth (e.g., Kirk et al., 1998, 2000; Frederiksen et al., 2004). The emitted radiation is therefore isotropic in the comoving frame. Most of the shocked gas and most of the blast-wave energy are concentrated in a shell of co-moving thickness with (e.g., in the Blandford & McKee (1976) self-similar solutions which give the spatial dependence of the hydrodynamical variables, 90% of the energy is concentrated in a shell of co-moving thickness corresponding to ). Since the details of the spatial dependence of the electron and magnetic field energy fractions are not known, we adopt in our model the commonly used approximation (e.g., Lightman & Zdziarski, 1987; Coppi, 1992; Pilla & Loeb, 1998) that radiation is produced within a homogeneous shell of comoving width with . Since the shocks velocity is time independent during , the shock-heated comoving plasma volume is assumed to increase linearly with time, i.e., constant particle number density is assumed (see Pe’er & Waxman, 2004, for further details).
In the comoving frame, homogeneous and isotropic distributions of both particles and photons are therefore assumed. Parallel calculations of processes in the two shock waves are carried out, where photons produced at each shock participate in IC scattering, photo-production interactions and pair production interactions occurring at both shocks.
The particle distributions are discretized, the proton spectrum spans 11 decades of energy (), and the electron spectrum 14 decades (). A fixed time step is chosen, typically times the dynamical time. Numerical integration is carried out with this fixed time step. Particles and photons for which the energy loss time or annihilation time are shorter than the fixed time step, are assumed to lose all their energy in a single time step, producing secondaries which are treated as a source of lower energy particles. Photo-pion production is calculated at each time step by direct integration of the second integral in Eq. 15, while approximating the first integral by the contribution from the -resonance (see the discussion following Eq. 16). Half of the energy lost by protons goes into that decays into 2 photons, each carrying of the initial proton energy.
The following approximations are made: (i) Plasma parameters are assumed to be time independent during the transition phase; (ii) The fraction of thermal energy that is carried by electrons (magnetic field), (), is the same at the forward and reverse shock waves; (iii) The power law index of the energy distribution of accelerated electrons and protons is the same at both shocks.
In the present calculations, we do not consider proton synchrotron emission, which is dominated by pion production for the considered parameter range. Synchrotron self absorption is also not considered here, being irrelevant for processes occurring at high energies. Photons below the self absorption frequency, (in both scenarios; see eqs. 5, 9) can produce pairs only with photons energetic than , which are absent (see the numerical results below). Moreover, these photons are below the threshold energy for pion production, , where (see eq. 17), and where taken.
4. Numerical results
4.1. High vs. low density
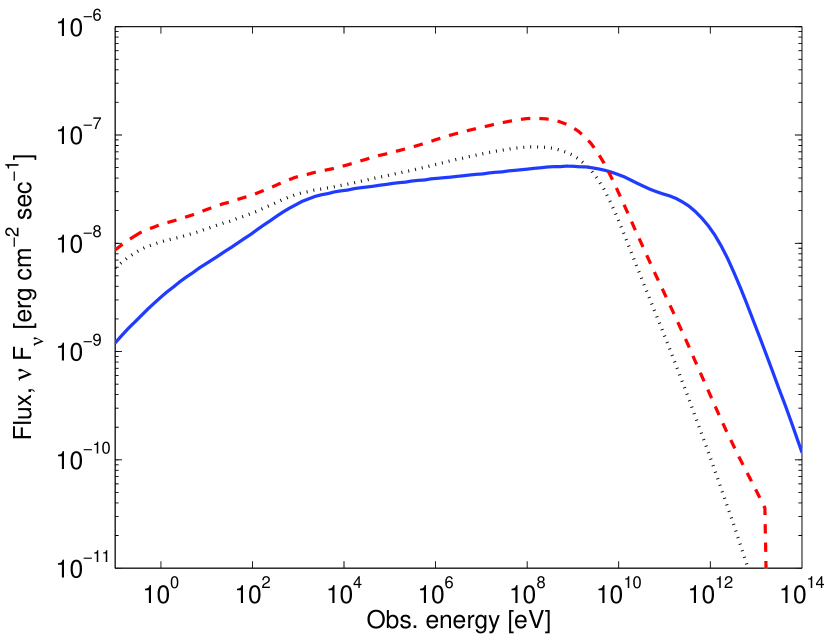
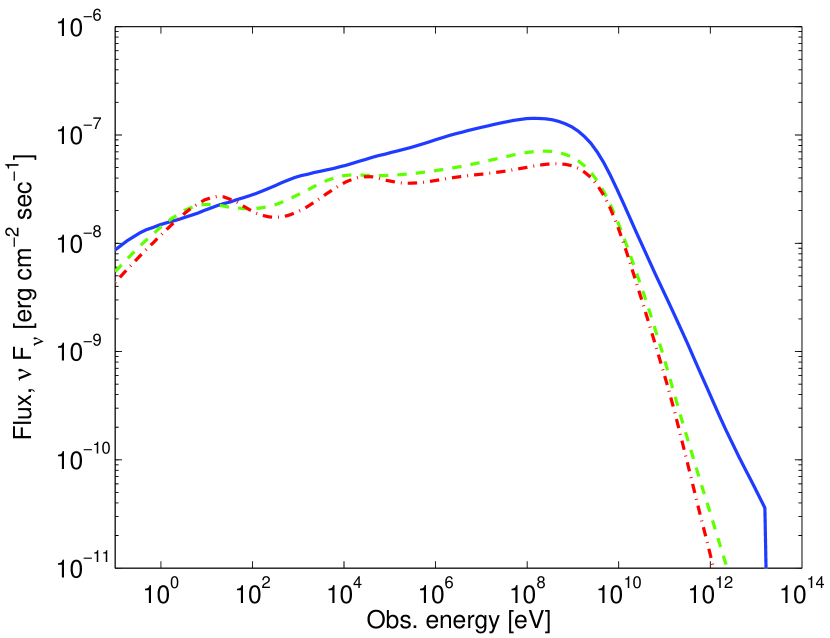
Figure 1 shows spectra obtained from a GRB transition phase in the two scenarios discussed: Explosion in a uniform low density medium typical to the ISM, , and explosion in a wind, where the density of ambient medium at the transition radius is much higher, .
The most evident feature of the two spectra is their flatness, with , extending over seven energy decades between and for expansion into ISM, and over ten energy decades from to for explosion into a wind. This is a result of dominant synchrotron emission term at these energies.
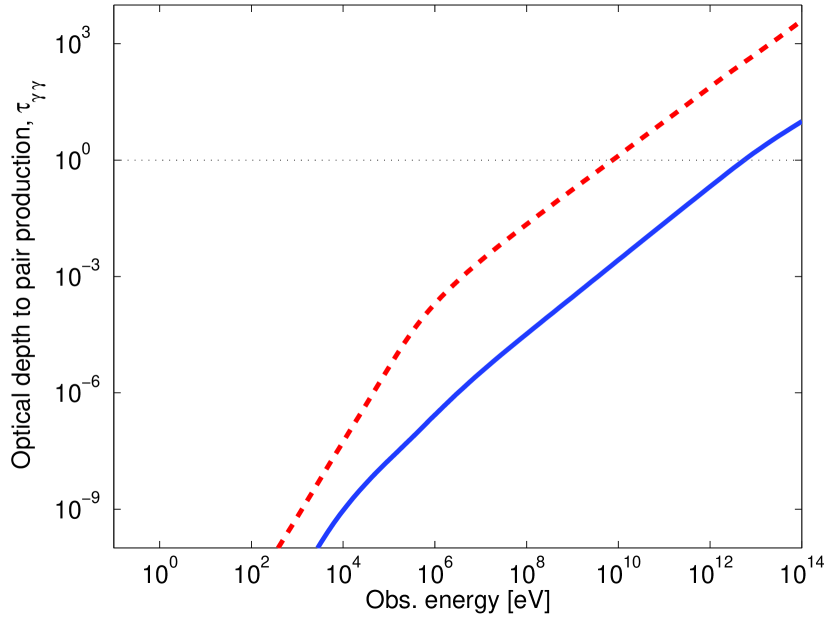
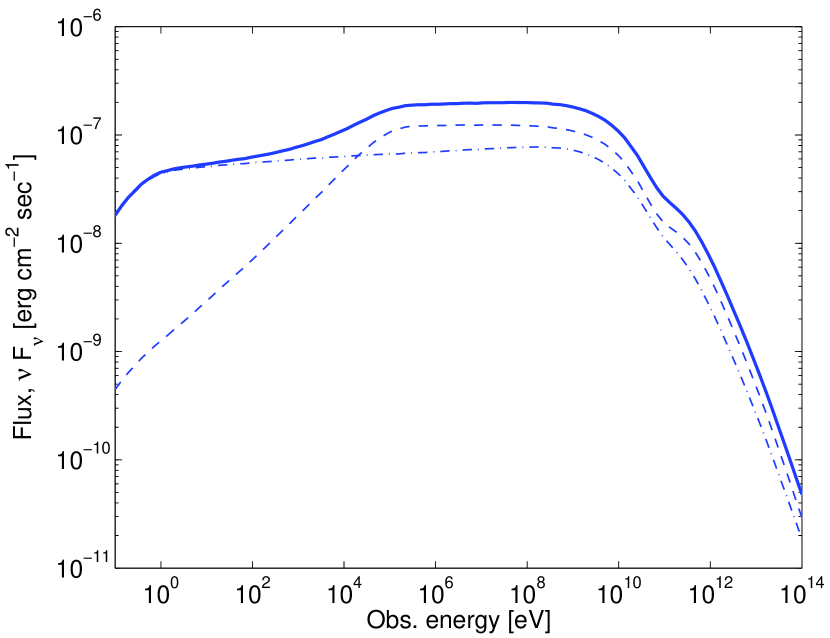
The main difference between the two scenarios appears at high energies, , due to the different optical depth to pair production, , as shown in Figure 2. The large optical depth to pair production in the wind case softens the high energy IC spectrum, resulting in spectral index . Consequently, while in the ISM case the flux is comparable to the flux at , in the high density wind case the flux is 2.5 orders of magnitude lower. A second difference between the two scenarios appears at the optical-UV band. In the low density scenario, at low energies, , emission from both shock waves produces a moderate increase in the spectral slope, above . As demonstrated in Figure 3, this slope results from a flat spectrum produced at the reverse shock, above , and forward shock emission characterized by below . In a high density medium, a nearly flat spectrum is obtained above .
In an explosion into constant density ISM scenario, the total energy carried by the IC scattered photons is of the total energy in synchrotron emitted photons, well below the simple estimate , which is based on the assumption that all the synchrotron emitted photons serve as seed photons for Compton scattering. This discrepancy is due to Klein-Nishina suppression of the cross-section at high energies. Consequently, IC scattering becomes dominant only above , where a flat spectrum is created for a power law index of the accelerated electrons energy distribution. In the wind case, IC scattering is more prominent due to the higher photon density.
Lightcurve of the spectrum of an explosion into constant density ISM scenario is presented in Figure 4. The constant injection rate of energetic electrons results in a linear increase of the synchrotron emission component in time. Since the energy of photons emitted by electrons for which the synchrotron cooling time equals the time , , the energy density in the low energy photons increases with time. Only photons with are in the Thompson limit for Compton scattering, therefore the inverse Compton component increases in time, at early times. At later times, , where is the dynamical time of the problem, the low energy photon density becomes high enough that pair production phenomenon limits the high energy emission component.
The contribution of protons to the photon flux is negligible in the ISM case, however this contribution is 85% of the electrons’ contribution to the flux in the wind scenario (see §2.3). Most of this contribution results from the decay of energetic pions, initiating high energy electro-magnetic cascades. The high energy cascade results in flat () spectrum at the observed energy range, which, for power law index of the accelerated particles is similar to the spectrum from inverse Compton scattering. An additional small contribution from the decay of low energy pions results in a spectral slope , contributing to the small deviation from flat spectrum shown below in this scenario. Above the energy at which the optical depth for pair production , , the spectrum is determined by the spectrum of low energy photons, thus the proton contribution is hard to discriminate at these energies as well.
4.2. Fraction of energy carried by electrons and magnetic field
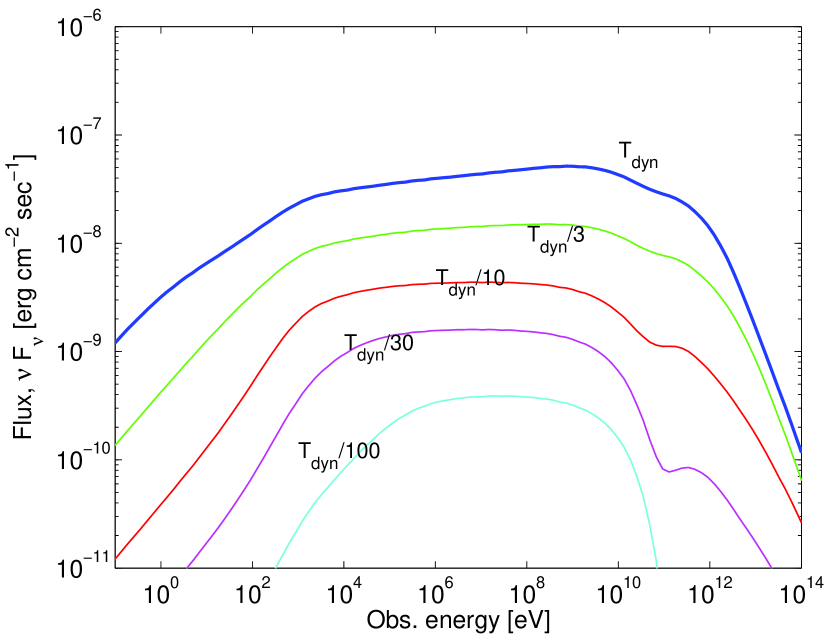
In an explosion into a low density ISM, . Thus, for electrons lose nearly 100% of their energy to radiation, resulting in a nearly linear dependence of the flux on . The dependence of the spectrum on the fraction of thermal energy carried by the magnetic field, , is illustrated in Figure 5. The domination of synchrotron emission implies that the values of and determine the spectral behavior at low energies, while a flat spectrum is expected for at higher energies, up to . The ratio of to flux is informative about the value of , with large ratio () implying small ). At higher energies, , a flux comparable to the flux is produced by IC scattering for .
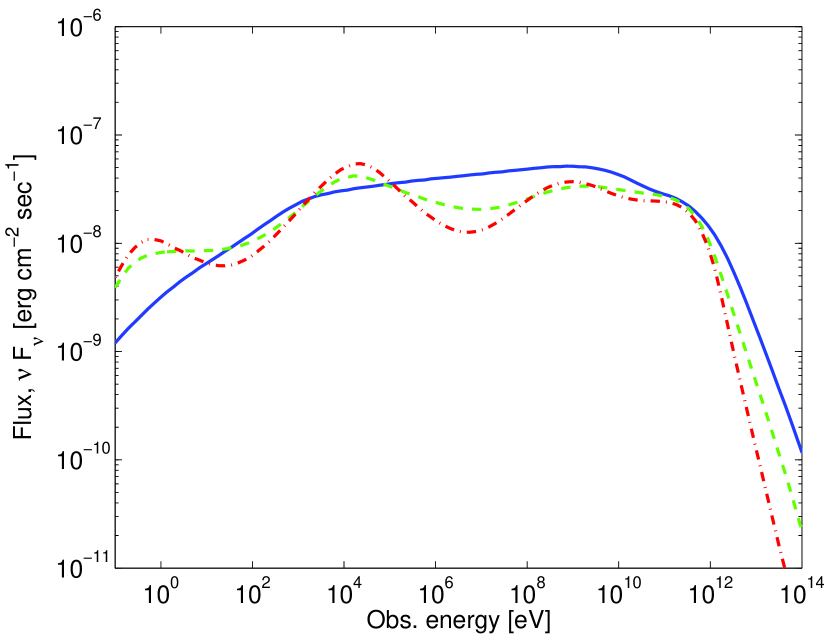
For explosion into a wind, . Here too, for electrons lose nearly 100% of their energy to radiation, resulting in a nearly linear dependence of flux on . The dependence of the spectrum on is illustrated in Figure 6. Here, IC emission is much more prominent. IC energy loss of the electrons affects the spectrum at all energy bands by modifying the electrons energy distribution. The spectrum becomes harder with lower values of , reaching below for . In this scenario, the minimum Lorentz factor of electrons accelerated at the front shock, (see Eq. 2.1) is comparable to , which is defined as the Lorentz factor of electrons that emit synchrotron radiation above their Klein-Nishina limit. We show in Appendix A that in this case, if the main energy loss mechanism is inverse Compton scattering, a spectral index in the range should be expected. A to flux ratio larger than 10 indicates therefore , and smaller ratio indicates higher value of , similar to the case of explosion into low density ISM. Above , the flux is suppressed by pair production.
4.3. Power law index of the accelerated particles
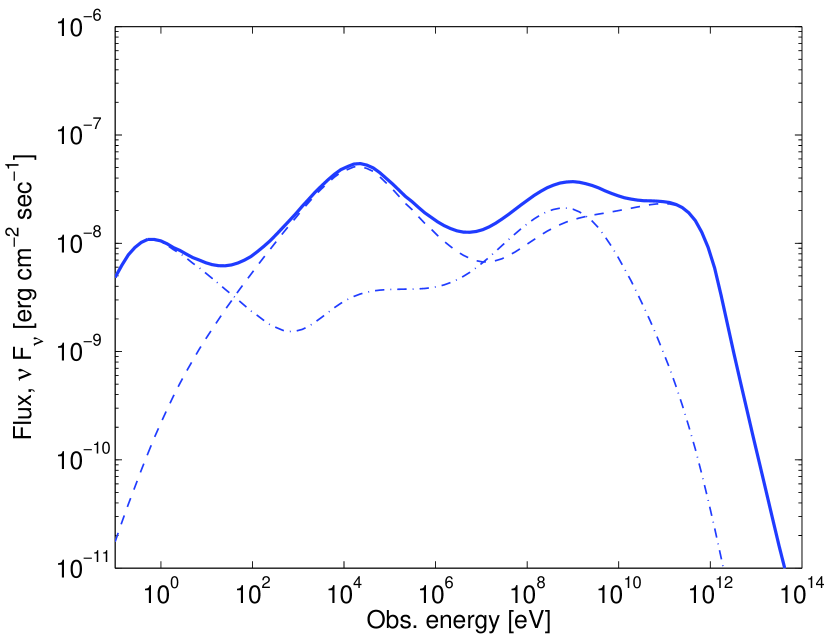
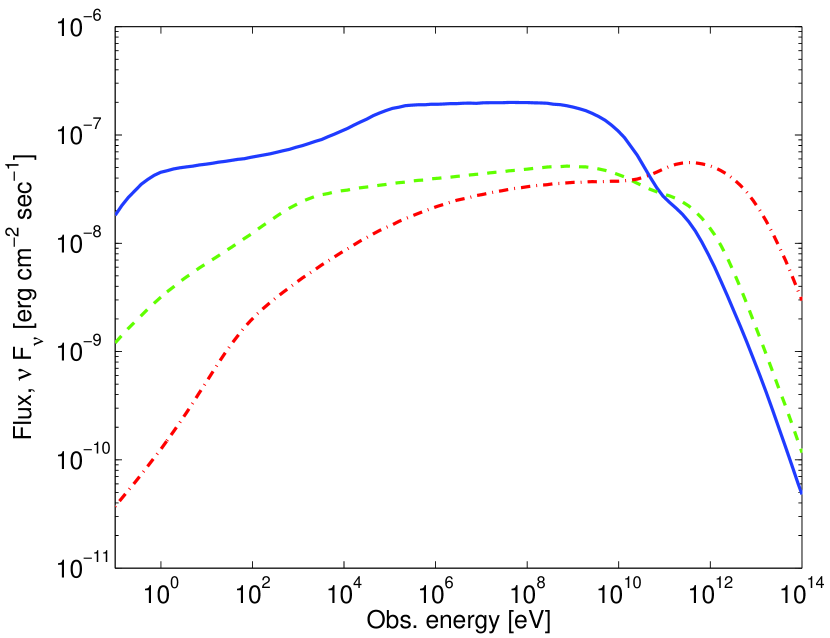
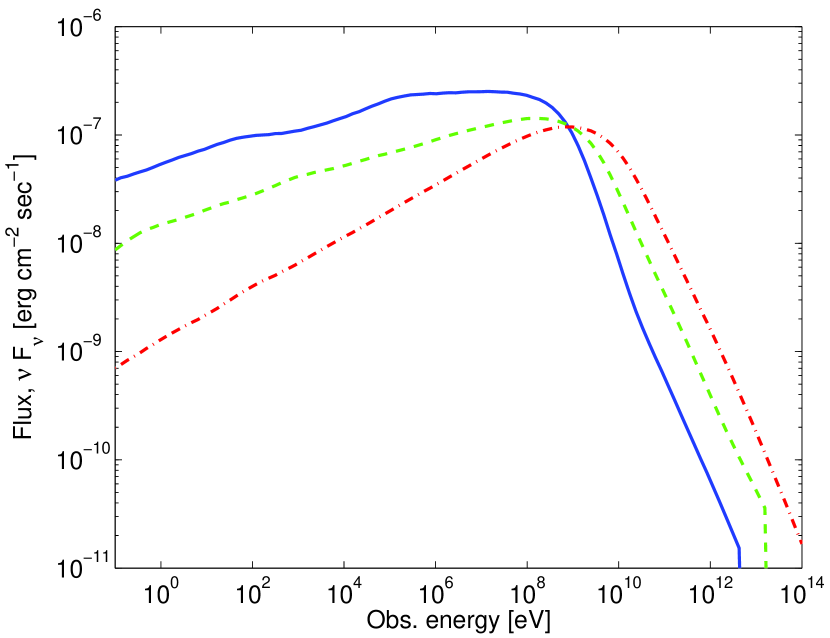
The dependence of the spectrum on varies with the external density, as demonstrated in Figures 7 and 8. The dominant synchrotron component in explosion into a low density ISM results, for large , in a complex wavy shape shown in Figure 7. The four peaks result from synchrotron and IC components at the two shock waves, as demonstrated in Figure 3 (right). The dependence on is, however, not prominent. For explosion into a wind, the prominent IC component leads to a spectrum which is in nearly independent on .
5. Discussion
We have presented numerical results of calculations of the early afterglow GRB spectra (figures 1, 5-8) within the fireball model framework. Our time dependent numerical code describes synchrotron emission, inverse-Compton scattering, pair production, photo-pion production and the resulting high energy cascades. We have shown that the dependence of the spectra on the ambient density and the magnetic field equipartition fraction is pronounced mainly at high photon energies, (see Figures 5, 6): Comparable flux at 1 GeV and 1 TeV implies low density and , while a large ratio of results from dense medium and near equipartition. A second indication for is a large () ratio of the flux at to the flux at . In all cases, the spectra depend only weakly on the power-law index of the accelerated electrons. The flux expected in the energy band, for bursts, is well within the detection capability of GLAST.
The recent detection by MILAGRITO of photon flux associated with GRB970417a (Atkins et al., 2003) can be explained as due to the onset of fireball deceleration by a medium with density typical to the ISM, provided that the magnetic field is well below equipartition, . The flux at is expected in this case to be an order of magnitude higher than the (BATSE) flux, as inferred from the MILAGRITO detection. We note, that an alternative explanation was suggested for the flux, synchrotron emission from shock accelerated protons (Totani, 1998a, b). This explanation requires a very low fraction of the energy to be carried by electrons, , and an isotropic equivalent explosion energy . We find this explanation less attractive, since X-ray afterglow observations imply values near equipartition and isotropic equivalent energies in the range of erg to erg (Freedman & Waxman, 2001; Berger, Kulkarni & Frail, 2003).
The energy loss of high energy protons is dominated by photo-production of pions, rather than by synchrotron emission, for . The contribution of pion decay to the high energy photon luminosity may be comparable to that of inverse-Compton emission of shock accelerated electrons in the case of fireball expansion into a high density wind, and power law index of the accelerated particles. However, it is difficult to distinguish in this case between the electron and proton contributions since the spectral shape is determined primarily by the energy dependence of the pair production optical depth. In the two scenarios considered, explosion into constant density ISM and into a pre-ejected wind, if , proton synchrotron emission becomes the dominant emission mechanism.
Although the MILAGRITO detection is singular, the new generation of high energy sub-TeV detectors, such as MILAGRO, VERITAS, HEGRA, HESS, and MAGIC that will become fully operational in the next few years, will be sensitive enough to observe the high energy early afterglow emission at from bursts per year. The detection rate of higher energy, component is much lower, due to the large pair production optical depth for TeV photons originating at (e.g., Salamon & Stecker, 1998). However, the predicted flux implies that burst per year, that arrives from low redshift , could be detected in the band as well. Such detections will allow to constrain two of the uncertain parameters of the fireball model: the ambient gas density, and the magnetic field equipartition fraction.
Appendix A Spectral distribution resulting from Synchrotron radiation and IC scattering
If inverse Compton scattering is the dominant energy loss mechanism of electrons that were accelerated with a power law energy distribution , the resulting power law index of energetic electrons above deviates from .
The resulting power law can be calculated analytically if the minimum Lorentz factor of the accelerated electrons , is comparable to , which is defined to be the Lorentz factor of electrons that emit synchrotron radiation at the Klein-Nishina limit, . At steady state, a broken power law is expected with index above and at lower energies. Synchrotron emission has a broken power law spectrum:
| (A1) |
where . Energetic electrons therefore lose energy at a rate . As these electrons are injected with power law index , their steady distribution is , or
| (A2) |
At lower energies, electrons lose energy by scattering photons above , thus , or
| (A3) |
Combined together, one obtains
| (A4) |
As an example, assuming power law index of the accelerated electrons, the photons spectral index is 1/3 at low energies, or .
Note that the above analysis is valid provided both , which is translated via eq. (A4) into the demand .
References
- Akerlof et al. (1999) Akerlof, C.W., et al. 1999, Nature, 398, 400
- Atkins et al. (2000) Atkins, R., et al. 2000, ApJ, 533, L119
- Atkins et al. (2003) Atkins, R., et al. 2003, ApJ, 583, 824
- Berger, Kulkarni & Frail (2003) Berger, E., Kulkarni, S.R., & Frail, D.A. 2003, ApJ, 590, 379
- Blandford & McKee (1976) Blandford, R.D., & McKee, C.F. 1976, Phys. Fluids 19, 1130
- Bonometto & Rees (1971) Bonometto, S., & Rees, M.J. 1971, MNRAS, 152, 21
- Bötcher & Dermer (1998) Bötcher, M. & Dermer, C.D. 1998, ApJ, 499, L131
- Chiang & Dermer (1999) Chiang, J., & Dermer, C.D. 1999, ApJ, 512, 699
- Chevalier (2001) Chevalier, R.A., 2001, in GRB in the afterglow era, Proceedings of the International workshop held in Rome, CNR (astro-ph/0102212)
- Coppi (1992) Coppi, P.S. 1992, MNRAS, 258, 657
- De Paolis, Ingresso & Orlando (2000) De Paolis, F., Ingresso, G., & Orlando, D. 2000, A&A, 359, 514
- Eichler et al. (1989) Eichler, D., Livio, M., Piran, T., & Schramm, D.N. 1989, Nature, 340, 126
- Fabian et al. (1986) Fabian, A.C., Blandford, R.D., Guilbert, P.W., Phinney, E.S., & Cuellar, L. 1986, MNRAS, 221, 931
- Frederiksen et al. (2004) Frederiksen, J.T., Hededal, C.B., Haugbølle, T. & Nordlund, Å. 2004, ApJ, 608, L13
- Freedman & Waxman (2001) Freedman, D.L., & Waxman, E. 2001, ApJ, 547, 922
- Goodman (1986) Goodman, J. 1986, ApJ, 308, L47
- Gruzinov & Waxman (1999) Gruzinov, A. & Waxman, E. 1999, ApJ, 511, 852
- Guetta, Piran & Waxman (2003) Guetta, D., Piran, T. & Waxman, E. 2003, ApJ, 619, 412
- Guilbert, Fabian & Rees (1983) Guilbert, P.W., Fabian, A.c., & Rees, M.J. 1983 MNRAS, 205, 593
- Halzen (1999) Halzen, F. 1999, in Proc. 17th Int. Workshop on weak interactions and Neutrinos, Cape Town, South Africa (astro-ph/9904216)
- Hurley et al. (1994) Hurley, K. et al. 1994, Nature, 372, 652
- Katz (1994) Katz, J.I. 1994, ApJ, 432, L27
- Kirk et al. (1998) Kirk, J.G., Rieger, F.M., & Mastichiadis, A. 1998, A&A, 333, 452
- Kirk et al. (2000) Kirk, J.G., Guthmann, A.W., Gallant, Y.A., & Achterberg, A. 2000, ApJ, 542, 235
- Kobayashi (2000) Kobayashi, S. 2000, ApJ, 545, 807
- Kobayashi & Sari (2000) Kobayashi, S., & Sari, R. 2000, ApJ, 542, 819
- Levinson & Eichler (1993) Levinson, A., & Eichler, D. 1993, ApJ, 418, 386
- Lightman & Zdziarski (1987) Lightman, A.P., & Zdziarski, A.A. 1987, ApJ, 319, 643
- Mészáros (2002) Mészáros, P. 2002, ARA&A 40, 137
- Mészáros & Rees (1997) Mészáros, P., & Rees, M.J. 1997, ApJ, 476, 232
- Mészáros & Rees (1999) Mészáros, P., & Rees, M.J. 1999, MNRAS, 306, L39
- Mészáros, Rees & Papathanassiou (1994) Mészáros, P., Rees, M.J., & Papathanassiou, H. 1994, ApJ, 432, 181
- Milgrom & Usov (1995) Milgrom, M., & Usov, V. 1995, ApJ, 449, L37
- Paczyński (1986) Paczyński, B. 1986, ApJ, 308, L43
- Paczyński (1998) Paczyński, B. 1998, ApJ, 494, L45
- Paczyński & Rhoads (1993) Paczyński, B., & Rhoads, J.E. 1993, ApJ, 418, L5
- Pe’er & Waxman (2004) Pe’er, A., & Waxman, E. 2005, ApJ, in press (astro-ph/0409539)
- Panaitescu & Mészáros (1998) Panaitescu, A., & Mészáros, P. 1998 ApJ, 501, 702
- Pilla & Loeb (1998) Pilla, R.P., & Loeb, A. 1998, ApJ, 494, L167
- Piran (2000) Piran, T. 2000, Phys. Rep. 333, 529.
- Salamon & Stecker (1998) Salamon, M. H., & Stecker, F.W. 1998, ApJ, 493, 547
- Sari & Piran (1995) Sari, R., & Piran, T. 1995, ApJ, 455, L143
- Sari & Piran (1999) Sari, R., & Piran, T. 1995, ApJ, 517, L109
- Sari, Piran & Narayan (1998) Sari, R., Piran, T., & Narayan, R. 1998, ApJ, 497, L17
- Schneid et al. (1992) Schneid, E.J. et al. 1992, A&A, 255, L13
- Svensson (1987) Svensson, R. 1987, MNRAS, 227, 403
- Totani (1998a) Totani, T. 1998, ApJ, 502, L13
- Totani (1998b) Totani, T. 1998, ApJ, 509, L81
- Vietri (1995) Vietri, M. 1995, ApJ, 453, 883
- Vietri (1997a) Vietri, M. 1997, ApJ, 478, L9
- Vietri (1997b) Vietri, M. 1997, Phys. Rev. Lett., 78, 4328
- Wang, Dai & Lu (2001) Wang, X.Y., Dai, Z.G. & Lu, T. 2001, ApJ, 556, 1010
- Waxman (1995a) Waxman, E. 1995a, Phys. Rev. Lett., 75, 386
- Waxman (1995b) Waxman, E. 1995b, ApJ, 452, L1
- Waxman (1997a) Waxman, E. 1997, ApJ, 485, L5
- Waxman (1997b) Waxman. E. 1997, ApJ, 489, L33
- Waxman (1997c) Waxman, E. 1997, ApJ, 491, L19
- Waxman (2003) Waxman, E. 2003, in Supernovae and Gamma-Ray Bursts, Ed. K. Weiler (Springer), Lecture Notes in Physics 598, 393–418 (astro-ph/0303517)
- Waxman & Bahcall (1997) Waxman, E., & Bahcall, J. 1997, Phys. Rev. Lett., 78, 2292
- Waxman & Bahcall (2000) Waxman, E., & Bahcall, J. 2000, ApJ, 541, 707
- Waxman & Draine (2000) Waxman, E., & Draine, B.T. 2000, ApJ, 537, 796
- Wei (2003) Wei, D.M. 2003, A&A, 402, L9
- Willis (1991) Willis, A.J. 1991, in Wolf-Rayet Stars and Interrelations with other Massive stars in Galaxies, ed. K.A. Van der Hucht & B. Hidayat (Dordrecht: Kluwer)
- Woosley (1993) Woosley, S.E. 1993, ApJ, 405, 273
- Zdziarski & Lightman (1985) Zdziarski, A.A., & Lightman, A.P. 1985, ApJ, 294, L79
- Zhang, Kobayashi & Mészáros (2003) Zhang, B., Kobayashi, S. & Mészáros, P. 2003, ApJ, 595, 950
- Zhang & Mészáros (2001) Zhang, B. & Mészáros, P. 2001, ApJ, 559, 110