Superbursts at near-Eddington mass accretion rates
Models for superbursts from neutron stars involving carbon shell flashes predict that the mass accretion rate should be anywhere in excess of one tenth of the Eddington limit. Yet, superbursts have so far only been detected in systems for which the accretion rate is limited between 0.1 and 0.25 times that limit. The question arises whether this is a selection effect or an intrinsic property. Therefore, we have undertaken a systematic study of data from the BeppoSAX Wide Field Cameras on the luminous source GX 17+2, comprising 10 Msec of effective observing time on superbursts. GX 17+2 contains a neutron star with regular Type-I X-ray bursts and accretes matter within a few tens of percents of the Eddington limit. We find four hours-long flares which reasonably match superburst characteristics. Two show a sudden rise (i.e., faster than 10 s), and two show a smooth decay combined with spectral softening. The implied superburst recurrence time, carbon ignition column and quenching time for ordinary bursts are close to the predicted values. However, the flare decay time, fluence and the implied energy production of (2–4) erg g-1 are larger than expected from current theory.
Key Words.:
X-rays: binaries – X-rays: bursts – X-rays: individual: GX 17+21 Introduction
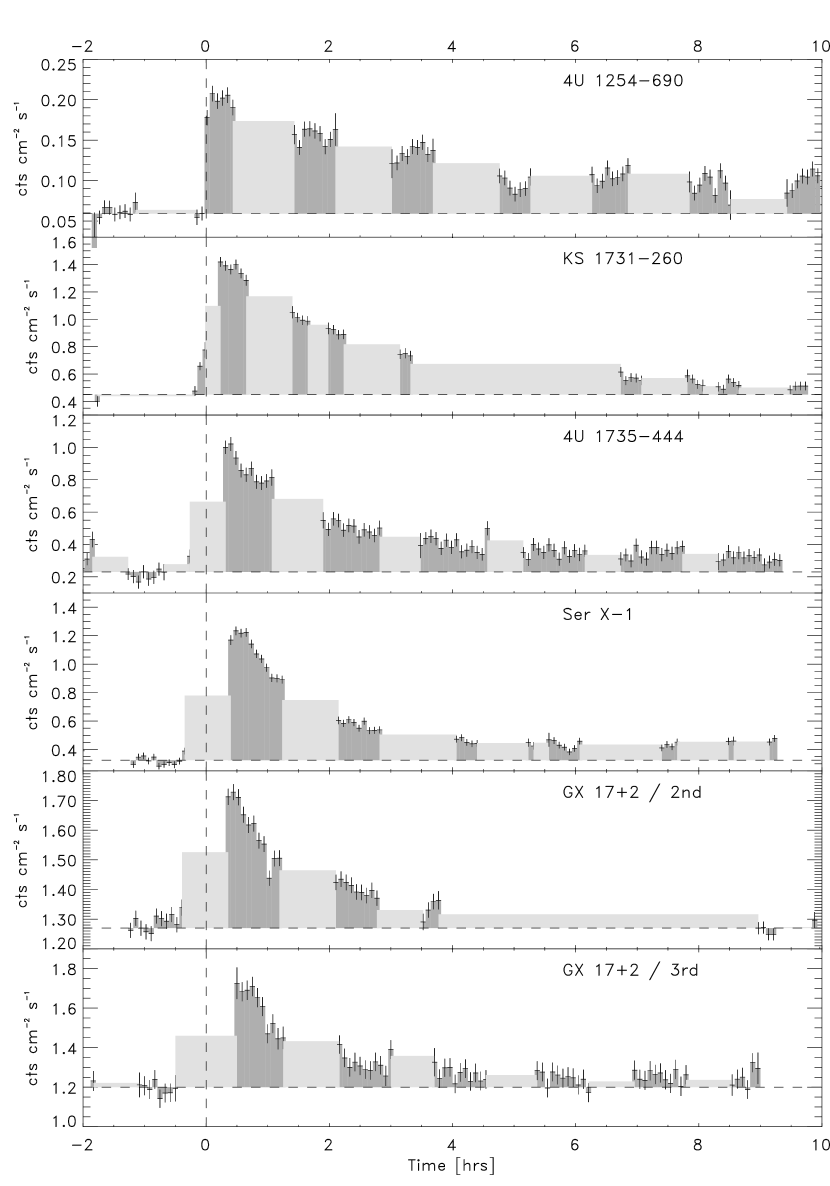
Superbursts are X-ray flares with a rise of a few seconds and an exponential-like decay of a few hours. They originate from neutron stars that accrete matter from a low-mass companion star. Thus far, nine superbursts have been detected from seven sources: one from 4U 1735-44 (Cornelisse et al. 2000), Ser X-1 (Cornelisse et al. 2002), KS 1731-260 (Kuulkers et al. 2002a), 4U 1820-303 (Strohmayer & Brown 2002), GX 3+1 (Kuulkers 2002) and 4U 1254-690 (In ’t Zand et al. 2003a), and three from 4U 1636-536 within 4.7 yr (Wijnands 2001; Strohmayer & Markwardt 2002; Kuulkers et al. 2004). The long duration sets them apart from ’ordinary’ Type-I X-ray bursts which are 103 times shorter, less fluent and more frequent. The joint characteristic of the superburst sources is that they also exhibit ordinary Type-I X-ray bursts, show evidence for stable helium burning (In ’t Zand et al. 2003a) and accrete at levels between 0.1 and 0.25 times the Eddington limit. For a recent review, see Kuulkers (2004).


| Time | Instrument | Decay time (s) |
|---|---|---|
| 50121.67861 | PCA | |
| 50342.48699 | WFC | |
| 50343.79428 | WFC | |
| 50383.64851 | WFC | |
| 50487.10873 | PCA | |
| 50538.48909 | WFC | |
| 50552.15754 | WFC | |
| 50716.15211 | WFC | |
| 51032.55267 | PCA | |
| 51084.51257 | WFC | |
| 51135.36905 | PCA | |
| 51135.60934 | PCA | |
| 51454.65037 | PCA | |
| 51456.98730 | PCA &NFI | |
| 51457.46566 | PCA &NFI | |
| 51457.99918 | NFI | |
| 51460.01504 | NFI | |
| 51460.52389 | PCA | |
| 51461.38249 | PCA | |
| 51618.92595 | WFC | |
| 51808.14798 | WFC | |
| 51989.72422 | WFC | |
| 52003.73772 | WFC | |
| 52004.15411 | WFC | |
| 52172.68849 | WFC |
Superbursts are attributed to unstable carbon shell burning (Woosley & Taam 1976; Strohmayer & Brown 2002) within the top 100 m of the neutron star, as compared to unstable helium/hydrogen burning within the top 10 m for ordinary bursts (Hansen & van Horn 1975; Maraschi & Cavaliere 1977; Joss 1977; Taam & Picklum 1979; Fujimoto et al. 1981). They are an important diagnostic because they allow us to probe the products of rp-process H/He burning. Except perhaps for 4U 1820-303 which likely harbors a hydrogen-deficient dwarf (e.g., Cumming 2003), the carbon is thought to be located in a heavy-element ocean that is produced by the rp-process during hydrogen burning in higher-up layers (Cumming & Bildsten 2001; CB01). The energy released during a superburst and the decay time (Cumming & Macbeth 2004; CM04) are well explained by this model. Indeed, the superburst duration is naturally understood as the thermal timescale of a layer 1000 times thicker than a usual Type I X-ray burst, as required to satisfy the observed superburst energies. Uncertainties exist about the ignition, the fuel production and the mixture. Possibly, photo-disintegration-triggered nuclear energy release plays an important role (Schatz et al. 2003a, but see Woosley et al. 2004).
Cumming & Bildsten (2001) predict that for any luminosity above 0.1 times Eddington superbursts should occur. Furthermore, at higher persistent levels the superburst rate would increase and the burst fluence decrease. As was already pointed out by CB01, it is more difficult to find superbursts in systems that radiate near the Eddington limit than in lower luminosity systems, because the dynamic range is much smaller. If the system is emitting at 90% of the Eddington limit, the signal-to-background ratio is 0.1 at maximum while it may be as high as 10 if the persistent luminosity level is near 10% of the Eddington limit. Furthermore, the amplitude of the hour-time-scale variability in the more luminous systems may be comparable to the peak flux of superbursts.
The high-luminosity system that is probably best suited to search for superbursts and test the predictions by CB01 is GX 17+2. GX 17+2 is one of two Galactic Z sources that exhibit X-ray bursts, the other being Cyg X-2. Z sources trace a Z-shaped path in X-ray color-color and color-intensity diagrams (e.g., Hasinger et al. 1990). It is believed that they radiate close (i.e., within a few tens of percents) to the Eddington limit. Recently, two detailed X-ray studies have been performed of GX 17+2 with a large volume of data taken with the Proportional Counter Array (PCA) on the Rossi X-ray Timing Explorer (RXTE). Homan et al. (2002) and Kuulkers et al. (2002b) find that 1) GX 17+2 spends 28% of the time on the flaring branch of the Z- diagram where it is thought that the luminosity exceeds the Eddington limit; 2) all 10 detected X-ray bursts occur on the normal branch in which the source spends 44% of the time, implying an average burst recurrence time of 8 hours; 3) 5 X-ray bursts exhibit photospheric radius-expansion due to fluxes near the Eddington limit implying a distance between 12 kpc (for isotropic burst emission) and 8 kpc (for anisotropic emission). No superbursts have been reported from these data. The companion star to the neutron star in GX 17+2 has not been identified. An infrared counterpart was detected but the radiation is unrelated to the companion star (Callanan et al. 2002).


We here report on a superburst search in data from the BeppoSAX Wide Field Cameras. The likelihood of success was anticipated to be much higher than for the RXTE data, because of a nine times longer net exposure time.
2 Observations and characterization of variability
The X-ray observatory BeppoSAX (Boella et al. 1997) operated from June 1996 to April 2002 and carried two identical Wide Field Cameras (WFCs; Jager et al. 1997) with fields of view and 5′ angular resolution in a 2-25 keV bandpass. The WFCs observed GX 17+2 during twelve semi-yearly campaigns of the Galactic center region (e.g., In ’t Zand et al. 2004a) with a total net exposure time of 5.6 Msec. The sum of the elapse time of all observations is 11.3 Msec. This includes the data gaps due to earth occultations and passages through the South Atlantic Geomagnetic Anomaly which are so short that they do not degrade the detection capability for superbursts. During most observations the source was at a relatively large off-axis angle of about 16°. The implied reduction in sensitivity has only a limited detrimental effect on the detection capability because the source is bright; it can be detected in exposures as short as 10 s.
In Fig. 1 we show time histories of the flux and spectral hardness of GX 17+2 during two exceptionally long observations lasting nine days. These nicely illustrate the typical source behavior inherent to a Z source, namely an inverse hardness versus flux relationship (e.g., at MJD 50324) when the source is in the ’horizontal branch’ of the Z pattern, a proportional hardness versus flux relationship in the ’normal branch’, and flaring on a time scale of hours in the ’flaring branch’. This branch behavior in GX 17+2 has been studied in detail by Homan et al. (2002).
Furthermore, 13 ordinary X-ray bursts were detected. These have e-folding decay times of a few hundred seconds. The WFC data are not of high-enough quality to detect short X-ray bursts (i.e., shorter than 10 s and peak fluxes of the order of 0.5 Crab) like the ones observed by Kuulkers et al. (2002b) in 30% of all cases. Table 1 lists all 25 ordinary bursts that were detected during the period that the WFCs monitored GX 17+2.
3 Search for superbursts
| No. | Time | Obs. | Rise | Obs. photon peak | Decay | Peak | Fluence‡ | ||
|---|---|---|---|---|---|---|---|---|---|
| period | time | flux (WFC | time | (keV) | (km) | flux† | |||
| (s) | c s-1cm-2) | (hr) | |||||||
| 1 | 50318.28 | 816 | 5.5 | 1.6 | |||||
| 2 | 50340.30 | 927 | 5.5 | 0.8 | |||||
| 3 | 51444.10 | 7615 | 4.5 | 1.1 | |||||
| 4 | 51452.33 | 7673 | 1.9 | 1.4 | |||||
| 5 | 51633.09 | 8813 | 7.3 | 1.7 | |||||
| 6 | 51795.34 | 9764 | 5.0 | 1.5 |
†in erg cm-2s-1; ‡in erg cm-2. The fluence is established by adding the bolometric unabsorbed fluences per time interval over which a spectrum was accumulated, and interpolating the bolometric fluxes for the data gaps. For data gaps that occur immediately before the observed start of a flare, it was assumed that the flare starts at mid time; an uncertainty is added to the total which represents the fluence from mid time to observed onset. The fluence of the last flare is formally unconstrained because of a premature end of observations, but it is expected not to exceed 12erg cm-2 if the flare decays with the e-folding decay time as measured from the available data. Fluences were not determined for flares which are unlikely to be superbursts (flares 1 and 5, see text).
Superbursts are characterized by a rise which lasts only a few seconds, a smooth exponential-like decay with an e-folding decay time between about 1 and 6 hours and a black body spectrum with a peak temperature of 2.5 to 3 keV which decreases during the decay (e.g., review by Kuulkers 2004). Apart from the long decay time these characteristics match those of ordinary Type-I X-ray bursts (e.g., reviews by Lewin et al. 1993 and Strohmayer & Bildsten 2003).
In order to identify superbursts in GX 17+2 it is crucial to discriminate against flares that are thought to result from quick changes in the mass accretion rate. This is not trivial. Flares have the same durations and exhibit similar few-keV black-body spectra which cool during decay (e.g., Hoshi & Asaoka 1993). The best discriminator is perhaps the time profile of the intensity: superbursts always have fast rises (i.e., less than 10 s) while flares generally do not (rise times usually are several minutes or longer) and superbursts always have smooth decays without reflaring in contrast to flares. Another difference may be in the high-frequency timing behavior. In the flaring branch a broad (50% FWHM) low-amplitude (2-6% rms) 14-23 Hz QPO (“FBO”) is present while low-frequency QPOs are absent during ordinary Type-I X-ray bursts (Homan et al. 2002) and, therefore, possibly superbursts. However, the WFC data are of insufficient statistical quality to detect FBOs.
Given these difficulties we considered it best to search for superburst candidates in data stretches where the source is not in an obvious continued flaring state. We define such a state as when GX 17+2 shows variability larger than a factor of two on a time scale of an hour and for a duration in excess of 6 hours. An example is visible in the right-hand panel of Fig. 1, at MJD 51803. We find that the flaring state pertains to about 10% of all data111This compares to 28% in the RXTE data, but that has a nine times smaller exposure time; the 10% number is supported by checking the 31,231 dwell measurements gathered by the RXTE All-Sky Monitor in 7.9 years of monitoring GX 17+2. Thus, fortunately, disregarding the flaring state episodes preserves 90% of the exposure. We searched and identified in the non-flaring state 6 isolated flares which appeared to show fast rises and near to monotonic decays. They are tabulated in Table 2 and plotted in Fig. 2. One of these occurred during the first nine-day observation shown in Fig. 1 (left panel; 2nd flare).
Due to the low-earth BeppoSAX orbit, data gaps are frequent. Combined with the sometimes short observations, the flare onsets have only been covered in 2 flares and the decay is only partly covered in 2 cases. The fourth flare is the only one which is well covered at the onset and decay although there is a relatively large data gap in this flare as well. We note that GX 17+2 was not observed by RXTE/PCA during any of these 6 flares.

4 Assessment of good superburst candidates
We carried out time-resolved spectroscopy of all six flares. Time intervals were defined with statistically meaningful durations during the flare and one for the final few hours before the flare. The spectrum was satisfactorily modeled by a combination of a single (canonical) bremsstrahlung component (suitable to describe the persistent emission), and a black body radiation component whose parameters were allowed to vary during the flare and were fixed to zero during the pre-flare interval. We included interstellar absorption following Morrison & McCammon (1983). In Table 2 we list the trends that we find for the black body temperature and area (for a distance of 8 kpc) and in Fig. 3 the full details are shown for the second flare. The net flare emission could always be modeled by a few-keV black body.


Only for two flares (2 and 3) could cooling be proven during the decay phase. However, only for the first flare the absence of cooling is significant. Flares 4 and 6 do show spectral softening during decay when parameterized with a simple spectral hardness ratio (see Fig. 2). The time profile of the first flare, furthermore, is not as smooth as one would expect for a superburst. It clearly shows upward fluctuations two times in a manner never seen in a superburst. We disregard the first flare as a superburst candidate.
The flare onset was covered in two cases: flares 4 and 6. Both have a sharp rise lasting shorter than 10 sec (see Figs. 4 and 5). This is consistent with a superburst identification. The statistical quality is rather limited, but the high-resolution data also suggest the presence of an ordinary Type-I X-ray burst of the short variety at the superburst onset. Such bursts are often referred to as ’precursors’ in superburst research, although they have never been shown to truly precede the superburst. They reinforce the superburst identification of these two flares.
The one remaining flare for which the rise was not observed and for which cooling could not be proven is number 5. This flare has one further characteristic which makes it doubtful as a superburst: like flare number 1 it has a peak flux twice as large as all other flares. Therefore, we exclude flare number 5 as a superburst candidate.
In Fig. 6 we show the color-intensity diagram for all data at a 15 min resolution (same resolution as in Fig. 1). The data points for the six flares are highlighted. The normal and horizontal branch are visible (cf, Homan et al. 2002), as are excursions to higher fluxes of up to 2.2 c s-1cm-2. There appear to be two tracks of high-flux excursions, one starting from the lower part of the normal branch and the other from the vertex between the normal and horizontal branch. The former track must be the flaring branch, because flaring branches always start at the lower color end of the normal branch. The first flare is on this track, and the fifth flare may also be. The other track is covered with the other four flares which were identified as good superburst candidates. Thus, this diagnostic appears to confirm the conclusions regarding the nature of the 6 flares based on the time profile and black body temperature.
We note that all superbursts appear to spawn from the vertex between the horizontal and normal branches. This is in contrast to ordinary bursts which can spawn from anywhere on the normal branch (Kuulkers et al. 2002b).
We conclude that of the six investigated flares four are good superburst candidates: flares 2, 3, 4 and 6.
5 Discussion
5.1 Bolometric luminosity and mass accretion rate
GX 17+2 is so interesting for the understanding of superbursts because it is more luminous than any other superburster and, therefore, presumably has a higher mass accretion rate. The arguments for the luminosity being so high are mostly indirect: they are based on a Z pattern traced in the color-color and color-intensity diagrams (e.g., Homan et al. 2002) and on the low flux ratio, compared to the other superbursters, of peaks of ordinary bursts to out-of-burst episodes (Kuulkers et al. 2002b). The flux ratio is about 0.7 for GX 17+2, while it is at least 1.5 for all other superbursters.
It is quite difficult to infer directly the broad-band luminosity of GX 17+2 with a better-than-10% accuracy, as is the case for most LMXBs in the Galaxy. For an important part this is due to a poorly constrained distance (8-12 kpc; Kuulkers et al. 2002b). Another source of uncertainty is the unfamiliarity of the intrinsic spectrum below 2 keV due to the large interstellar absorbing column. Di Salvo et al. (2000) made an accurate broadband spectral study of GX 17+2 on the basis of a 5-d observation with the BeppoSAX Narrow Field Instruments. They found that the observed 0.1-200 keV flux was between 1.58 (at the vertex of the normal and flaring branches) and 1.84 erg cm-2s-1 (at the vertex of the normal and horizontal branch), while the source was not caught in the flaring state. Correcting the fluxes for absorption is difficult because of the presence of a steep power-law component and the uncertainty about its low-energy cut off. Straightforward extrapolation of the power law to 0.1 keV results in total unabsorbed 0.1-200 keV fluxes of 1.92 and 3.63 erg cm-2s-1 respectively. If the power extends to a more realistic 2 keV, the latter value becomes 2.26 erg cm-2s-1 (Di Salvo, priv. comm.). We regard the latter value as the most reliable unabsorbed maximum flux over the normal and horizontal branches. For a distance range of 8 to 12 kpc and assuming isotropic radiation, it translates to a luminosity between 1.7 and erg s-1. The absolute minimum 0.1-200 luminosity is derived from the mimimum observed flux of 1.58 erg cm-2s-1 and the shortest allowable distance of 8 kpc, resulting in erg s-1.
The Eddington limit of a neutron star is determined by its size, mass, and the hydrogen content of its photosphere. The latter must be high because some ordinary bursts are relatively long which presumably is due to prolonged nuclear reactions involving copious free protons (e.g., Fujimoto et al. 1981). For a canonical neutron star with a mass of 1.4 , a radius of 10 km and a solar composition of the photosphere (i.e., with a hydrogen mass fraction of ), the Eddington limit is erg s-1 (see also Sect. 5.3). Therefore, we conclude that the persistent emission is with reasonable certainty always larger than 60% of the Eddington luminosity and on average perhaps 80–90%. This is at least three times higher than for any other superburster.
We note that the net bolometric peak flux as measured by Kuulkers et al. (2002b) for 5 ordinary Eddington-limited X-ray bursts from GX 17+2 ranges between 1.4 and erg cm-2s-1 (as measured on a 0.25 s time scale). Averaged over the complete expansion phases, the fluxes range between 1.2 and 1.3 erg cm-2s-1. These presumed Eddington-limited values are 40 to 50% smaller than the above-mentioned values for the persistent emission (more if the power extends to below 2 keV). Kuulkers et al. (2002b), on the basis of a similar comparison with persistent emission measured with RXTE in 3-20 keV, propose that this discrepancy can be explained if the burst emission is anisotropic (i.e., obscuration of part of the burst emission) and if the distance is 8 kpc.
5.2 Superburst phenomenology
The observations of decay rates provide a mixed view. The e-folding decay times of 0.7-2.2 hr are not really faster than for the other superbursters which range between 1 and 6 hr (see Fig. 7), but the scatter in both measurements is large. If one compares the average decay times, a marginal difference does emerge. The weight-averaged e-folding decay time for GX 17+2 is hr. If we discount the relatively short decay times for 4U 1820-303 and 4U 1636-536, the weight-averaged decay time for the other superbursters is hr. This is 50% larger. The two excluded systems may indeed be extraordinary: the exceptional status of 4U 1820-303 has already been eluded, and 4U 1636-536 is the only superburster for which multiple superbursts were detected (Kuulkers et al. 2004).
The net observed unabsorbed peak flux is similar over all 4 cases at erg cm-2s-1(bolometric). These fluxes are not equal to the Eddington limit for GX 17+2, but at least 20% less. They are 50 to 100% of the peak flux measured for ordinary Eddington-limited X-ray bursts. This is also observed in other superbursters except 4U 1820-303 and may be related to the gravitational redshift being higher during superbursts because of lack of photospheric radius expansion, in contrast to ordinary bursts. Alternatively, it is also not unusual that ordinary bursts from one source show a range in peak flux of tens of percents (even when considering only radius-expansion bursts; e.g., In ’t Zand et al. 2003b).
The bolometric fluence is measured to be between 4.0 and erg cm-2. An exception may be the last superburst which could be roughly twice as fluent. For an 8-12 kpc distance this translates to erg. This is between 50 and 100% of the superbursts seen from other systems whose energy output is between 6.5 and erg (excluding again the exceptional case of 4U 1820-303).
The superbursts were searched and found in data stretches when GX 17+2 is not in an obvious flaring state. The effective observing time on GX 17+2 in this non-flaring state for superbursts is 10.2 Msec. Thus, the mean recurrence time is d. The shortest actual observed recurrence time is 8.2 d. The mean value is 15 times smaller than the average value for all superbursters with persistent luminosities close to 0.1 times Eddington (In ’t Zand et al. 2004b).
In a number of superbursts reported in the literature, there is evidence for quenching of ordinary bursting behavior for periods after the superbursts between 1 week (in 4U 1735-44; Cornelisse et al. 2000) and 1 month (in KS 1731-260, Kuulkers et al. 2002a, and Ser X-1, Cornelisse et al. 2002). For GX 17+2, regular bursts (see Table 1) were detected 2.2 d after flare 2, 10.5 d after flare 3, 2.3 d after flare 4 and 12.8 days after flare number 6 (the delays for flares 3 and 4 were determined from bursts detected with RXTE and published in Kuulkers et al. 2002b). Therefore, quenching in GX 17+2, if at all present, is rather brief.
With regards to ignition, it is important to note that also for the superbursts in GX 17+2 ordinary ’precursor’ X-ray bursts were marginally detected whenever possible. This appears to be a general characteristic of any superburst. The question is whether the precursor is what triggers the superburst (and is truly a precursor) or vice versa. Given that precursors are often, but not always (e.g., 4U 1636-536; see Kuulkers 2004), less energetic than other X-ray bursts in the same object suggests that the precursor is merely a result of the superburst and not responsible for the superburst ignition. The precursors in GX 17+2 appear to be of the short variety. The statistical quality of the data does not allow an accurate check of whether these precursors are less energetic than such bursts seen otherwise in GX 17+2.
5.3 Comparison with theoretical models
We now compare the observed properties of the superbursts with theoretical models. We consider a 1.4 neutron star with , giving a surface gravity and redshift . The Eddington flux at the surface of the star is , where is the electron scattering opacity, and is the surface hydrogen mass fraction. The corresponding local Eddington accretion rate is given by , where is the gravitational energy release. For solar composition , we find , which we take as our fiducial accretion rate.
We first consider the overall energetics, using the mean properties of the flares. The total radiated energy is , where is the observed fluence. The column depth accreted between bursts is , where is the time measured by the observer, giving . The implied energy release per gram is , giving
| (1) | |||||
where . Since carbon burning to iron releases , the implied carbon fraction is %, although it may be a factor of smaller if photodisintegration of heavy elements enhances the energy release (Schatz et al. 2003a).
The inferred ignition column of agrees very well with the predictions of CB01. In Table 3, we show ignition conditions for accretion at calculated following CB01. We assume that the layer is heated from below by a flux coming from the crust, and adopt the value MeV per nucleon found by Brown (2000). Schatz et al. (1999) calculated the products of stable hydrogen/helium burning at the Eddington rate, and found that the rp-process produced mainly nuclei with masses –. Here, we consider a mixture of carbon (mass fraction ) and 64Ni (mass fraction ), and calculate the resulting ignition conditions. The agreement with the observed values is remarkable. For accretion at , we find , in excellent agreement with the mean properties of the flares from GX 17+2.
The inferred carbon mass fraction % is somewhat higher than found in calculations of rp-process hydrogen/helium burning. Schatz et al. (1999,2003b) find % for stable burning at . If the heavy nuclei are in the mass range rather than –, photodisintegration reactions could enhance the energy release by a factor of 2, giving %. However, Schatz et al. (2003b) show that there is an inverse correlation between and , making – more likely for larger . There are significant uncertainties in some of the nuclear data required for rp-process calculations (e.g. Woosley et al. 2004); however, the high inferred from the observations may prove problematic. Flare 4 is particularly restrictive, having a recurrence time of only days, giving . Such a short recurrence time can be obtained by an increase of accretion rate by % (see Table 3); however, the large burst energy requires if the energy release is supplied entirely by carbon burning, a factor of two larger than the mean value.
| () | ||||
|---|---|---|---|---|
| 1.1 | 0.2 | 2.4 | 4.5 | 31 |
| 1.8 | 0.4 | 0.97 | 3.7 | 8.0 |
∗following CB01. We assume a flux from the crust of MeV per nucleon. The local Eddington accretion rate is . We take the heavy nucleus to be 64Ni. A redshift correction of has been adopted to translate the superburst energy and recurrence time into the observer’s frame.
We have already noted that the exponential decay times of the flares from GX17+2 are slightly shorter than those of other superbursts. Cumming & Macbeth (2004) studied the thermal evolution of the burning layers as they cool following the thermal runaway. They showed that after a time (we do not show factors describing the composition of the layer), the flux decays as a power law . From their results, we find that
| (2) |
during the power law decay, where we apply redshift corrections to the flux and time. The observed decays are slower than predicted by equation (2). One way to see this is that after 2 hours, we expect %, about a factor of two lower than the observed value222We note that the dynamic range of the WFC measurements is too small to be able to measure the power law decay.
CM04 also estimated the time for which normal Type I bursts would be quenched following the superburst. They found that the critical flux above which Type I X-ray bursts are stabilized is erg cm-2s-1. Equation (2) then gives a quenching timescale . For flare 4, the quenching timescale is particularly short: taking and gives hours. This is in good agreement with the upper limits to the quenching times discussed earlier.
6 Conclusion
In 10.2 Ms of effective observing time on GX17+2, we have identified 4 flares which are very likely superbursts. This is the first time that superbursts are reported from a neutron star that is accreting matter near the Eddington limit. Their properties are consistent with the smaller ignition mass predicted by CB01 for these accretion rates. The average recurrence time of 30 d is 15 times shorter than for superbursters that accrete at 0.1 to 0.3 times the Eddington limit. The quenching time is less than 2 days, also an order of magnitude shorter than low luminosity superbursters. The decay rate and the radiation energy output of the superbursts is approximately half that of the low luminosity superbursters (excluding 4U 1820-303 and 4U 1636-56).
The observed recurrence times and quenching times agree very well with the results of CB01 for carbon shell flashes at . The inferred energy release of – implies a carbon fraction of %. This is larger than current calculations of the products of H/He burning suggest (Schatz et al. 2003b; Woosley et al. 2004), providing a new constraint on these models. In addition, the decay timescales, although shorter than for superbursts at lower accretion rates, are longer than the cooling models of CM04. A more detailed comparison of the CM04 and observed lightcurves is in progress; this should provide interesting constraints given the good agreement of ignition models and the ignition mass inferred from the energetics.
Acknowledgements.
We thank the referee, Lev Titarchuk, for a careful review and Erik Kuulkers for very useful discussions and comments on an earlier version of this paper. John Heise, Pietro Ubertini and Frank Verbunt are acknowledged for proposing the Galactic Center observation campaigns of the WFCs. Gerrit Wiersma, Jaap Schuurmans, Nuovo Telespazio and the BeppoSAX Science Data Center are thanked for continued support. JZ acknowledges support from the Netherlands Organization for Scientific Research (NWO). AC is supported by NASA through Hubble Fellowship grant HF-01138 awarded by the Space Telescope Science Institute, which is operated by the Association of Universities for Research in Astronomy, Inc., for NASA, under contract NAS 5-26555.References
- (1) Boella, G., Butler, R.C., Perola, G.C., et al. 1997, A&AS, 122, 299
- (2) Brown, E.F. 2000, ApJ, 531, 988
- (3) Callanan, P.J., Curran, P., Filippenko, A., et al. 2002, ApJ, 574, L143
- (4) Cornelisse, R., Heise, J., Kuulkers, E., Verbunt, F., & in ’t Zand, J.J.M. 2000, A&A, 357, L21
- (5) Cornelisse, R., Kuulkers, E., in ’t Zand, J.J.M., Verbunt, F., & Heise, J. 2002, A&A, 382, 174
- (6) Cumming, A. 2003, ApJ, 595, 1077
- (7) Cumming, A., & Bildsten, L. 2001, ApJ, 559, L127 (CB01)
- (8) Cumming, A., & Macbeth, J. 2004, ApJ, 603, L37 (CM04)
- (9) Di Salvo, T., Stella, L., Robba, N.R., et al. 2000, ApJ, 544, L119
- (10) Fujimoto, M.Y., Hanawa, T., & Miyaji, S. 1981, ApJ, 247, 267
- (11) Hansen, C.J., & van Horn, H.M. 1975, ApJ, 195, 735
- (12) Hasinger, G., van der Klis, M., Ebisawa, K., Dotani, T., & Mitsuda, K. 1990, A&A, 235, 131
- (13) Homan, J., van der Klis, M., Jonker, et al. 2002, ApJ, 568, 878
- (14) Hoshi, R., & Asaoka, I. 1993, PASJ, 45, 567
- (15) In ’t Zand, J.J.M., Kuulkers, E., Cornelisse, R., Verbunt, F., & Heise, J. 2003a, A&A, 411, L487
- (16) In ’t Zand, J.J.M., Hulleman, F., Markwardt, C.B., et al. 2003b, A&A, 406, 233
- (17) In ’t Zand, J.J.M., Verbunt, F., J. Heise, et al. 2004a, in Proc. ’The Restless High-Energy Universe’, eds. E.P.J. van den Heuvel, J.J.M. in ’t Zand & R.A.M.J. Wijers, Nucl. Phys. B Proceedings Supplements, 32, 486
- (18) In ’t Zand, J.J.M., Cornelisse, R., Kuulkers, E., Verbunt, F., & Heise, J. 2004b, in Proc. ’X-ray Timing 2003: Rossi and Beyond’, eds. P. Kaaret, F.K. Lamb and J.H. Swank (Melville, NY: American Institute of Physics), in press
- (19) Jager, R., Mels, W.A., Brinkman, A.C., et al. 1997, A&AS, 125, 557
- (20) Joss, P. C. 1977, Nature, 270, 310
- (21) Kuulkers, E. 2002, A&A, 383, L5
- (22) Kuulkers, E., in ’t Zand, J.J.M., van Kerkwijk, M.H., et al. 2002a, A&A, 382, 382
- (23) Kuulkers, E., Homan, J., van der Klis, M., Lewin, W.H.G., & Méndez, M. 2002b, A&A, 382, 947
- (24) Kuulkers, E. 2004, in Proc. “The Restless High-Energy Universe”, eds. E.P.J. van den Heuvel, J.J.M. in ’t Zand and R.A.W. Wijers, Nucl. Phys. B Proceedings Supplements, 32, 466
- (25) Kuulkers, E., in ’t Zand, J.J.M., Homan, et al. 2004, in Proc. ’X-ray Timing 2003: Rossi and Beyond’, eds. P. Kaaret, F.K. Lamb and J.H. Swank (Melville, NY: American Institute of Physics), in press (astro-ph/0402076)
- (26) Lewin, W.H.G., van Paradijs, J., & Taam, R.E. 1993, Space Sci. Rev., 62, 223
- (27) Maraschi, L., & Cavaliere, A. 1977, Highlights of Astronomy, 4, 127
- (28) Morrison R., & McCammon D. 1983, ApJ, 270, 119
- (29) Schatz, H., Bildsten, L., Cumming, A., & Wiescher, M. 1999, ApJ, 524, 1014
- (30) Schatz, H., Bildsten, L., & Cumming, A. 2003a, ApJ, 583, L90
- (31) Schatz, H., Bildsten, L., Cumming, A., & Ouellette, M. 2003b, Nucl. Phys. A, 718, 247
- (32) Strohmayer, T.E., & Brown, E. 2002, ApJ, 566, 1042
- (33) Strohmayer, T.E., & Markwardt, C.B. 2002, ApJ, 577, 337
- (34) Strohmayer, T.E., & Bildsten, L. 2003, in Compact Stellar X-Ray Sources, eds. W.H.G. Lewin and M. van der Klis, Cambridge University Press, in press (astro-ph/0301544)
- (35) Taam, R. E. and Picklum, R. E. 1979, ApJ, 233, 327
- (36) Woosley, S., & Taam, R.E. 1976, Nature, 263, 101
- (37) Woosley, S., Heger, A., Cumming, A., et al. 2004, ApJS, 151, 75
- (38) Wijnands, R. 2001, ApJ, 554, L59