XMM-Newton EPIC Observation of the Galaxy Cluster A3667 ††thanks: Based on observations with XMM-Newton, an ESA Science Mission with instruments and contributions directly funded by ESA Member States and the USA (NASA)
The Abell cluster of galaxies A3667 was observed with XMM-Newton in 6 partially overlapping pointings. We present here the resulting X-ray surface brightness, temperature, entropy and pressure maps and discuss the structure of this cluster on scales from 0.1 to 30 arcminutes. Based on these observations we refine the origin of the A3667 cold front to the displacement of the low entropy, high metal abundance gas from the current pressure peak of the cluster. We argue that the mushroom shape of the cold front observed here is similar to what is seen in some numerical simulations. We also present the first evidence for a dynamically significant angular momentum in the cold front.
Key Words.:
A3667 – cluster of galaxies – intergalactic medium – large-scale structure of the Universe – X-rays1 Introduction
| Date | Name of | RA(2000) | DEC(2000) | performed/effective exposures | XSA ID | Orbit | |
|---|---|---|---|---|---|---|---|
| Observation | pn (ksec) | MOS1–2 (ksec) | |||||
| 2000 Sep 9 | A3667 f1 | 20 13 03.5 | -56 53 00 | 14.8/2.4 | 16.5/5.7 - 16.3/5.1 | 0105260101 | 144 |
| 2000 Oct 13 | A3667 f2 | 20 11 08.8 | -56 38 29 | 15.0/7.6 | 18.9/0.4 - 18.9/0.8 | 0105260201 | 155 |
| 2000 Oct 3 | A3667 f3 | 20 13 07.0 | -56 43 08 | 13.1/13.1 | 17.0/17.0 - 17.0/17.0 | 0105260301 | 150 |
| 2000 Oct 3 | A3667 f4 | 20 12 12.5 | -56 37 15 | 12.7/12.7 | 16.6/16.6 - 16.6/16.5 | 0105260401 | 150 |
| 2000 Oct 4 | A3667 f5 | 20 10 55.7 | -56 48 06 | 13.1/13.1 | 13.1/11.6 - 13.1/11.8 | 0105260501 | 150 |
| 2000 Oct 2 | A3667 f6 | 20 11 53.2 | -56 54 45 | 21.6/18.8 | 25.5/23.8 - 25.5/23.7 | 0105260601 | 149 |
When the Abell Cluster A3667 was observed with ROSAT (Knopp et al. gk96 (1996)), the X-ray image revealed a surface brightness of varying ellipticity and a surface brightness discontinuity SE from the core. The counting statistics of the ROSAT observation was too low to obtain a temperature map, but it was concluded that the cluster is not in a relaxed configuration but rather in the process of merging since the fit to a constant temperature was rejected at 95% confidence. Evidence was found for excess emission towards the NW, apparently coincident with a group of galaxies.
Analysis of Chandra observations by Vikhlinin et al. (2001a and 2001b ) made A3667 a definition of a new phenomenon, a contact discontinuity or a cold front, associated with the transonic motion of the cluster core. In the follow-up paper, a hydrodynamic instability was identified perpendicular to the cold front (Mazzotta et al. pm02 (2002)) pointing to the transient nature of the cold front, as it is gradually disrupted via Kelvin-Helmholtz instability.
Since the discovery of the cold front, a number of numerical experiments have identified similar features observed in the process of cluster merging. Further, Markevitch et al. (mm03 (2003)) have shown that 70% of Chandra images show sharp edges, indicating a wide-spread occurrence of this phenomenon.
Important insight on the possible formation of cold fronts has been given by the numerical simulations of Heinz et al. (sh03 (2003)), where it has been suggested that the cold front is produced by the upstream motion of low entropy gas from the minimum of the gravitational potential of the merging subcluster. The low temperature of the front was produced even when the initial state of the gas was isothermal, with cooling due to adiabatic expansion. Other simulations (e.g. Ricker & Sarazin rs01 (2001)), suggest an important role of the angular momentum initially possessed by the gas associated with the merger of two cluster cores.
In this Paper we present the result of 6 partially overlapping observations of the Abell cluster A3667 with the EPIC detectors on board XMM-Newton. In Section 2 we describe the observations and present the data reduction. In Section 3 we discuss the structure of the X-ray surface brightness distribution on large scales, the hardness ratio and temperature map of the cluster as well as deduced pressure and entropy maps. We confirm some of the features of the cold front suggested by Heinz et al. (sh03 (2003)), and also identify the features indicating the presence of significant angular momentum in the cold front.
A3667 is at a redshift of 0.053. With a Hubble constant of 70 km sec-1 Mpc-1, and , the luminosity distance is 237 Mpc and the angular scale is 62 kpc per arcminute.
2 Observations and Data Reduction
The region of the Abell cluster of galaxies A3667 was observed by the XMM-Newton Satellite (Jansen et al. fj01 (2001)) as part of the GTO program of the XMM telescope scientist. Table 1 shows the journal of the observations with information on the pointing directions and observing times.
In the analysis that follows we will present the data obtained with the two MOS-CCD cameras (Turner et al. mt01 (2001)), operated in their full-frame mode, and with the pn-CCD camera (Strüder et al. ls01 (2001)), operated in the extended full-frame mode. See the above papers for a description of the different modes. All cameras used their medium filters to block the visible light.


2.1 Merged image production
Our goal here is to produce soft and hard images merging all EPIC detectors and pointings. Initial steps of data reduction were performed using XMMSAS 5.3. During the observations the proton induced background often varied, and in flares reached count rates up to several hundred counts/sec in the energy band from 0.15 to 10 keV. To increase the signal-to-noise ratio and also to minimize the problems of de-vignetting of residual proton induced events, we selected the good time intervals where the detector countrate in the 10–15 keV band did not exceed a given threshold. While in our previous investigations we have used a fixed threshold (e.g. Briel et al. ub01 (2001)), in this work we have adopted the approach based on the analysis of the countrate histogram, as described in Zhang et al. (zh03 (2004)). This method is more sensitive to the background conditions during the observations and has now been adopted in the analysis of other groups (e.g. De Luca & Molendi lm04 (2004)) The resulting net-observing times are given in Table 1 for the different instruments. As can be seen in that table, the fields f1 and f2 are heavily contaminated by proton flares.
With these screened photon event files we produced MOS and pn images of the individual observations in the energy bands from 0.8 to 2.0 and 2.0 to 7.5 keV. To reduce the widths of the gaps in the pn-images, we included photons near the pn-CCD borders, near bad pixels, and near offset columns. This can be done if one is only interested in producing qualitative images in wide energy bands. For the spectral fitting, described in §2.3, we exclude all those border photons, since a small fraction of those photons have the wrong energy, typically due to the registration of a double event pattern as a single event.
The XMM-Newton mosaic observation of A3667 covers a circle of about radius centered on RA=303.02862, Decl=-56.75183 (J2000). Merging the individual observations together have shown that the signal was above the background only in the central of the cluster due to high level of the non X-ray background. As this leaves 3/4 of the mosaic out, we have used the outermost parts of the mosaic for the in-field background estimates (see e.g. Zhang et al. zh03 (2004) and Finoguenov et al. 2003a for the details) to finally extend the imaging to .
We assumed that the total background for each observation suffered no vignetting. This assumption is approximately correct for the non X-ray instrumental background as well as the soft proton flares (Lumb et al. dl02 (2002)). It is not true of the unresolved X-ray background. However, background subtraction is most important for the hard (2–7.5 keV) band where the unresolved X-ray background is a few percent of the total. Thus the error coming from assuming the X-ray background is unvignetted is comparable to the 4% error introduced by the assumption of no vignetting in the soft proton component (Lumb et al. dl02 (2002)).
We generated the flat background maps using exposure maps with no vignetting information (also known as chip masks), normalized them separately for each observation and instrument to the observed background level using data outside the central . We avoided point sources in selecting the regions for the background normalization. After subtracting these background maps from each image, we corrected the residual for vignetting and exposure using the latest calibrations (Lumb et al. dl03 (2003)), which have been incorporated within the XMMSAS 6.0 release. Finally we combined the MOS and pn data by normalizing the exposure maps by a factor of 2.4 to account for the overall difference in the sensitivity between the MOS and pn. We also correct the MOS hard band images by an additional factor of 1.05. These corrections yield the same MOS and pn hardness ratios for the same temperature in the 2–12 keV range to better than 0.5 keV.
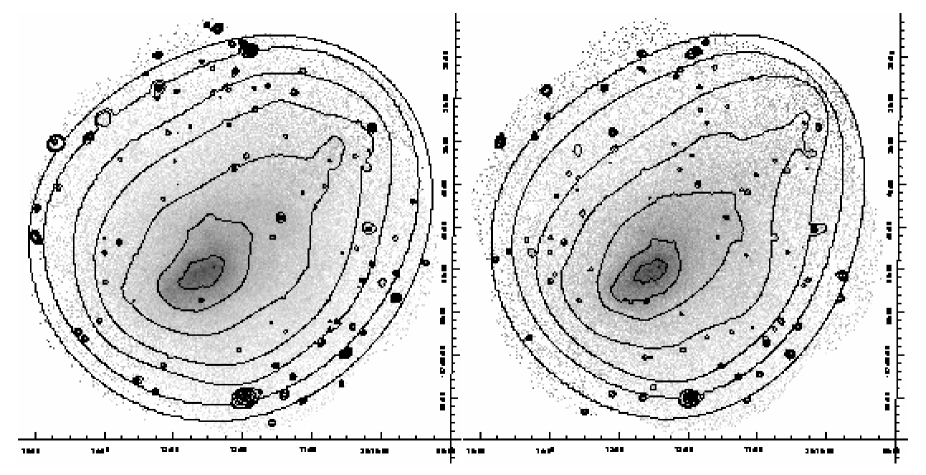
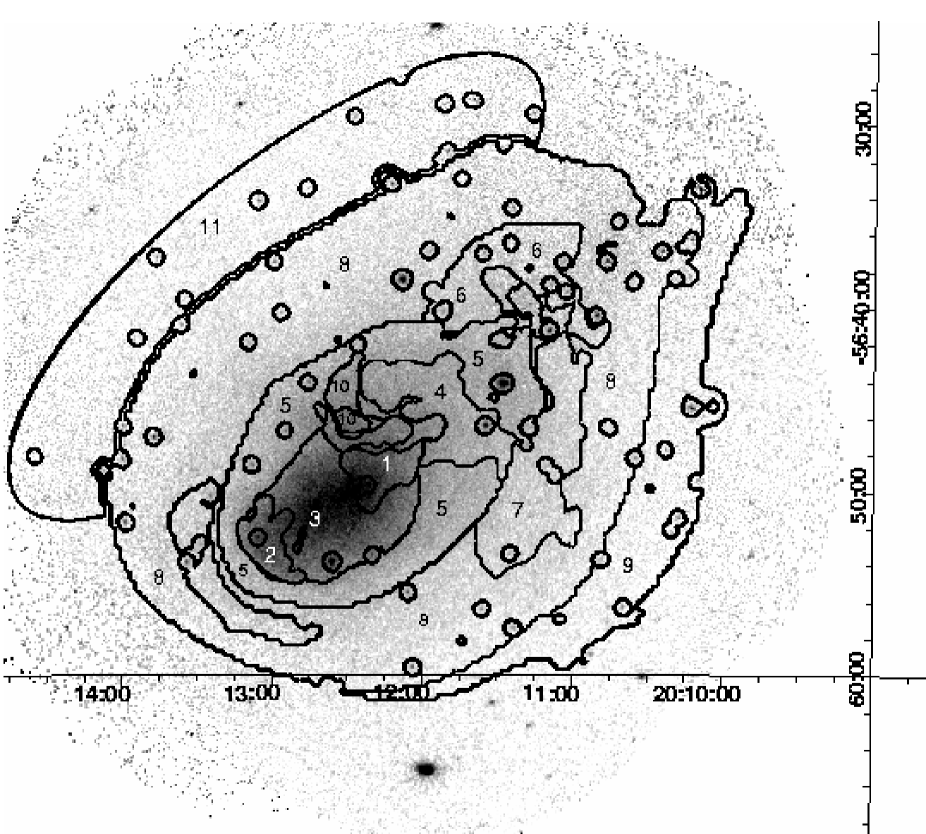
The resulting merged pn plus MOS background subtracted and exposure corrected images in the 0.8–2 and 2–7.5 keV bands are shown in Fig.1. The images are devoid of any detector structure because we used all available photons near CCD borders, bad pixels and columns as well merging different pointings and instruments. The overlaid contours in units of MOS1 counts s-1 arcminute-2 are from the wavelet decomposition of the same image, as described below.
2.2 Wavelets analysis
The broad-band images can be used for making visible intensity structures, and also variations of the temperature of the X-ray emitting plasma by producing hardness-ratio maps. In addition, one can produce pressure and entropy maps of the plasma by combining the surface brightness map and the hardness ratio map. Useful hardness ratio maps can only be produced from smoothed surface brightness maps. There exists a variety of different smoothing procedures like top-hat smoothing, Gaussian smoothing or adaptive smoothing (e.g. Churazov et al. ec99 (1999)). We applied the wavelet decomposition method, which is described in detail by Vikhlinin et al. (av98 (1998)). The advantage of using wavelets consists in background removal by spatial filtering and a control over the statistical significance of the detected structure. Complications arise due to splitting the image into discrete scales, which we overcome by additional smoothing applied before producing the hardness ratio map. Use of wavelets provide us with a quick and dirty method to identify the regions susceptible to temperature variations. Another important feature is the high spatial resolution achieved in detecting the small-scale structure, as wavelets do not smear the data.
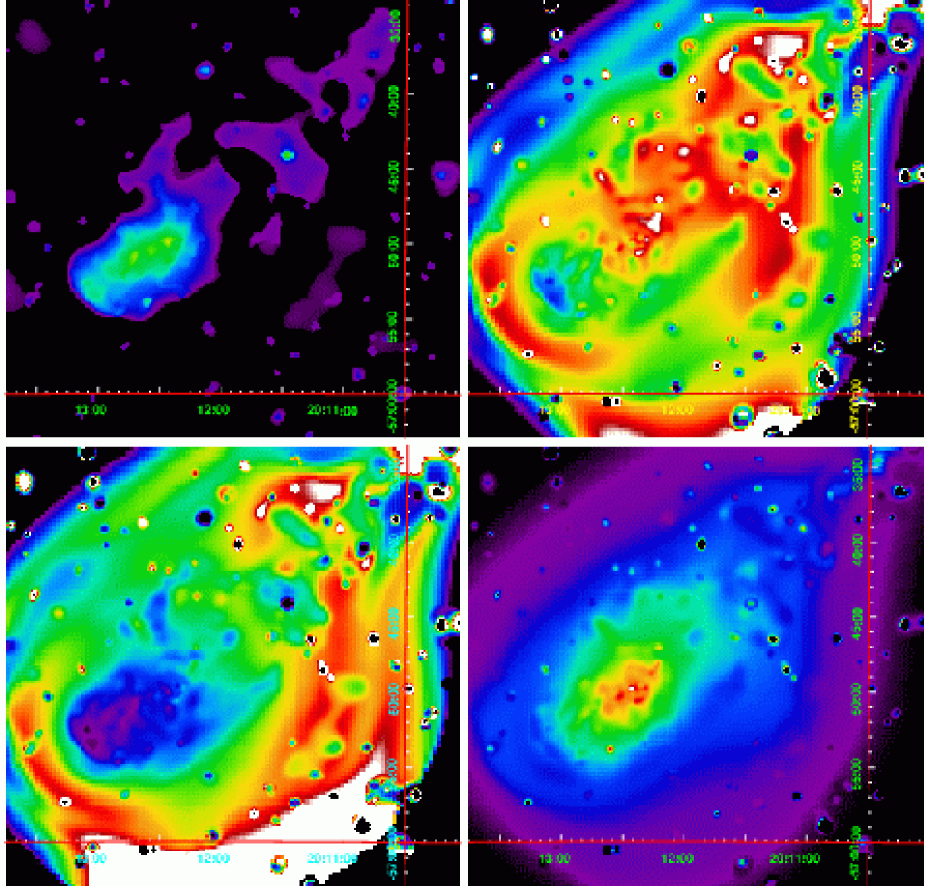
We show the results of the broad-band image investigation in Fig.2. In the top left panel we show the small-scale structure detected in the 0.8–2 keV image, using the wavelet decomposition method. The top right is the hardness of the emission deduced from the ratio of the wavelet-reconstructed images in the 0.8–2 and 2–7.5 keV bands. Using a calibrated template, the hardness can be interpreted as temperature, as given in the figure caption. The lower left and right images are the projected pressure and entropy maps respectively. They are constructed using the wavelet-smoothed surface-brightness map in the 0.8–2 keV energy range as an indicator of the electron density squared and the hardness ratio map as temperature distribution, and using the definitions of the pressure and of the entropy . There is an important difference between bolometric X-ray luminosity and a luminosity of the nearby clusters in the soft band (typically ranging from 0.5 or so to 2 keV), that is used in deriving the formulae for pseudo pressure and entropy. The difference stems from specifics of the cooling function for clusters hotter than 2 keV. While bolometric luminosity depends on , our calculations for both pn and MOS show that luminosity in the soft band is to a 10% precision constant with changing temperature in the 2–15 keV range and is actually decreasing with increasing temperature. Böhringer (1996) first pointed out this temperature insensitivity of the conversion between soft band counts to flux for nearby clusters in application to the ROSAT PSPC data. He also mentioned that absence of the temperature dependence is valid for a wide range of galactic values.
2.3 Spectral analysis
The spectral analysis was carried out using only the pn data. Background subtraction here is more demanding than for the imaging analysis since the spectrum of the background must be estimated, not just its overall level. Therefore we have investigated several different background accumulations, one by Read & Ponman (ar03 (2003)) and others performed later in the XMM mission (e.g. APM08279+5255; Hubble Deep Field South). We find that for the A3667 observation the detector background in the 10–15 keV range corresponds closest to the accumulations of Read & Ponman (ar03 (2003)), which consists of several observations performed around the observing dates of the A3667 mosaic. Hence for the following analysis we used the Read background.
A first check was to reproduce an integral temperature and compare it with values measured by other X-ray instruments. With ROSAT, Knopp et al. (gk96 (1996)) found a temperature of 6.3 +0.5/-0.6 keV in a circle with a radius of centered on the peak emission. Using ASCA, Markevitch et al. (mm98 (1998)) found a temperature of 7.0 0.6 keV in the same region. As the cluster exhibits temperature structure, we find the XMM derived integral temperature inside the radius to depend on the energy range selected for the analysis. From our data, we find a temperature of keV for the 0.4–10 keV range and keV if we set the low energy threshold in the 0.5 to 1 keV range, but both fits are at an unacceptable . Acceptable values of are obtained with low energy cuts of 1.5 keV or above, with the resulting temperature of being no longer a function of the selected energy range. This resulting temperature is in very good agreement with the ROSAT and ASCA measurement. We also find element abundances of Si of solar, S of solar and Fe of solar (using the photospheric values from Anders & Grevesse ea89 (1989) as a reference). These values agree with the results on the element abundance in clusters obtained by ASCA (e.g. Finoguenov et al. af00 (2000) and 2003b ; Baumgartner et al. wb03 (2003)) and confirm both the prevalence of SN II in the enrichment and a reduced S yield in SN II, as found in the above ASCA studies.
To determine a temperature map from the XMM-Newton mosaic, we used the surface brightness and hardness ratio map, described in the previous section, to define independent regions for spectral fitting. A mask file was built by using the changes in the hardness ratio that correspond to temperature in the ranges 3.0-3.5-3.8-4.0-4.2-4.4-4.8-5.2-5.6-6.0-6.5-7.0-7.5-8-9-10 keV and which have equal intensity within a factor of two. Taking the isolated regions of equal temperature and intensity separately and imposing the criteria that the regions should be larger than the PSF width () and contain more than 1000 counts in the raw pn image, we obtain the final mask used to extract the photons for the spectral fitting. That procedure led to 70 regions for which we performed the spectral analysis.
For the spectral fits, we have chosen a single-temperature APEC model. Spectral analysis of the regions of low surface brightness reveals the presence of an excess soft X-ray emission at energies below 0.7 keV. This component is not required in the regions of high X-ray intensity, such as the cold front, but causes systematic differences in the derived temperature in the single-temperature fits as a function of selected energy band otherwise. A proper analysis of this component requires a detailed understanding of the background accumulation, such as that performed in Finoguenov et al. (2003a ), and is beyond the scope of the present paper. We have excluded the effect of the soft component by selecting the energy band starting at 0.75 keV. The upper energy boundary is determined by strong instrumental background above the 7.9 keV. For selected regions, which do not suffer from background problems mentioned above, we have also performed a spectral analysis in the 0.4-10 keV band and have confirmed our results obtained in the 0.75 to 7.9 keV range.
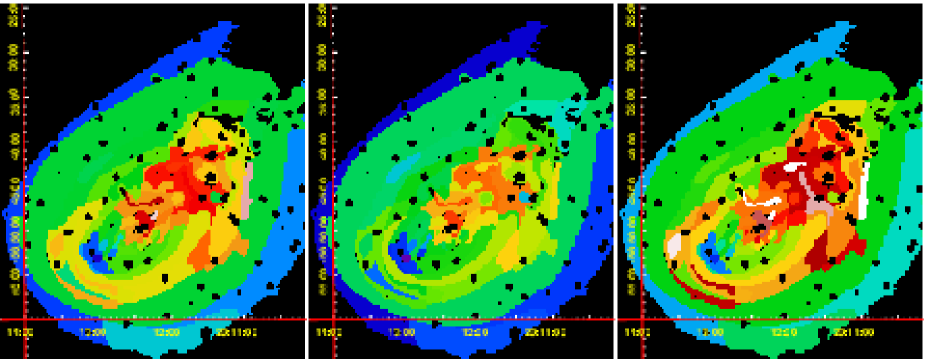
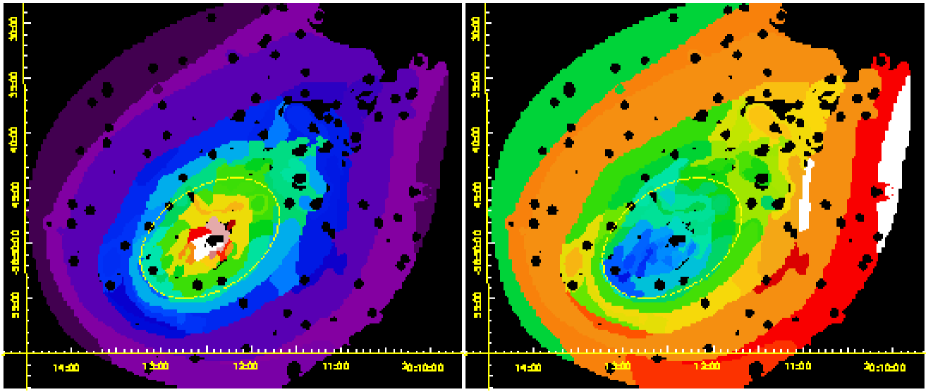
The results of the fitting procedure are shown in Fig. 3. Here we show in the left panel the temperature map and in the middle and right panel the lower and upper 1 limits of the temperatures respectively. We used the fitted temperature map in combination with the XSPEC APEC normalization factor K, which is a measure of the surface-brightness, to produce the projected pressure and entropy maps. A more detailed description of this procedure is given in Henry et al. (ph04 (2004)). Both pressure and entropy maps are shown in Fig. 4.
2.4 Hardness ratio vs temperature map
In the selection of zones for the spectral analysis we have aimed to confirm the main features seen in the hardness ratio map. To these belong the cold front, the region in front of the cold front to the south-east, the material in which the cold front is embedded, and also the region of the tail behind the cold front to the north-west. With a small number of zones on a half an arcminute scale, most of the information is obtained on a few arcminute scale inside the central . At outer radii the structure is analyzed on the scale.
Although the methods involved in producing the hardness ratio and temperature maps are very different, the results are very similar. Features seen in both with nearly the same morphology are the cold front and its immediate environment as well as most of the temperature variations in the tail. Although some of the temperature in the outskirts are confirmed, the scatter between the fitted temperatures and the temperatures deduced from hardness ratio estimate increases. The reason for that is probably the extrapolation of the cluster shape on the largest scale by wavelets into the zones of low signal-to-noise ratio. To illustrate that we point out that part of the outermost wavelet contour in Fig.1 passes though an unobserved region.
| N | Name | N | S | P, | ||||||||
|---|---|---|---|---|---|---|---|---|---|---|---|---|
| keV | d.o.f. | cm-3 | keV cm 2 | erg cm-3 | kpc | kpc | ||||||
| 1 | nkT peak | 1.16 | 400 | 26 | 281 | |||||||
| 2 | cold front | 1.31 | 152 | 236 | 439 | |||||||
| 3 | core | 1.40 | 599 | 27 | 360 | |||||||
| 4 | hot tail | 1.25 | 337 | 224 | 563 | |||||||
| 5 | main-1 | 1.41 | 623 | 208 | 894 | |||||||
| 6 | tail-N | 1.51 | 118 | 603 | 1167 | |||||||
| 7 | tail-S | 1.24 | 177 | 424 | 905 | |||||||
| 8 | main-2 | 1.46 | 656 | 349 | 1492 | |||||||
| 9 | main-3 S | 1.68 | 128 | 680 | 1652 | |||||||
| 10 | shear bar | 0.85 | 114 | 166 | 456 | |||||||
| 11 | main-3 N | 1.07 | 114 | 823 | 1549 |
3 Discussion
3.1 Basic properties of A3667
In order to tabulate the basic properties of A3667 we combined together adjacent spectral regions having the same temperature to within 1 keV. We list the properties obtained this way in Tab.2 with their errors for one parameter. Col. (1) labels the region according to Fig.5, with the name of the region reported in (2), (3) lists temperature in keV, (4) iron abundance as a fraction of solar photospheric value of Anders & Grevesse (1989), (5) XSPEC normalization, (6–7) statistical quality of the fit. Derived quantities, that use an estimation of the projected length, as described below are reported in cols.(8–11). These are electron density, entropy, pressure and the (local) gas mass. No account for the gas mass not associated with the directly observed component was attempted.


Estimation of the projected length has been done assuming a cone geometry, in which every region is part of a spherical shell that has its inner and outer radii passing through the nearest and furthest points of the selected region, respectively. This spherical shell is further intersected by a cylinder, that is directed towards the observer and in the observer plane has the cross-section of the selected region. (A more detailed description of this estimation is given in Henry et al. (ph04 (2004))). We have selected the main pressure peak to be the centre. It also corresponds to the position of the brightest galaxy in A3667 and a center of large-scale potential revealed by the weak lensing (Joffre et al. mj00 (2000)).
There are a number of features seen in the table. First, the cold front is the most metal rich zone in A3667. Second, the cold front does not have the highest pressure. Third, the zones behind the cold front (towards the north-west) have higher abundance, compared to the bulk of the cluster, yet lower than of that of the cold front, suggesting that mixing is occurring there. Fourth, region number 4, the hot tail, is at the same distance from the pressure peak along the major axis as the cold front. It has a similar pressure, a factor of two higher temperature, more than a factor of two higher entropy and lower element abundance compared to the cold front. But the gas in region 4 seems to be of the same origin as that in region 5, just in front of the cold front, because they have the same iron abundance and the same entropy. The difference in temperatures between regions 4 and 5 is due to adiabatic expansion of region 5, and indeed the pressures and temperatures of the two regions follow the adiabat = constant.
Let’s consider regions 1, 2 and 3, which lie in a line between the pressure peak and the cold front. Both the entropy and metallicity of region 1 and the adjacent region 3 are the same and are intermediate between region 2, the cold front, and the rest of the cluster, regions 4 - 9 and 11. This suggests that the material in regions 1 and 3 was previously like the rest of the cluster but has become polluted by disrupted cold front gas. The original cold front gas possibly attained its higher metallicity because it was associated with the brightest cluster galaxy. If this suggestion is true, then regions 1 and 3 have been 30% polluted by cold front gas. The initial mass of the high metallicity gas that became the cold front is the present mass of region 2 plus 30% of the present mass of regions 1 plus 3 or . So the cold front only retains about 30% of its original gas (its present mass relative to the initial mass of the high metallicity gas). About 50% of the original gas now resides in region 3 and the remaining 20% in region 1.
If the gas of the cold front were located at the pressure peak of A3667 its temperature would be keV, which is similar to the temperature of the main component. Heinz et al. (2003) claimed that it is possible to reproduce the temperature variations in A3667 even having an isothermal temperature distribution at the beginning. Repeating the same calculation as for the cold front we conclude that this proposal is consistent with our data as any temperature variations could be reproduced via adiabatic compression and expansion, assuming an initial temperature of 5.9 keV. Two caveats of this scenario are: (1) isothermal clusters do not show a strong iron abundance gradient (De Grandi & Molendi sd01 (2001)), and (2) the original 5.9 keV temperature, if a virial temperature, implies a more massive object then a group.
Mazzotta et al. (2002) report Chandra observations of a 300 kpc long filamentary surface brightness enhancement. The brightest section of this feature is in our region (10) and it is clearly seen in all four XMM maps: surface brightness, temperature, entropy and pressure. Mazzotta et al. interpret this feature, and a similar sized surface brightness decrement, as a shear (Kelvin-Helmholtz) instability that mixes the colder gas of the merging object with the hotter ambient material of the main cluster. Our data provide support for this interpretation. We call region (10) the shear bar, or bar for short. Material in the bar seems to originate from the gas in the core (region 3) because they both have the same temperature and Fe abundance. Mazzotta et al. (2002) also noted that the 6 keV gas of the bar is the same as that in the core and is surrounded by hotter 8 keV ambient gas. New in our data is the agreement of the abundances. We also mention that the filamentary structure in the entropy map of the cold front, which we have called the stem of the mushroom, has similar projected dimensions as that of the bar and so may have similar origin. More detailed study of the entropy/pressure features associated with the development of hydrodynamical instabilities in A3667 core will be presented elsewhere (Finoguenov et al., in preparation).
In Fig.6 we compare the obtained entropies and pressures with known scaling relations. In the adopted cosmology, the estimate of the is 1.17 Mpc, where the scaling of with temperature is taken from Finoguenov et al. (2001) and the temperature of A3667 is taken as 7.1 keV. As both entropy and are scaled by a similar power of temperature, the deviation of data points in Fig.6 from the scaled entropy profile of Ponman et al. (2003) is not very sensitive to the adopted temperature. As discussed in Ponman et al. (2003), normalization of the scaled entropy is 30% different between cold and hot clusters. The normalization for the hot clusters fits the A3667 data better, thus confirming the trend seen in Ponman et al. (2003).
Presence of the disturbed core in A3667 reveals itself in Fig.6 as a scatter in the entropy plot, while the pressure is monotonically decreasing. In the pressure plot region 6 exhibits a slightly higher pressure and is associated with the dark matter potential of the group. The regions located at exhibit low entropy, this is not very typical of other clusters and is probably related to the merger scenario of A3667, where a merging small group brought low-entropy gas with it.
3.2 Pressure and entropy maps of A3667
The pressure map appears to be rather symmetric around the center. However, a strong ellipticity is observed with the major axis directed towards the cold front. The minor to major axis ratio is 0.68. Beyond 6.8′ (430 kpc) north-west from the center of A3667 along the major axis, the pressure in the tail of A3667 becomes larger than the pressure the same distance to the south-east, which is beyond the cold front. This happens roughly between the two main galaxies of A3667 and could well reflect the potential well of the two merging components. Alternatively, this asymmetry could be due to pressure enhancement associated with the turbulence in the tail of the cold front. Since the shift of the pressure centroid on even larger scale of 20′ (1.3 Mpc) is still observed, where turbulence is neither seen nor expected, the first interpretation is favored.
3.3 New features in the XMM-Newton observations and some interpretations
(1) We observe structure in the cold front, best seen in the entropy maps of Figures 2 and 4. The structure resembles a mushroom head and stem and bears a close resemblance to the entropy structure at 3 and 4 Gyrs after core passage in the simulation of Heinz et al. (sh03 (2003)).
(2) We find an offset of the mushroom from the pressure peak. Also the pressure peak coincides with the brightest cluster galaxy. The pressure map of A3667 exhibits a symmetry around the center, while the entropy map does not. In combination with (1) this can be interpreted as a late stage of the disruption of the core of A3667 by the Rayleigh-Taylor instability. Such instabilities are also seen in the simulations of Ricker & Sarazin (2001).
(3) We observed tails of the low-entropy gas coming off the concave surface of the cold front (to the north-west).
(4) There is an elongation in the pressure and entropy maps to the north-west from the A3667 center, which we associate with the second galaxy concentration located there.
(5) In addition to the cold front there is another low temperature feature, which is located west of the cold front and extends about 600 kpc towards the north-west, starting at about RA = 20h 12m 25s, DEC = -56∘ 55′ 00′′, best seen in the temperature map of Fig. 2 as a green elongated area. This is a first indication of the deviation in the cold front from the symmetry in the observer’s plane and could be due to non-negligible angular momentum possessed by the cold-front.
(6) The positional angle of the major axis of the main pressure core is different by from the positional angle of the major axis of the rest of the cluster. The direction from the pressure peak to the center of the cold front is the same as the positional angle of the main cluster.
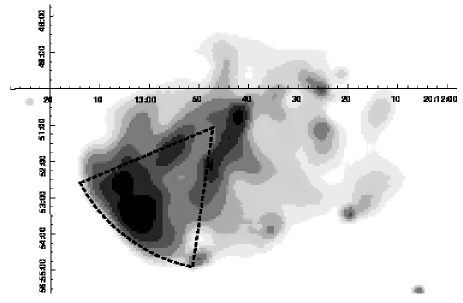
(7) A comparison of the location of the region with minimum entropy in the XMM data (the cold front) with the sharp edge observed by Chandra shows that the XMM region is shifted towards the north-east edge of the cold front (see Fig. 7). This reinforces the conclusion drawn from point (5) that the cold front has a velocity component in the north-east direction.
4 Summary
We have analyzed 6 partially overlapping observations of the nearby galaxy cluster A3667, done with the XMM-Newton X-ray observatory. We could produce surface brightness images in different energy bands out to a radius of 21 arcminutes. The large grasp of the observatory enabled us to produce temperature, pressure and entropy maps done to unprecedented precision. We confirm the findings of the Chandra observations, especially the cold front. In addition, we find structure in the cold front, best seen in the entropy map, which resembles a mushroom shape, very similar to recent simulations of the dynamics of cold fronts. The pressure map shows symmetry around its center, which is coincident with the maximum of the surface brightness map. We find small scale fluctuations in the inner part of the pressure map, probably caused by turbulent shock waves. Comparing our entropy map with the high spatial resolution surface brightness map of the cold front, obtained with Chandra, we find a significant offset of the minimum entropy region from the cold front, which we interpret as signs of angular momentum of the cold front.
Acknowledgements.
The XMM-Newton project is supported by the Bundesministerium für Bildung und Forschung/Deutsches Zentrum für Luft- und Raumfahrt (BMFT/DLR), the Max-Planck Society and the Heidenhain-Stiftung, and also by PPARC, CEA, CNES, and ASI. AF acknowledges receiving the Max-Plank-Gesellschaft Fellowship and support from the Verbundforschung grant 50 OR 0207 of the DLR. J. P. Henry thanks Prof. G. Hasinger for the hospitality at the MPE. We thank the anonymous referee as well as Silvano Molendi and Sebastian Heinz for useful comments, which improved the paper.References
- (1) Anders, E. and Grevesse, N. 1989, GeCoA, 53, 197
- (2) Baumgartner, W.H., Loewenstein, M., Horner, D.J., Mushotzky, R.F. 2003, submitted to ApJ, astro-ph/0309166
- (3) Böhringer, H. 1996, proc. ’Röntgenstrahlung from the Universe’, eds. Zimmermann, H.U., Trümper, J.E., Yorke, H., Würzburg, MPE rep. 263, 537
- (4) Briel U.G., Henry J.P., Lumb D.H., et al. 2001, A&A, 365, L60
- (5) Churazov, E., Gilfanov, M., Forman, W., Jones, C. 1999, ApJ, 520, 105
- (6) De Grandi, S. and Molendi, S. 2001, ApJ, 551, 153
- (7) De Luca, A. and Molendi, S. 2004, A&A, 419, 837
- (8) Finoguenov, A., David, L. P., Ponman, T. J. 2000, ApJ, 544, 188
- (9) Finoguenov, A., Reiprich T., Böhringer H. 2001, A&A, 368, 749
- (10) Finoguenov, A., Briel, U.G. and Henry, J.P. 2003a, A&A, 410, 777
- (11) Finoguenov, A., Burkert, A., Böhringer, H 2003b, ApJ, 594, 136
- (12) Heinz, S., Churazov, E., Forman, W. and Briel, U.G. 2003, MNRAS, 346, 13
- (13) Henry, J.P., Finoguenov, A. and Briel, U.G. 2004, ApJ, submitted
- (14) Jansen, F., Lumb D., Altieri, B., et al. 2001, A&A, 365, L1
- (15) Joffre, M., Fischer, P., Frieman, J., et al. 2000, ApJ, 534, L131
- (16) Knopp, G.P., Henry, J.P. and Briel, U.G. 1996, ApJ, 472, 125
- (17) Lumb, D.H., Warwick, R.S., Page, M., De Luca, A. 2002, A&A, 389, L93
- (18) Lumb, D.H., Finoguenov, A., Saxton, R., et al. 2003, SPIE, 4851, 255
- (19) Markevitch, M., Forman, W.R., Sarazin, C.L. and Vikhlinin, A. 1998, ApJ, 503, 77
- (20) Markevitch, M., Vikhlinin, A., & Forman, W.R. 2003, Matter and Energy in Clusters of Galaxies, S. Bower & C-Y. Hwang, eds., ASP Conf. Series, 301, 37
- (21) Mazzotta, P., Fusco-Femiano, R. and Vikhlinin, A. 2002, ApJ, 569, L31
- (22) Ponman, T.J., Sanderson, A.J.R., Finoguenov, A. 2003, MNRAS, 343, 331
- (23) Read, A.M. and Ponman, T.J. 2003, A&A, 409, 395
- (24) Ricker, P.M. and Sarazin, C.L. 2001, ApJ, 561, 621
- (25) Strüder L., Briel U.G., Dennerl K., et al. 2001, A&A, 365, L18
- (26) Turner M.J.L., Abbey A., Arnaud M., et al. 2001, A&A, 365, L27
- (27) Vikhlinin, A., McNamara, B.R., Forman, W., et al. 1998, ApJ, 502, 558
- (28) Vikhlinin, A., Markevitch, M. and Murray, S.S. 2001a, ApJ, 551, 160
- (29) Vikhlinin, A., Markevitch, M. and Murray, S.S. 2001b, ApJ, 549, L47
- (30) Zhang, Y.-Y., Finoguenov, A., Böhringer, H., et al. 2004, A&A, 413, 49