Near-IR speckle imaging of massive young stellar objects
We present near-IR speckle images of 21 massive Young Stellar Objects (YSOs) associated with outflows. The aim of this study is to search for sub-arcsecond reflection nebulae associated with the outflow cavity. We find that 6 of the massive YSOs show a conical nebula which can be interpreted in terms of reflected light from the dusty walls of the outflow cavity. In all cases, the small scale structures seen in our images are compared with outflow indicators found in the literature. No clear correlation is found between the presence of the reflection nebulosity and any property such as degree of embeddedness. We also note that 3 of the sources show close companions, one of them belonging also to the sample with conical nebula.
Key Words.:
massive star formation – outflows – speckle imaging1 Introduction
Outflow is invariably associated with star formation and is likely to play a key role in the process. It can take the form of highly collimated jets that may help solve the angular momentum problem (Bacciotti et al. 2002). A wide-angle wind could also be present (Lee et al. 2001) and these phenomena then drive the bipolar molecular outflows in the ambient cloud. Magnetohydrodynamic mechanisms have been proposed to explain the driving and collimation of these outflows (e.g. Galli & Shu 1993; Tomisaka 2002). This picture has mostly been developed for low-mass star formation.
There are good reasons for supposing that this may not apply to the formation of the more massive OB stars. Although bipolar molecular flows are just as common, there are very few cases where highly collimated jets are seen. On the contrary, high resolution radio imaging has revealed a few cases where ionised winds are equatorial in nature, i.e. perpendicular to the bipolar molecular outflow (Hoare et al. 1994; Hoare & Muxlow 1996; Hoare 2002).
From a theoretical point of view, we may also expect that radiation pressure from these luminous, hot stars may play a larger role than magnetic pressure. Indeed, radiation pressure can naturally account for an equatorial wind being driven off the surface of an accretion disc (Proga et al. 1998). Hydrodynamic collimation could provide an alternative to magnetic models for the larger scale bipolar molecular flows (e.g. Yorke & Welz 1996; Mellema & Frank 1997).
One approach to achieve a better insight into these mechanisms is to study the circumstellar matter distribution at the scales where the outflow is likely to be driven and collimated. In particular, the morphology of the cavity opened by the outflow at scales of a few 100 AU may yield hints about the outflow driving mechanism. For instance, a wider cavity would be expected if the outflow is rather equatorial at the base, while an initially jet-like outflow would produce a narrower cavity.
A better knowledge of the circumstellar density distribution morphology can be inferred from the near-IR observations of the sub-arcsecond reflection nebula produced by light from the young star that is scattered off the dust in the cavity walls. These nebulae have already been observed in a few massive YSOs (Mon R2, Koresko et al. 1993; Preibisch et al. 2002; S140 IRS1, Hoare et al. 1996; Schertl et al. 2000). However, no study has covered a large sample of sources. Observations of the sub-arcsecond morphology over a large sample allows the questions of how frequent reflection nebulae and close companions are amongst the massive YSOs to be addressed. The observed reflection nebulae can be compared with predictions from radiative transfer models of the scattered light to constrain some of the properties of the circumstellar density distribution, e.g. optical depth, cavity shape and inclination angle (Whitney & Hartmann 1992; Fischer & Henning 1995; Lucas & Roche 1998; Wolf 2003; Whitney et al. 2003; Alvarez et al. 2004). They can also be compared to observations of the ionised wind morphology from radio continuum observations at similarly high resolution.
Here, we present near-IR multi-wavelength speckle observations of the sub-arcsecond morphology on a sample of 21 massive YSOs. The targets are known to be associated with large scale bipolar outflows from molecular line and shocked molecular hydrogen studies. They are nearby and bright enough for the speckle method to be used. Some preliminary results of this work were shown in Hoare et al. (1996). In section 2 the observations and data reduction are described. The results for individual sources are presented in Section 3. In Section 4 the statistical properties of the sample (frequency of reflection nebulae, frequency of binaries) are discussed. Finally, some concluding remarks are presented in Section 5.
2 Observations
2.1 UKIRT Observations
These observations (see Table 1) were performed on December 16, and 17, 1997 with IRCAM3 at UKIRT. The InSb array was used with the magnifier giving a pixel scale of 0057 . Due to the fast readout required, for most of the sources, only the central pixels where used, covering a field of view of . The seeing conditions in the near-IR varied between and during the run. A minimum exposure time of 0.02 sec was used for the brighter objects, and up to 0.25 sec was used for the fainter ones, which is not short enough to completely freeze the seeing, but still gives some high resolution information. Observations of the target were alternated, normally every 500 speckle snapshots, with similar 500 snapshots of a nearby reference star (within of the science object) and nearby sky. More than one reference star was used where possible to allow for the possibility of undiscovered multiplicity in them. The log of the observations is shown in Table 2.
|
-
a
Equinox J2000.
-
b
References for the luminosity.
-
c
References for the distance.
-
d
Magnitudes extracted from the literature.
-
Key to the references:
1. Beckwith et al. (1976); 2. Thronson et al. (1980a) ; 3. Mozurkewich et al. (1986) ; 4. Crampton & Fisher (1974) ; 5. Cohen & Kuhi (1977) ; 6. Herbig (1971) ; 7. Harvey et al. (1979b) ; 8. Blitz & Thaddeus (1980) ; 9. Evans & Blair (1981) ; 10. Evans et al. (1981) ; 11. Nordh et al. (1984) ; 12. Campbell & Thompson (1984) ; 13. Blitz et al. (1982) ; 14. Park et al. (2000) ; 15. Snell et al. (1988) ; 16. Becker & Fenkart (1971) ; 17. Thronson et al. (1980b) ; 18. Wynn-Williams et al. (1981) ; 19. Harvey et al. (1979a) ; 20. Anthony-Twarog (1982) ; 21. Jiang et al. (1984) ; 22. Howard et al. (1994) ; 23. Wu et al. (1996) ; 24. Itoh et al. (2001) ; 25. Howard et al. (1997) ; 26. Castelaz et al. (1985) ; 27. Harvey et al. (1977) ; 28. Staude et al. (1982) ; 29. Harvey et al. (1982) ; 30. Wynn-Williams (1982)
|
-
a
U: UKIRT. C: 3.5 m telescope at Calar Alto.
-
b
Average peak counts per frame.
-
c
These stars were found to be close binaries and so not included in the reduction.
-
d
Object was too bright at K and so a narrow-band filter at 2.26m was used instead.
-
e
Main features observed in the reconstructed images. N: Bright nebula likely to be associated to the outflow cavity. N!: Very low level or hardly resolved nebulosity. C: Close companion (with a separation 15). U: Unresolved source. –: Reconstruction not possible due to the low number of photons per individual frame.
The images were carefully cleaned of bad pixels, since they can contaminate the visibility function with bright peaks at specific spatial frequencies. An average sky image (produced by averaging all sky frames corresponding to one target) was subtracted from every snapshot of the object and reference star. Cleaned and sky subtracted images were Fourier transformed and used to calculate the power spectrum and the bispectrum (e.g. Hofmann & Weigelt 1986). The visibilities for each target were calculated using the corresponding reference star listed in Table 2. The phases were recovered with a least-squares method using 80 bispectral planes in the images and 28 bispectral planes in the images (Glindemann et al. 1991). The visibilities were filtered using a low-pass Gaussian window to reduce the noise level at high spatial frequencies. Real images are obtained from the inverse Fourier Transform of the modulated visibility and the phase. The modulation of the visibility results in the resolution of the final images being lower than the full diffraction limit of the telescope, but greatly improves the detection level of faint extended nebulosity. Generally, the reconstructed image shows artifacts, which can be the result of the loss of part of the speckle cloud off the edge of the detector, or due to a poor phase recovery. They usually appear concentrated close to a strong peak, and are at the level of a few percent of the brightest peak. Tests on reference stars were used to check for the level of these artifacts, as well as for binarity amongst the reference stars themselves.
2.2 Calar Alto Observations
The observations were made at the 3.5m telescope on Calar Alto, on December 9, 10 and 11, 1994. The MAGIC 256256 NICMOS 3 camera was used at a pixel scale of 0073 per pixel in order to sample the diffraction limit at K. For simple point sources 1500 128256 frames with an integration time short enough to freeze the seeing were accumulated on the object interspersed with a similar number on one or more reference stars less than 1∘ away. The seeing was approximately 1 arcsec. Only half of the array was saved in order to save disk space and speed up the readout. The source was alternately placed in lower and upper quadrants, the blank one being used for sky subtraction. Where multiple sources or complex structure extended across the field of view the whole array was saved and separate sky frames where obtained. The reduction procedure is similar to the one used for the UKIRT images.
A typical value for the limiting surface brightness in our observations can be obtained from the seeing-limited magnitudes listed in Table 1 and the typical values for the resolution and noise level in the restored images (see figures 1 to 15). As an illustration, we take the instance of GL 490 in the H band from our Calar Alto campaign, since the reconstructed image (see Fig. 8) is dominated by a strong point source with only a faint nebulosity and no other sources present in the field of view. With a seeing-limited magnitude of 7.6 and a restored resolution of 023, only 8% of the flux is in the central pixel. A 1 noise level of 2.5% of the brightness peak is found within 1′′ of the peak, whilst 1% noise is found further out. These yield 3 limiting surface brightnesses of 7.4 mag/arcsec2 and 10.1 mag/arcsec2 respectively. These estimates are similar for the rest of the sources for which we could reconstruct a high resolution image. Therefore, the limiting surface brightness (in units of mag/arcsec2) in the region of interest (i.e. within 1′′ of the central peak) is of the same order as the total seeing magnitude (in units of mag). This is less valid for sources with a strong nebulosity or for fields with multiple sources. The noise level is determined by the dynamic range ( 100) of the speckle technique used here.
3 Results
In this section we present the results on individual objects before discussing the sample as a whole in the next section.
3.1 Mon R2 IRS3
Mon R2 IRS3 is the brightest of a cluster of compact IR sources with associated extended emission located at a distance of 950 pc. IRS3 is located approximately to the east of a blister type Hii region of diameter (Massi et al. 1985). The cluster is located near the centre of a giant CO outflow (Bally & Lada 1983; Wolf et al. 1990) oriented at a PA with the approaching gas flowing to the NW. Due to the low resolution of the CO observations, it is not clear which of the IR sources is powering this outflow. On scales of a few arcseconds, the IR reflection nebula is extended to the south and to the east. The polarisation pattern shows centro-symmetry indicating that IRS3 is the illuminating source. It also shows a polarisation disc elongated in the SE-NW direction (Yao et al. 1997).
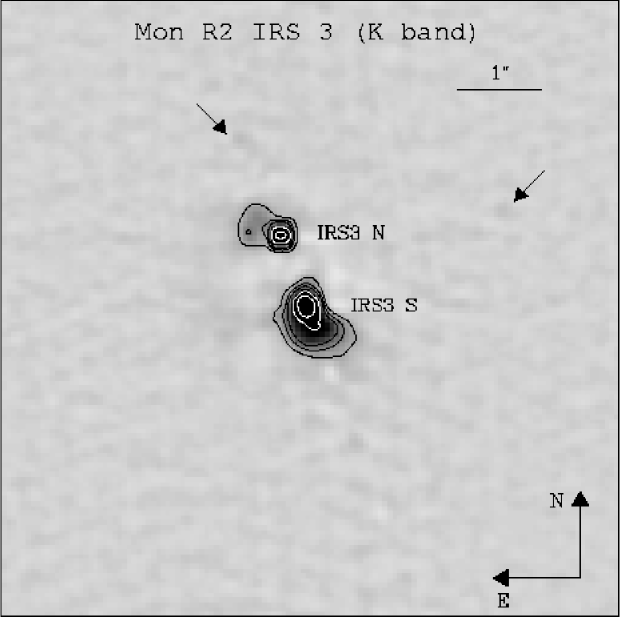
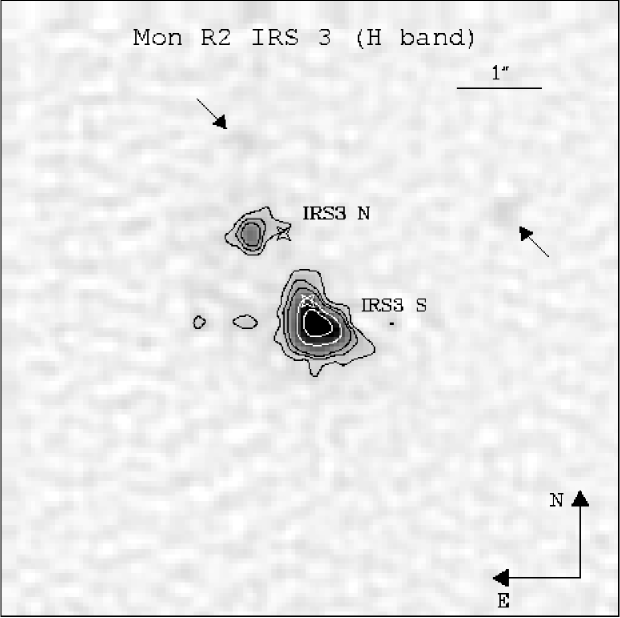
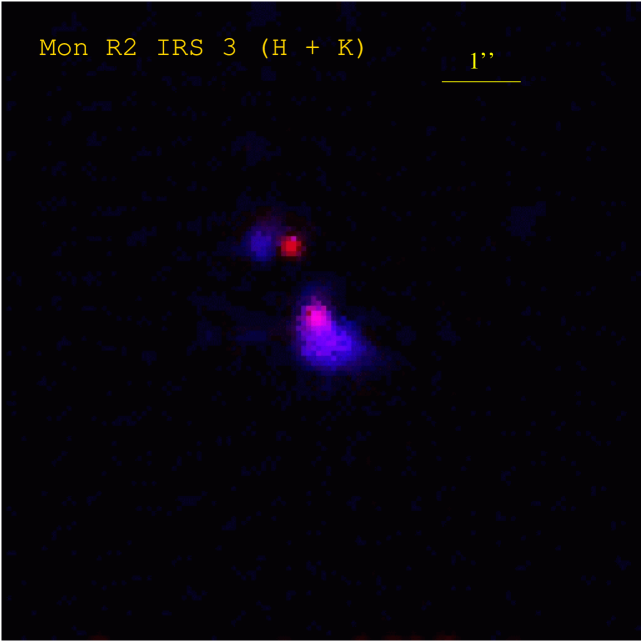
This object has been investigated with speckle imaging before by Koresko et al. (1993) at 2.2, 3.8 and and more recently in deep images at H and K by Preibisch et al. (2002) using the 6 m SAO telescope. We present our K and H-band speckle images in figures 1 and 2 for comparison with the rest of our survey. In the K-band two stars are clearly present, IRS3 S and IRS3 N, that are separated by , in good agreement with the works of McCarthy (1982), Koresko et al. (1993) and Preibisch et al. (2002). IRS3 N is actually composed of two stars (sources B and C in Preibisch et al. 2002). These two stars are also seen by Koresko et al. in the K band. However, they are only marginally resolved in our K band data. The conical reflection nebula emanating to the S-SE of IRS3 S found by Koresko et al. (1993) is clearly visible in both the H and K bands. At H, the brightest of the two stars in IRS3 N (source B in the work by Preibisch et al.) disappears completely, whilst the star illuminating the southern nebula is faint, if present at all, at the northern tip of the conical nebula. These monopolar nebulae are interpreted as light scattered off the walls of an outflow cavity that is directed somewhat towards us. The other lobe that would be associated with the redshifted outflow is not visible due to high extinction in an inferred flattened envelope perpendicular to the bipolar outflow direction. Figure 3, represents a colour-coded image, which stress the presence of the highly reddened stars and the relatively blue conical nebula associated with IRS3 S. The scattering efficiency of dust increases rapidly with decreasing wavelength through the near-IR, causing the reflection nebula to be relatively blue.
The morphology of the southern nebula indicates that in this case the outflow is at a position angle (PA) of with the approaching gas towards the south-west. Preibisch et al. (2002) show that the emission to the E of IRS3 N is the combination of another star and a jet-like feature emerging from IRS3 N at a PA . Neither of these outflow orientations correlate with the large scale molecular outflow described by Wolf et al. (1990) (PA with the blue gas moving towards the north-west). Therefore, the IRS3 sources are not likely to be driving the large scale bipolar molecular outflow in the region and we need to look for other outflow indicators nearer to IRS3 itself. One should keep in mind though, that single-dish CO observations have a very low spatial resolution (several arcseconds) compared with our speckle images. The giant molecular outflow in the Mon R2 region maybe a superposition of several smaller outflows with slightly different orientations, each one driven by a different source. Therefore, any attempt to relate the near-IR sub-arcsecond morphology with large scale structures should be taken with caution, even though this is an interesting exercise to search for possible correlations in orientation.
It is also interesting to compare the orientation of the cavity with the distribution of methanol masers presented by Minier et al. (2000). They show a group of masers forming a linear structure with an approximate length of 017 at PA = . They interpret this structure in terms of a nearly edge-on circumstellar disc. This would imply a system with a rotation axis in the NW-SE direction, which is in complete disagreement with what the near-IR sub-arcsecond nebula suggests. Alternatively, the situation maybe similar to other sources (e.g. W75N Torrelles et al. 1997) where the linear maser morphology appears to trace the outflow axis.
Finally, the orientation of the polarisation structure shown by Yao et al. (1997) is considered. Their seeing-limited images indicate the presence of a polarisation disc at PA , which is roughly perpendicular to the maser structure. It is likely that IRS3 S, which appears to be the strongest source of scattered light in our UKIRT speckle images, is the main contributor to the polarisation disc. However, high resolution polarimetry in the near-IR is necessary to resolve the polarisation structure of each of the components independently.
3.2 S140 IRS1
S140 IRS1 is located near the centre of a bipolar molecular outflow at a PA with the blue-shifted lobe pointing towards the SW (Blair et al. 1978; Bally & Lada 1983; Hayashi et al. 1987; Minchin et al. 1993). Minchin et al. (1995) find that the emission at the ambient cloud velocity traces the cavity wall associated with the blue-shifted CO outflow lobe.
Seeing-limited imaging polarimetry in the optical and in the IR show that S140 IRS1 is the brightest member of a cluster of embedded sources surrounded by an extended reflection nebula (Forrest & Shure 1986; Lenzen 1987; Evans et al. 1989; Harker et al. 1997; Yao et al. 1998). The polarisation structure of the nebula indicates that IRS1 and IRS3 are the main illuminating sources of the nebula, but the polarisation structure is complex.
Radio continuum observations reveal a thermal source with a spectral index of indicative of an ionised wind. Observations that resolve the source show that the radio emission is elongated perpendicular to the large scale outflow direction (Schwartz 1989; Tofani et al. 1995). The higher resolution observations by Hoare & Muxlow (1996) show a structure at a PA of . Multi-epoch observations show that this structure is not a radio jet as first proposed by Schwartz (1989), but an equatorial wind (Hoare 2002), as was also found for S106 IR (Hoare et al. 1994) and possibly GL 490 (Campbell et al. 1986).
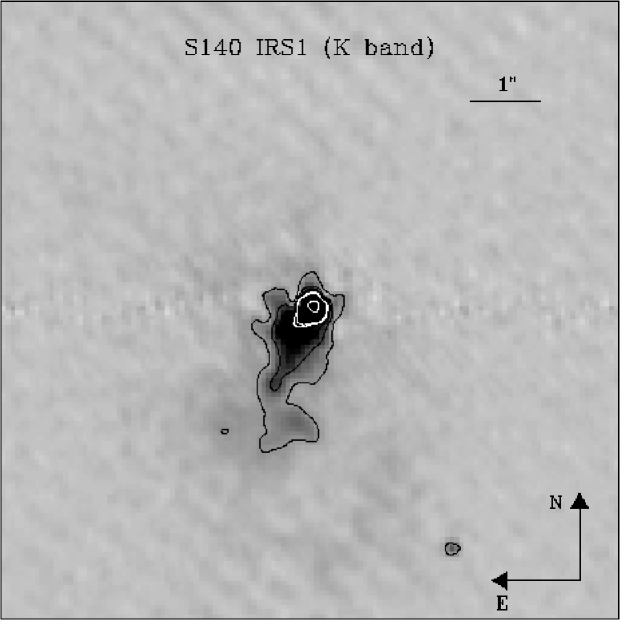
Our K-band speckle image of S140 IRS1 is shown in figure 4 (see also Hoare et al. 1996). This image shows a monopolar nebula that emerges from IRS1 and extends towards the SE at a PA . The azimuthally averaged visibility function indicates that % of the flux arises from the point source, which is likely to be the central proto-star (see Schertl et al. 2000). The morphology in figure 4 agrees with deeper speckle imaging by Schertl et al. (2000). Their polarisation data also show the centro-symmetric pattern that confirms that this is a reflection nebula illuminated by S140 IRS1. This is consistent with the light being reflected off the walls of the blue-shifted outflow cavity in a classic monopolar reflection nebula. All this fits in with the interpretation of the radio structure as an equatorial wind.
The only question mark over this picture is the discovery by Weigelt et al. (2002) of a set of three bow shock-like structures to the NE of S140 IRS1 in wide-field K-band speckle images. They interpret these as arising from precessing, episodic jet activity from S140 IRS1. This would require a return to the jet interpretation for the radio emission, which is inconsistent with the direction of the main outflow indicators, i.e. the CO outflow and reflection nebula. One solution to this conflict would be if the bow shock structures were driven by a jet from a lower-mass YSO located near to S140 IRS1.
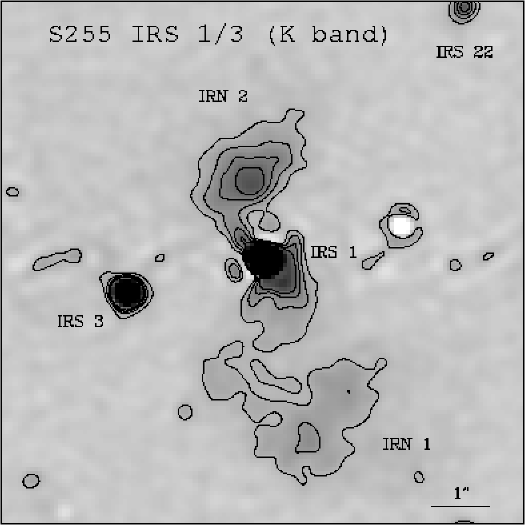
3.3 S255 IRS1 and IRS3
S255 IRS1 and IRS3 form part of a cluster of IR sources located between the evolved Hii regions S255 and S257 at a distance of 2.5 kpc. A molecular outflow along the N-S direction with its approaching lobe towards the south appears to be centred near the IR cluster (Heyer et al. 1989). Infrared polarisation images by Tamura et al. (1991) show a bipolar nebula (IRN1) at PA of illuminated by IRS3, which indicates the presence of an outflow in the this direction. They also find another reflection nebula (IRN2) to the north of IRS1 that is illuminated by that source. Thermal IR observations by Itoh et al. (2001) show that IRS3 is the more luminous and embedded object. Miralles et al. (1997) find molecular hydrogen emission from HH-like objects along the jet direction.
The K-band reconstructed image of this region is shown in figure 5. The field of view contains the point sources IRS1, IRS3, IRS22 and the two reflection nebulosities IRN1 and IRN2 using the nomenclature of Tamura et al. (1991). IRN1 is seen to be very conical in shape with an opening angle of and at PA from its illuminating source IRS3. Although the main orientation of the CO outflow is along the N-S direction, the CO observations of Heyer et al. (1989) show some evidence for high velocity blue-shifted gas towards the SW roughly along the outflow axis indicated by IRN1 in figure 5.
IRN2, which Tamura et al. deduced was present from the polarisation pattern, is clearly resolved in our observations. There is a gap between the main IRN2 nebula and IRS1 and its morphology is not entirely consistent with IRS1 being its illuminating source. The presence of foreground clumps or intra-cluster matter could be a possible explanation for this gap. Significant artifacts exist on the RA axis through IRS1 so that the reality of features close to IRS1 are questionable. Some spatially distinct diffuse emission is seen on the opposite side of IRS1, which maybe the other reflection lobe. If these nebulosities were associated with the main N-S outflow, we would expect the southern blueshifted lobe to be brighter.
3.4 GL 437-S
GL 437 is a compact cluster of IR sources (Wynn-Williams et al. 1981) located a distance of 2.7 kpc. The cluster, with a total luminosity of , comprises four bright sources denominated GL 437-N, S, E and W. The cluster is located at the centre of a poorly collimated molecular outflow (Gomez et al. 1992). Weintraub & Kastner (1996) find that the cluster is embedded in an infrared polarised nebula. The polarisation pattern is mainly centro-symmetric with respect to the embedded source WK 34, which is close to GL 437-N. However, centro-symmetry can also be observed about GL 437-S (Weintraub et al. 1996).
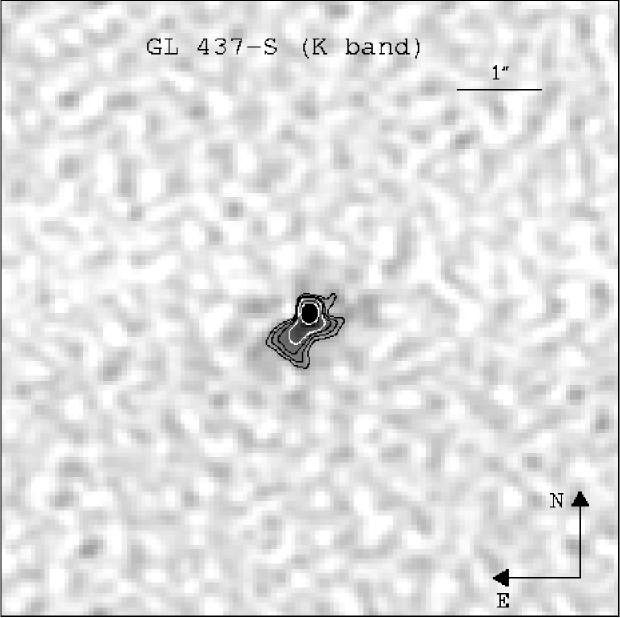
Figure 6 shows the reconstructed image of GL 437-S at a resolution of 022. The data indicate the presence of a sub-arcsecond monopolar nebula extended towards the SE at a PA = . The noise level is high in this image since GL 437-S is quite faint, but the extended emission is bright relative to the star. However, the presence of the nebulosity is consistent with the centro-symmetry in the near-IR polarisation seen by (Weintraub et al. 1996). The high-velocity CO emission shows several peaks (see figure 3 of Gomez et al. 1992). Although the main outflow axis appears to be in the N-S direction, the presence of multiple outflows in the region cannot be discarded. In particular, there is some blue-shifted emission towards the SE, and red-shifted gas to the NW, that may trace a bipolar outflow oriented roughly along the same direction as the sub-arcsecond nebula shown in figure 6.
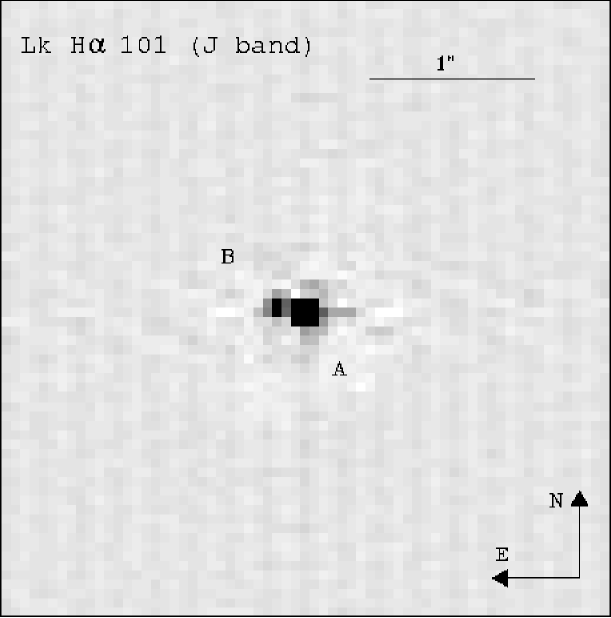
3.5 LkH$α$ 101
LkH$α$ 101 is a Herbig Be star with strong emission (Herbig 1956) which illuminates the reflection nebula NGC 1579 (Redman et al. 1986). It is the brightest of a cluster of IR sources (Barsony et al. 1991) at a distance of 800 pc. Its spectral type corresponds to a late O or early B star (Brown et al. 1976; Harvey et al. 1979b). It excites a weak Hii region of size (Becker & White 1988). LkH$α$ 101 is also the source of a compact ionised wind. The radio continuum emission from the wind has been studied at a wide range of frequencies (Brown et al. 1976; Bieging et al. 1984; Becker & White 1988) showing a law. Hoare & Garrington (1995) resolve the wind into a clumpy and approximately circular distribution on the sky.
Bally & Lada (1983) studied the large scale molecular gas motions in the region. They classified LkH$α$ 101 as an intermediate velocity source (with velocities in the 10 - 30 range). However, the existence of a bipolar molecular outflow was not clear from their data, and has been completely discarded by Barsony et al. (1990). This object shares many of the common features of massive young stellar objects, but the fact that it is seen in the optical indicates that it is probably in a fairly advanced evolutionary stage.
The sub-arcsecond structure in the near-IR of LkH$α$ 101 has been studied by several authors using 1D speckle interferometry (Dewarf & Dyck 1993; Leinert et al. 1997, 2001). They classify the source as either unresolved or with a core-halo morphology. However, this object was resolved into two components (the brightest surrounded by a disk) with a separation of 018 and at a PA by Tuthill et al. (2001, 2002) using aperture-mask interferometry with the Keck I telescope at a resolution of .
For completeness, we show in figure 7 our J band speckle data of LkH$α$ 101 taken at UKIRT at a resolution of 011. A separation of between both components was measured directly in the reconstructed image and also by fitting the bispectral phase. The position angle of the fainter component is . Aperture photometry on the reconstructed image as well as fitting the bispectrum yielded a brightness of the fainter component with respect to the total of . The binary system can also be seen in the H band data taken during the Calar Alto campaign. A separation of and a relative brightness of with respect to the total. These values are consistent with those measured by Tuthill et al. at higher resolution.
3.6 GL 490
This massive YSO is associated with a parsec scale molecular outflow that was first detected by Lada & Harvey (1981). More detailed structure of the outflow is given by Snell et al. (1984), Mitchell et al. (1992, 1995). All observations agree in that the outflow axis lies in the NE-SW direction (PA ) with the blue-shifted lobe towards the south-west. The CO outflow is not highly collimated, with a considerable overlap of the blue-shifted and red-shifted gas.
An stellar-like optical counterpart is located at the apex of a conical reflection nebula in the blueshifted outflow lobe (Campbell et al. 1986). The light centre of the optical source was found to shift to the SW at bluer wavelengths consistent with a scattered rather than direct source for the optical light (Campbell et al. 1986). Near-IR imaging polarimetry of the region performed by Minchin et al. (1991) shows a cometary reflection nebula extending for about towards the south-west, with its head at the location of GL 490. This nebula shows a wider opening angle than its optical counterpart, and it is characterised by a centro-symmetric polarisation pattern with a polarisation disc at a PA of .
An ionised stellar wind is seen in the radio with a spectral index of (Simon et al. 1983; Campbell et al. 1986; Henning et al. 1990). The radio source appears extended in a direction perpendicular to the outflow at (Campbell et al. 1986). At the position of the star, Kawabe et al. (1984) found CS emission elongated in a direction roughly perpendicular to the outflow axis that can be interpreted as produced in a dense disc or torus of material around the IR source. Schreyer et al. (2002) also find an elongated structure at a PA -45∘ in the CS (J=2-1) transition. Further evidence of the disc is obtained from the 2.7 mm continuum emission detected by Mundy & Adelman (1988), which is also elongated perpendicular to the outflow.
The sub-arcsecond structure of GL 490 in the near-IR was first studied by Haas et al. (1992). Their 1D speckle interferometry in the H, K and L bands shows that the source is formed by an unresolved core of and an extended halo of 12. The halo appears relatively bluer, slightly elongated towards SW (PA ), and shows a centro-symmetric polarisation pattern, which indicates a scattered origin for the emission. The same core-halo structure is found by Dewarf & Dyck (1993) at .
Our K-band speckle imaging does not resolve any sub-arcsecond structure. However, extended emission is seen in our H band reconstructed image taken at Calar Alto (see figure 8). This blue colour of the nebula strongly indicates that it is scattered light. The H-band nebulosity is mainly perpendicular to the outflow (PA ), but appears to curve off towards the blueshifted SW lobe at the ends. Such a morphology is consistent with arising at the base of the wide opening angle blueshifted outflow cavity. This structure is very similar in size and orientation to the extended radio emission seen by Campbell et al. (1986).
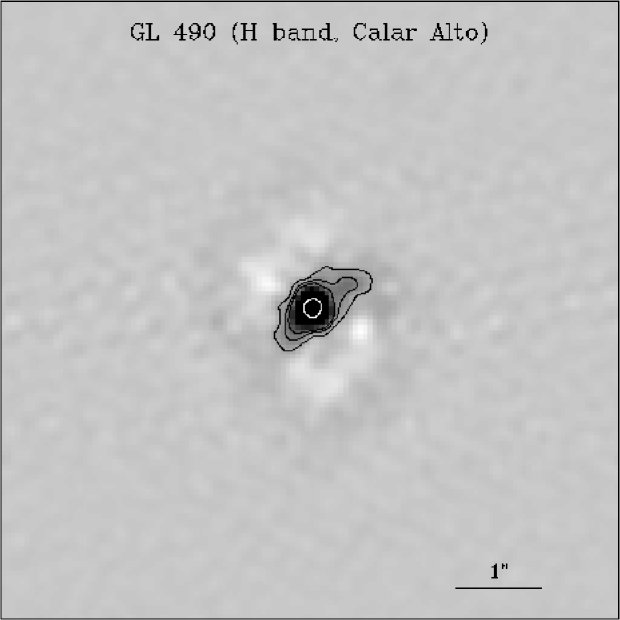
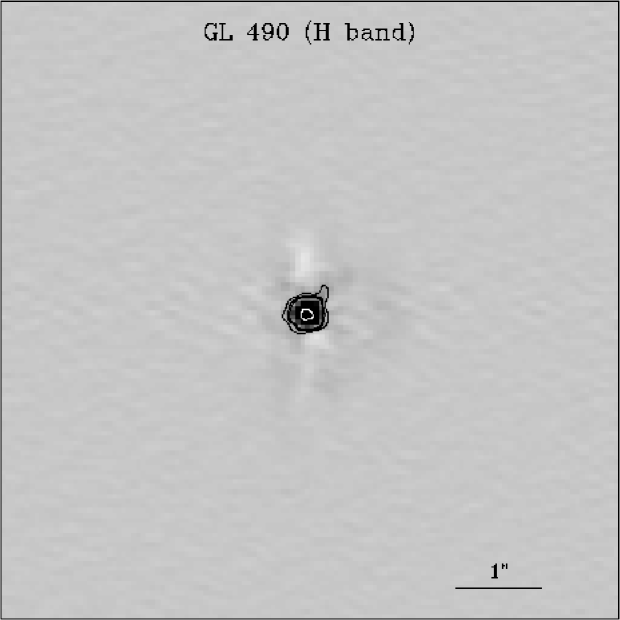
For the speckle data taken at Calar Alto (see Table 2), it turned out that one of the reference stars used (SAO 23999) was actually a binary and so could not be used in the reconstruction. This resulted in somewhat higher than normal artifacts and partly for this reason the speckle observations of GL 490 were repeated at UKIRT. Figure 9 shows the H band image reconstructed at a resolution of 018 from this dataset. The elongated morphology seen in the image taken at Calar Alto appears to have vanished in the new UKIRT image. Tests done with cross-calibrated PSF stars favour the reality of the disappearance of the nebula in GL 490.
Interestingly, the extended radio emission observed by Campbell et al. (1986) has also not been detected in more recent deep 8 GHz VLA observations by Hoare & Gibb (in prep.). Hence, it is possible that these changes in the morphology of near-IR and radio observations maybe caused by real variability in the source. One possible explanation could be obscuration near the star (above the disc) preventing the sides of the cavity being illuminated with near-IR light, thereby reducing the reflection nebula and EUV radiation, thereby stopping photoionisation and hence the radio emission as well. Further multi-epoch observations at different wavelengths are needed to probe this possible variability.
Any reflection nebulosity should be brighter relative to the star at J compared to H. Unfortunately, GL 490 is too faint at J for the reconstructed image taken at UKIRT to confirm the reality of the nebulosity. Conversely, the source is so bright at K that speckle imaging could be performed through a filter. However, no extended emission due to ionised gas was found here either.
3.7 GL 961 E, W and Fan
GL 961 is a luminous (Castelaz et al. 1985) young stellar object that is located in the south-west rim of the Rosette nebula at a distance of 1.6 kpc. This source is very faint in the optical (Eiroa 1981; Beetz et al. 1976), and lies approximately E of an optical fan-shaped nebula (GL 961-Fan). Lenzen et al. (1984) found that GL 961 is actually composed of two close IR objects, separated by about (8000 AU) at a PA . Castelaz et al. (1985) show that the spectral energy distribution of GL 961-E dominates at wavelengths longer than , while the western object is brighter at shorter wavelengths.
The double source is located at the centre of a parsec scale molecular outflow oriented in the N-S direction with the approaching lobe towards the north (Lada & Gautier 1982). Observations of the emission in the region performed by Aspin (1998) show multiple bow-shocks emerging from the double system. One system is oriented at PA and the other one at PA , which corresponds with the orientation of the CO outflow.
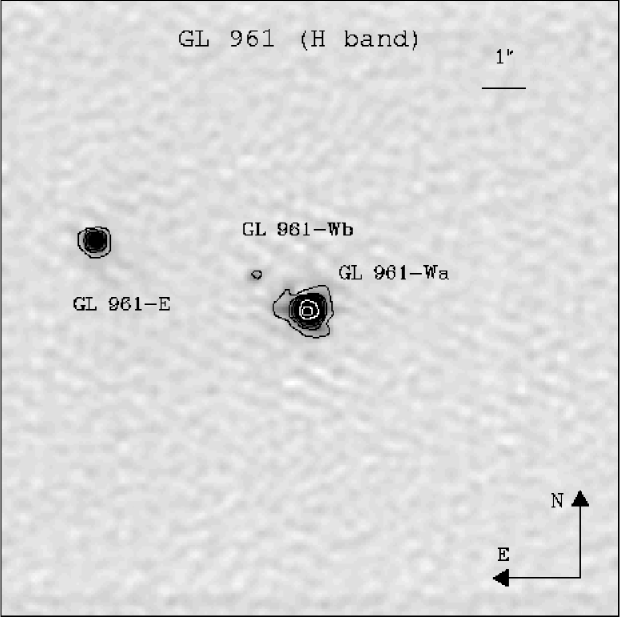
Figure 10 shows the speckle reconstructed image of the double system formed by GL 961-E and GL 961-W. In this case, the field of view is since the full pixel area of IRCAM3 was used. Both sources can be clearly identified at a separation of and a PA = . A very faint third source (GL 961-Wb) can also be seen at a separation of and a PA = from GL 961-W (renamed GL 961-Wa here). GL 961-Wa contributes a to the total flux, while the contribution of GL 961-Wb is . We use the magnitudes given in Castelaz et al. (1985) to estimate a total magnitude in the H band of 8.650.01 for the system GL 961-E, -Wa and -Wb. This yields a H magnitude of 10.80.1 for GL 961-Wa and 13.60.1 for GL 961-Wb.
Some extended emission at the 1% level can be seen around GL 961-Wa. The shape of the extended emission is fairly uncertain since it is very close to the noise level. In summary, there appears not to be any clear feature in this source that can be related to any of the outflow activity indicators seen at a larger scale.
High resolution observations of GL 961-Fan were also performed at K, since it may constitute an independent site of star formation. However, no sub-arcsecond extended emission was found at a level of the brightness peak.
3.8 S235 IRS1, 2 and 4
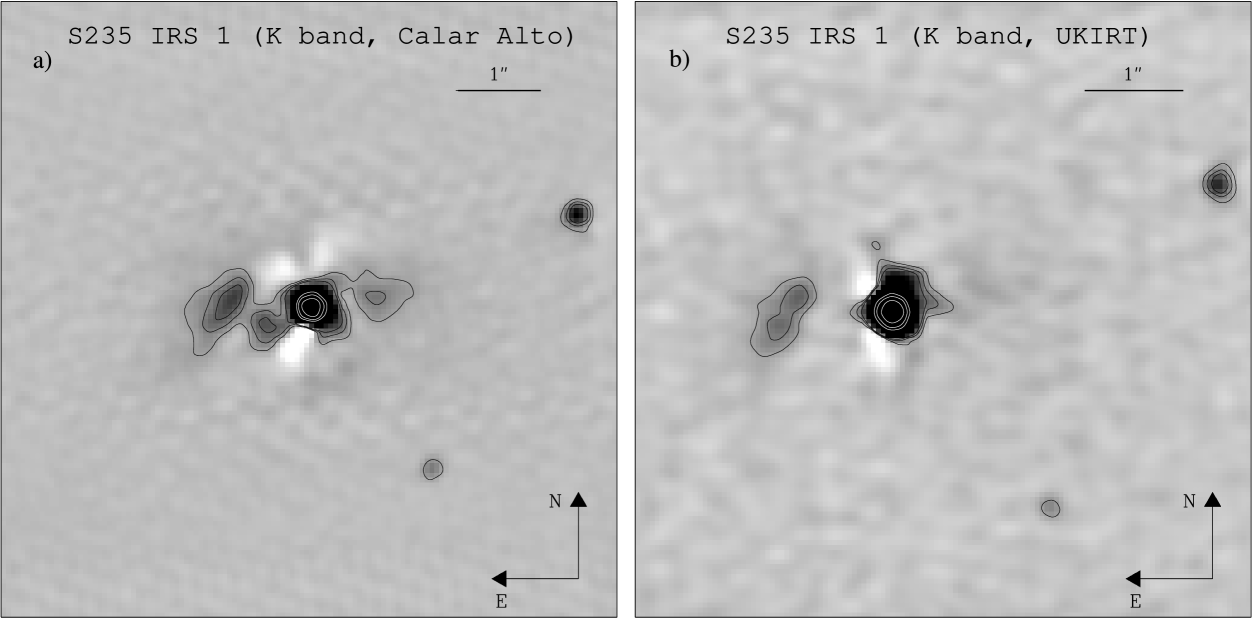
These luminous YSOs (Allen 1972) are located in the S235 molecular cloud at a distance of 1.8 kpc. S235 IRS1 was observed in speckle mode during 1994 at the Calar Alto observatory in the K band, and in 1997 at UKIRT in the H and K band. The K band speckle reconstructed images from these two observations at a resolution of 027 are shown in figures 11a and 11b. In both K images, S235 IRS1 can be seen near the centre, and two other stars are detected to the west of IRS1. One of them is located to the NW of S235 IRS1, and the other to the SW. The brighter of these stars contributes a to the total flux, while the contribution of the fainter is . Assuming a total magnitude of 10.250.07 ( aperture, c.f. Evans & Blair 1981), the magnitudes of the bright and faint stars are 12.290.08 and 13.70.2 respectively.
Some extended emission elongated in the E-W direction is clearly seen in S235 IRS1. The extended emission that is detected at towards the east of the central peak, is certainly real. The contribution to the total flux of this feature, measured on the UKIRT image, is . However, the features closer in are more questionable since there are negative artifacts at a similar level. Intrinsic time variability of the nebulosity cannot be discarded, since the extended emission detected to the west of IRS1 at Calar Alto (see figure 11a) seems to have vanished in the 1997 data.
The reconstruction of the H band data yielded a low SNR image due to the low level of counts on the reference star. Nevertheless, inspection of the seeing-limited image indicates that the nebulosity to the east of IRS1 is relatively bluer than the brightness peak, which indicates the scattered nature of the extension. Hence, we appear to have a monopolar or possibly bipolar reflection nebula emanating from S235 IRS1 in an E-W direction with the blueshifted lobe on the east. Unfortunately, there are as yet not molecular line maps with which to look for the outflow. Near-IR standard imaging in molecular hydrogen by M. McCaughrean (private communication) shows some elongated diffuse emission in the E-W direction extended for , which supports the picture of matter outflowing in this direction.
S235 IRS4 it is associated with the optical nebulosity S235B (Krassner et al. 1982). The source lies south of the classical Hii region S235A. Centred on the region, there is also a large scale bipolar outflow oriented in the NE-SW direction with the approaching gas towards the NE (Bally & Lada 1983; Nakano & Yoshida 1986). S235 IRS4 was observed in the H band at UKIRT. The data show no evidence of sub-arcsecond extended emission at a level of a 5% of the brightness peak. The source appears also unresolved in the K-band image from Calar Alto. Little is also known of S235 IRS2, which appears unresolved in both images (H and K band) from the campaign at Calar Alto at the 5% level.
3.9 GL 2591
This massive YSO is associated with an optical and near-IR nebula that extends for approximately to the west (Lenzen 1987; Yamashita et al. 1987; Rolph & Scarrott 1991; Tamura et al. 1991; Minchin et al. 1991). The source illuminating the nebula (IRS1), which is inferred from the centro-symmetry in the optical and near-IR polarisation pattern, is completely obscured in the optical. The source is located near the centre of a large scale bipolar outflow oriented in the E-W direction with the blue-shifted lobe pointing to the west (Lada et al. 1984; Mitchell et al. 1992). Yamashita et al. (1987) detect extended CS emission in the N-S direction that can be interpreted as a large scale torus of dense material perpendicular to the outflow.
GL 2591 is associated with a faint radio source elongated in the E-W direction (Campbell 1984a). Tamura & Yamashita (1992) also detect a group of knots aligned in the E-W direction. Most of the emission occurs towards the approaching lobe of the outflow, although there is also some shock-excited gas to the west of IRS1. The line of knots to the E of IRS1 appears to be continued by a group of HH objects aligned roughly along the same direction (Poetzel et al. 1992).
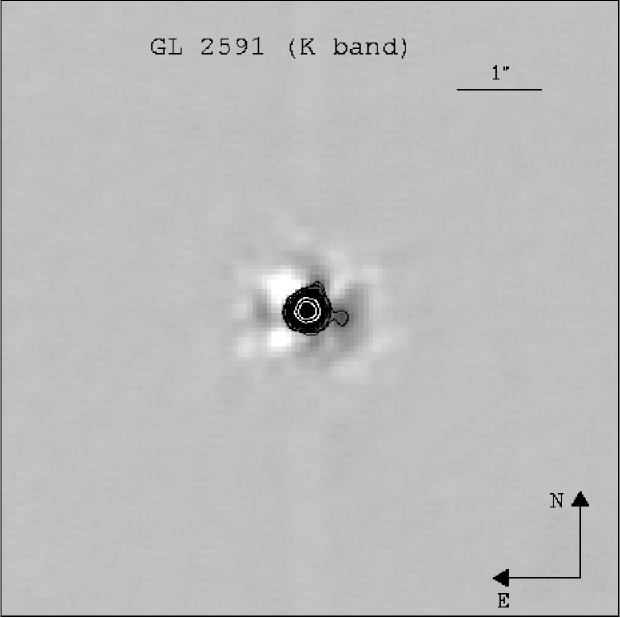
The speckle data of GL 2591 taken at UKIRT show the presence of a faint knot away at PA = with respect to the brightness peak (figure 12). The contribution to the flux of is . This feature could be the base of the larger scale reflection nebulosity to the west associated with the blueshifted outflow lobe.
3.10 GL 4029 IRS1
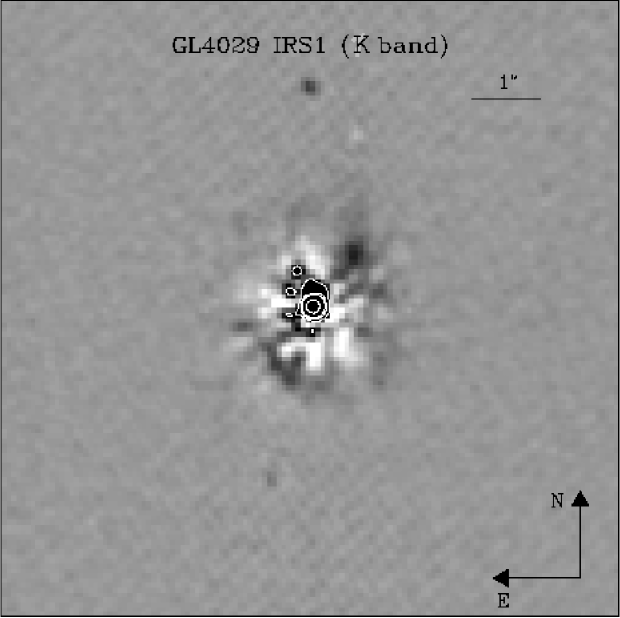
This massive YSO is a member of a cluster of IR sources (Deharveng et al. 1997) located at a distance of 2.2 kpc (Becker & Fenkart 1971). GL 4029 IRS1 is located near the centre of a bipolar molecular outflow (Snell et al. 1988). Both outflow lobes have their peak emission coincident with the IR source. This maybe caused either by a low degree of collimation or by the outflow pointing towards us. GL 4029 IRS1 has an associated reflection nebula in the optical and near-IR (Deharveng et al. 1997). Ray et al. (1990) found several optical emission line knots emanating from GL 4029 IRS1 that indicate the presence of a jet at a PA with a projected extension of . High resolution observations with the VLA (Zapata et al. 2001) resolve the emission at 3.6 cm into two components separated by 06 in the N-S direction with a possible counterpart to the optical jet being detected in the southern component. Sub-arcsecond resolution mid-IR observations also show some extended emission emerging from GL 4029 IRS1 (Zavagno et al. 1999), which appears to be associated with the jet.
Recent HKL′ 1D speckle interferometry by Leinert et al. (2001) show the presence of an extended scattered light halo of diameter . The K-band speckle image taken at Calar Alto (figure 13) shows some signs of such an extended halo, although it is somewhat marred by artifacts from the reconstruction procedure. Similarly, our K-band visibility function could be seen as being consistent with a 20% extended halo contribution, but unfortunately the visibility function of one reference star with respect to the other shows a similar drop at high spatial frequencies and so is not conclusive. However, it is interesting to note that Leinert et al. (2001) deduced the presence of a patch of separate diffuse emission to the NW of the central source from their 1D data and this is exactly where we see the most convincing part of the halo in our K-band image. We also see hints of some extended emission just to the north of GL 4029 IRS1. Neither of these correspond with the jet direction and so their nature is unclear.
Besides IRS1 there are two more stars, one towards the north at a distance of and a PA of and the other towards the south at a distance of and a PA of . Two emission features are seen towards the NE within of IRS1, but their nature is questionable and neither exactly coincides within the positional errors with the northern radio source found by Zapata et al. (2001).
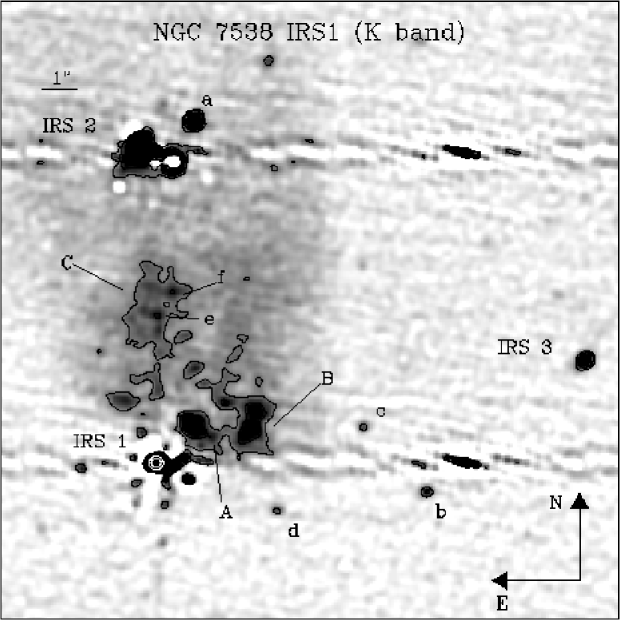
3.11 NGC 7538 IRS1
NGC 7538 IRS1 is the brightest of a cluster of IR sources located in the southern edge of the optical Hii region NGC 7538 (Wynn-Williams et al. 1974; Tamura et al. 1991). The cluster is at the centre of a bipolar molecular outflow at a PA that extends for pc with the blue-shifted lobe towards the NW (Fischer et al. 1985; Scoville et al. 1986; Kameya et al. 1989; Davis et al. 1998).
VLA observations at 5 and of NGC 7538 IRS1 (Campbell 1984b) show that the compact ionised gas emission has a bipolar morphology elongated in the N-S direction (PA ). They interpret this emission as the result of a collimated wind. Gaume et al. (1995) found that the recombination lines were very broad, indicating a wind speed of . Davis et al. (1998) found shock excited emission extending about an arcminute northwards of NGC 7538 IRS1(see also Bloomer et al. 1998). Bow-shaped features are also seen in the vicinity of IRS1, but it is difficult to uniquely identify their powering source.
Scoville et al. (1986) found a dense core of emission towards NGC 7538 IRS1 that is elongated in the E-W direction. The detection of a line of methanol masers that extends for AU at a PA (roughly perpendicular to the outflow direction) may indicate the presence of an edge-on disc in this source (Minier et al. 2001).
The region shows also a large scale near-IR nebulosity ( pc) which has a monopolar shape extending towards the blue-shifted lobe of the large scale molecular outflow with NGC 7538 IRS1 at its apex (Tamura et al. 1991). Its centro-symmetric polarisation pattern indicates that NGC 7538 IRS1 is the illuminating source.
Our K band reconstructed image of NGC 7538 IRS1 has a complex structure (see figure 14). Due to the presence of several bright sources in the field the artifacts are particularly strong here, especially the two parallel horizontal stripes that cross the image at the positions of IRS1 and IRS2. In addition to IRS1, IRS2 and IRS3, other near-IR sources also appear in the field of view of the image. The stars labelled from ’a’ to ’d’ also appear in the seeing-limited image of Bloomer et al. (1998). The stars ’e’ and ’f’ however, are not seen in their image. The extended features ’A’ to ’C’, which are part of the large scale near-IR reflection nebula, appear as regions of enhanced emission in the image presented by Bloomer et al. (1998).
It is notable that the extended emission is mainly concentrated towards the N and NE of IRS1, which is roughly the orientation of the blue-shifted lobe in the CO outflow. Features ’B’ and ’C’ would appear to be the result of scattered light in the walls a limb-brightened cavity at a PA with its apex at IRS1 and with an opening angle of . However, no bright sub-arcsecond nebulosity is seen that would correspond to the base of this large scale cavity.
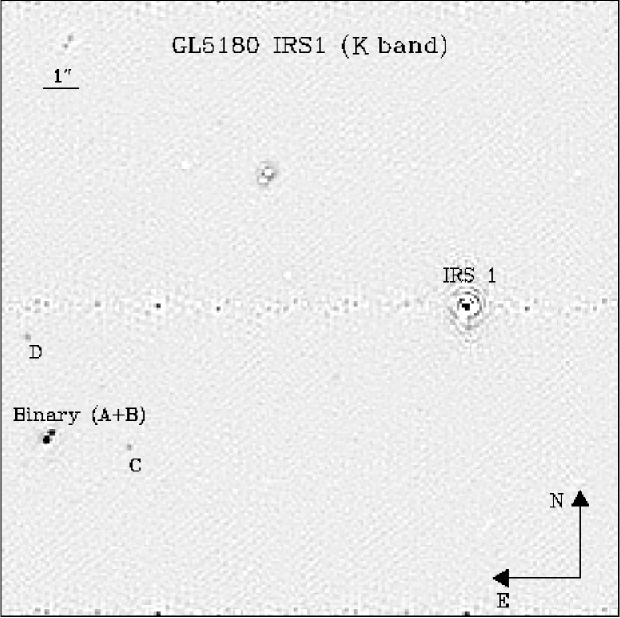
3.12 GL 5180 IRS1
GL 5180 IRS1 is near the centre of a CO outflow oriented at a PA (Snell et al. 1988). K-band imaging polarimetry shows a small cluster within extensive nebulosity (Tamura et al. 1991; Yao et al. 2000). figure 15 shows our reconstructed image of GL 5180 IRS1 in the K band covering a field of view of . We find a new binary at a distance of and with respect to IRS1. The two binary components (A and B in figure 15) are separated by . The component B is at a PA of with respect the component A. Two other IR point sources are seen at and PA of (source C) and at and PA of (source D). None of these sources (except for IRS1) coincides with the IR sources found by Tamura et al. (1991). No extended emission is detected.
3.13 GL 989
GL 989 (NGC 2264 IRS) is an infrared source discovered by Allen (1972), which is located at a distance of 750 pc. The presence of a molecular outflow in the region was first described by Bally & Lada (1983). The molecular outflow structure was studied in more detail by Schreyer et al. (1997). Their CO map appears to show that the outflow is oriented rather pole-on. The IR source lies at the apex of a fan-shaped nebula with an approximate visual magnitude of 15, extending to the NW (Schmidt 1972). The morphology of the nebula was studied in the optical by Scarrott & Warren-Smith (1989). They observed a colour gradient characteristic of reflection nebulae, i.e. it is redder the closer to the compact IR source. However, the absence of centro-symmetry around GL 989 in the polarisation pattern, indicates that the nebulosity is not simply a reflection nebula illuminated by this source. Schreyer et al. (1997) studied the morphology of the extended nebula in the near-IR. In this wavelength range, the nebula is also more extended towards shorter wavelengths, which is consistent with a scattered origin for the emission.
Our H-band visibility function obtained at Calar Alto indicated that some 20% of the flux was extended on scales larger than 1″. Hints of diffuse emission to the NW are seen in the reconstructed image as expected if we are detecting the larger scale nebula, but no sub-arcsecond structure was seen. Repeated observations with UKIRT at both H and K-bands failed to detect any extended emission at the 4% level. High resolution observations with NICMOS on board the Hubble Space Telescope (Thompson et al. 1997) also failed to detected any extended emission.
3.14 NGC 2024 IRS2
No nebulosity was found around this object, but a fairly bright companion was found 51 to the east (PA = 283∘). It has a flux at K of about 10% that of NGC 2024 IRS2 and 20% at H. Hence, it is somewhat bluer than IRS2, but still a very red object. This object is not mentioned in the mid-IR survey of Haisch et al. (2001).
3.15 Mon R2 IRS2
This source is embedded in the Mon R2 Hii region itself and the strong background nebulosity caused some problems in the analysis. However, the source does not appear to have any sub-arcsecond structure. Inspection of the radially averaged visibility function yields an upper limit on any contribution to the total flux of about 10% level.
3.16 S106 IR
No sub-arcsecond structure was found in this object with upper limits on a contribution to the total flux of about 3% at K and 6% at H. Possible reflected features are seen extending with a wide opening angle a few arcseconds to the south and west in the -, - and -bands by Persson et al. (1988), but their nature has not been confirmed polarimetrically. Recent near-IR Adaptive Optics imaging of this source shows no sub-arcsecond structure (Feldt et al. 2002). Puga et al. (2003) present a K′ polarisation map of this region at a resolution of 03. No conclusive proof of the presence of the extended features found by Persson et al. can be seen in this map. No clear polarisation pattern is observed within a few arcseconds of S106 IR.
4 Discussion
Six (GL 437, Mon R2 IRS3, GL 490, S255 IRS3, S255 IRS1, S235 IRS1) out of the 21 massive YSOs observed show a significant small scale monopolar reflection nebula above the 1% dynamic range of the speckle imaging presented here. In these cases, the nebular morphology is consistent with light being scattered off the dust in the walls of an outflow cavity. There is usually good agreement between the position angle of the sub-arcsecond nebula and the larger scale outflow indicators such as CO and larger near-IR nebulae. This agreement should be taken with caution though, since in some instances, large scale CO flows appear as multiple outflows in interferometric studies (e.g. Beuther et al. 2003).
We now address the question of why only 28% of the sources show nebulosity at this level and the others do not, bearing in mind that the sample was not selected in any systematic way. Simulations show that by far the most important parameter for the brightness of a reflection nebula for YSOs is the overall optical depth of the envelope (e.g. Whitney & Hartmann 1992; Fischer et al. 1994; Lucas & Roche 1998; Alvarez et al. 2004). Too high an optical depth and the source is either totally invisible or only a faint nebula is present with no bright point source with which to utilise the speckle imaging technique. When the optical depth becomes very low, the central star will dominate the near-IR light such that any nebulosity will be lost in the limited dynamic range of speckle imaging. Other factors such as the inclination angle, the opening angle of the cavity, the density distribution in the envelope and the dust parameters also play a role in determining the nebular brightness. However, these are secondary if the density scale is altered such that the line of sight optical depth is kept constant (Alvarez et al. 2004).
The picture outlined above would primarily be an evolutionary one with the circumstellar matter being gradually cleared by the outflow, and hence there will be less dust available for scattering. There will also be less dust obscuring the central star, and therefore the contrast between the reflection nebula and the central source will increase. At some point the reflection nebulae become undetectable at the 1% level. In those objects where there is insufficient optical depth at K to detect the nebula, then going to shorter wavelengths should reveal the nebulae (e.g. GL 490), as the scattering efficiency increases and the star is obscured. Unfortunately, this can often not be possible with speckle imaging, as the nebula becomes also too faint, even though it is relatively brighter than the star.
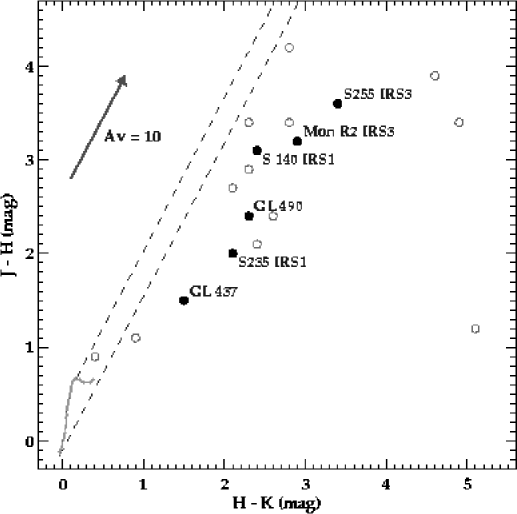
To investigate the detection dependence on optical depth we have plotted our targets on a versus colour-colour diagram in figure 16. There is no clear separation of those with bright sub-arcsecond nebulae and those without in this diagram. The most we can say is that the very lightly reddened sources are not showing the phenomena. This is consistent with these simply not being embedded enough to still produce bright nebulae relative to their central star. However, not all the detections are among the most reddened sources. Of course, using such a colour-colour diagram as an indicator of the optical depth of the circumstellar envelope is fraught with many complications. Some of the highly reddened non-detections could simply suffer from high line-of-sight extinction that does not arise in the immediate circumstellar envelope of the object itself. The K-band brightness is likely to be dominated by hot circumstellar dust contributions in many cases whilst the shorter wavelengths can be primarily due to unresolved scattered light.
We might expect a trend with distance in that it is easier to detect the cavity base in the nearby objects. However, there is not any indication of this in the limited sample we have studied here.
Although the aim of this study was not to search for close companions in massive YSOs, it is worth to note that 3 out of the 21 sources show close companions (LkH$α$ 101, Mon R2 IRS3, GL 961-Wa) with separations between 017 and 13 . These angular separations correspond to projected distances between 150 AU and 1800 AU. This represents a binary detection frequency of 148%. The statistical significance in our sample is fairly poor though, and more massive YSOs should be studied before a robust estimate on the frequency of binaries in massive YSOs can be achieved. In any case, it is worth comparing our binary detection rate with that found in Herbig Ae/Be and OB stars. In a sample of 31 Herbig Ae/Be stars, Leinert et al. (1997) find that 16% have sub-arcsecond separations and 29% have projected separations 1000 AU. Duchêne et al. (2001) find, in a sample of 60 OB stars, an 18%6% sub-arcsecond binary detection rate (projected separations in the range 200 AU – 3000 AU). Hence, we find a binary detection frequency that is in good agreement with that found in Herbig Ae/Be and OB stars.
5 Conclusions
The sub-arcsecond morphology in a sample of 21 massive YSOs has been studied using speckle imaging in the near-IR. About 30% of the sources show a sub-arcsecond monopolar reflection nebula. These nebulae are consistent with being due to light scattered off the walls of the cavity evacuated by the blueshifted lobe of a bipolar outflow in most cases. A wide range of opening angles is seen and some have a gap between the star and the base of the nebular cone. The size of the sample is still far from that necessary to examine trends in opening angle such as whether the cavity widen in angle in older sources as the outflow clears the envelope. Larger and well-selected samples of massive YSOs will be needed to address the properties and evolution of the outflow cavities systematically (see Lumsden et al. 2002).
For the majority of sources where no sub-arcsecond nebulosity is seen, it could be due to them being at a slightly more evolved stage where their circumstellar envelope is not sufficiently optically thick. This could be checked by resolving the emission from the warm or cool dust in these envelopes at either mid-IR or sub-millimetre wavelengths. A In a related paper (Alvarez et al. 2004), we use a Monte Carlo code of the scattered light to examine in detail the detectability and the dependence of the sub-arcsecond nebulae on the physical properties of the circumstellar matter.
Adaptive optics observations are capable of much higher dynamic ranges and will therefore be able to detect a much higher fraction of nebulae than was possible here with speckle imaging. This will also help test the scenario in which the reflection nebulae fade as the outflow clears material from the envelope. Larger telescopes will allow the cavity to be traced closer to the star where collimation of the flow is likely to be occurring.
Acknowledgements.
CA would like to thank to the Physics and Astronomy Department at Leeds University for their support. CA is also deeply grateful to Kapteyn Astronomical Institute for allowing him to use their facilities during the realization of this work. We thank the anonymous referee for the useful comments and suggestions. This research has made use of NASA’s Astrophysics Data System.References
- Allen (1972) Allen, D. A. 1972, ApL, 12, 231
- Alvarez et al. (2004) Alvarez, C., Hoare, M., & Lucas, P. 2004, A&A, in press
- Anthony-Twarog (1982) Anthony-Twarog, B. J. 1982, AJ, 87, 1213
- Aspin (1998) Aspin, C. 1998, A& A, 335, 1040
- Bacciotti et al. (2002) Bacciotti, F., Ray, T. P., Mundt, R., Eislöffel, J., & Solf, J. 2002, ApJ, 576, 222
- Bally & Lada (1983) Bally, J. & Lada, C. J. 1983, ApJ, 265, 824
- Barsony et al. (1991) Barsony, M., Schombert, J. M., & Kis-Halas, K. 1991, ApJ, 379, 221
- Barsony et al. (1990) Barsony, M., Scoville, N. Z., Schombert, J. M., & Claussen, M. J. 1990, ApJ, 362, 674
- Becker & White (1988) Becker, R. H. & White, R. L. 1988, ApJ, 324, 893
- Becker & Fenkart (1971) Becker, W. & Fenkart, R. 1971, A&AS, 4, 241
- Beckwith et al. (1976) Beckwith, S., Evans, N. J., I., Becklin, E. E., & Neugebauer, G. 1976, ApJ, 208, 390
- Beetz et al. (1976) Beetz, M., Elsaesser, H., Weinberger, R., & Poulakos, C. 1976, A&A, 50, 41
- Beuther et al. (2003) Beuther, H., Schilke, P., & Stanke, T. 2003, A&A, 408, 601
- Bieging et al. (1984) Bieging, J. H., Cohen, M., & Schwartz, P. R. 1984, ApJ, 282, 699
- Blair et al. (1978) Blair, G. N., Evans, N. J., vanden Bout, P. A., & Peters, W. L. 1978, ApJ, 219, 896
- Blitz et al. (1982) Blitz, L., Fich, M., & Stark, A. A. 1982, ApJS, 49, 183
- Blitz & Thaddeus (1980) Blitz, L. & Thaddeus, P. 1980, ApJ, 241, 676
- Bloomer et al. (1998) Bloomer, J. D., Watson, D. M., Pipher, J. L., et al. 1998, ApJ, 506, 727
- Brown et al. (1976) Brown, R. L., Broderick, J. J., & Knapp, G. R. 1976, MNRAS, 175, 87P
- Campbell (1984a) Campbell, B. 1984a, ApJ, 287, 334
- Campbell (1984b) Campbell, B. 1984b, ApJL, 282, L27
- Campbell et al. (1986) Campbell, B., Persson, S. E., & McGregor, P. J. 1986, ApJ, 305, 336
- Campbell & Thompson (1984) Campbell, B. & Thompson, R. I. 1984, ApJ, 279, 650
- Castelaz et al. (1985) Castelaz, M. W., Grasdalen, G. L., Hackwell, J. A., Capps, R. W., & Thompson, D. 1985, AJ, 90, 1113
- Cohen & Kuhi (1977) Cohen, M. & Kuhi, L. V. 1977, PASP, 89, 829
- Crampton & Fisher (1974) Crampton, D. & Fisher, W. A. 1974, Publications of the Dominion Astrophysical Observatory Victoria, 14, 283
- Davis et al. (1998) Davis, C. J., Moriarty-Schieven, G., Eislöffel, J., Hoare, M. G., & Ray, T. P. 1998, AJ, 115, 1118
- Deharveng et al. (1997) Deharveng, L., Zavagno, A., Cruz-Gonzalez, I., et al. 1997, A&A, 317, 459
- Dewarf & Dyck (1993) Dewarf, L. E. & Dyck, H. M. 1993, AJ, 105, 2211
- Duchêne et al. (2001) Duchêne, G., Simon, T., Eislöffel, J., & Bouvier, J. 2001, A&A, 379, 147
- Eiroa (1981) Eiroa, C. 1981, A&AS, 44, 77
- Evans et al. (1981) Evans, N. J., Beichman, C., Gatley, I., et al. 1981, ApJ, 246, 409
- Evans & Blair (1981) Evans, N. J. & Blair, G. N. 1981, ApJ, 246, 394
- Evans et al. (1989) Evans, N. J., Mundy, L. G., Kutner, M. L., & Depoy, D. L. 1989, ApJ, 346, 212
- Feldt et al. (2002) Feldt, M., Puga, E., Weiß, A. R., & Hippler, S. 2002, in The Earliest Stages of Massive Star Birth, P. A. Crowther ed., ASP Conf. Ser. 267, 367
- Fischer et al. (1985) Fischer, J., Sanders, D. B., Simon, M., & Solomon, P. M. 1985, ApJ, 293, 508
- Fischer & Henning (1995) Fischer, O. & Henning, T. 1995, Ap&SS, 223, 154
- Fischer et al. (1994) Fischer, O., Henning, T., & Yorke, H. W. 1994, A&A, 284, 187
- Forrest & Shure (1986) Forrest, W. J. & Shure, M. A. 1986, ApJL, 311, L81
- Galli & Shu (1993) Galli, D. & Shu, F. H. 1993, ApJ, 417, 243
- Gaume et al. (1995) Gaume, R. A., Goss, W. M., Dickel, H. R., Wilson, T. L., & Johnston, K. J. 1995, ApJ, 438, 776
- Glindemann et al. (1991) Glindemann, A., Lane, R. G., & Dainty, J. C. 1991, Cappellini, V. and Constantinides, A. G. eds. Digital signal processing, 91, 59
- Gomez et al. (1992) Gomez, J. F., Torrelles, J. M., Estalella, R., et al. 1992, ApJ, 397, 492
- Haas et al. (1992) Haas, M., Leinert, C., & Lenzen, R. 1992, A& A, 261, 130
- Haisch et al. (2001) Haisch, K. E., Lada, E. A., Piña, R. K., Telesco, C. M., & Lada, C. J. 2001, AJ, 121, 1512
- Harker et al. (1997) Harker, D., Bregman, J., Tielens, A. G. G. M., Temi, P., & Rank, D. 1997, A&A, 324, 629
- Harvey et al. (1977) Harvey, P. M., Campbell, M. F., & Hoffmann, W. F. 1977, ApJ, 215, 151
- Harvey et al. (1979a) Harvey, P. M., Campbell, M. F., Hoffmann, W. F., Thronson, H. A., & Gatley, I. 1979a, ApJ, 229, 990
- Harvey et al. (1982) Harvey, P. M., Gatley, I., Thronson, H. A., & Werner, M. W. 1982, ApJ, 258, 568
- Harvey et al. (1979b) Harvey, P. M., Thronson, H. A., & Gatley, I. 1979b, ApJ, 231, 115
- Hayashi et al. (1987) Hayashi, M., Hasegawa, T., Omodaka, T., Hayashi, S. S., & Miyawaki, R. 1987, ApJ, 312, 327
- He et al. (1995) He, L., Whittet, D. C. B., Kilkenny, D., & Spencer Jones, J. H. 1995, ApJS, 101, 335
- Henning et al. (1990) Henning, T., Pfau, W., & Altenhoff, W. J. 1990, A&A, 227, 542
- Herbig (1956) Herbig, G. H. 1956, PASP, 68, 353
- Herbig (1971) Herbig, G. H. 1971, ApJ, 169, 537
- Heyer et al. (1989) Heyer, M. H., Snell, R. L., Morgan, J., & Schloerb, F. P. 1989, ApJ, 346, 220
- Hoare (2002) Hoare, M. G. 2002, in The Earliest Stages of Massive Star Birth, P. A. Crowther ed., ASP Conf. Ser. 267, 137
- Hoare et al. (1994) Hoare, M. G., Drew, J. E., Muxlow, T. B., & Davis, R. J. 1994, ApJL, 421, L51
- Hoare & Garrington (1995) Hoare, M. G. & Garrington, S. T. 1995, ApJ, 449, 874
- Hoare et al. (1996) Hoare, M. G., Glindemann, A., & Richichi, A. 1996, in The Role of Dust in the Formation of Stars, Proceedings of the ESO Workshop Held at Garching. Ed. H. U. Käufl and R. Siebenmorgen, 35
- Hoare & Muxlow (1996) Hoare, M. G. & Muxlow, T. B. 1996, in ASP Conf. Ser. 93: Radio Emission from the Stars and the Sun, 47
- Hofmann & Weigelt (1986) Hofmann, K.-H. & Weigelt, G. 1986, A&A, 167, L15+
- Howard et al. (1994) Howard, E. M., Pipher, J. L., & Forrest, W. J. 1994, ApJ, 425, 707
- Howard et al. (1997) Howard, E. M., Pipher, J. L., & Forrest, W. J. 1997, ApJ, 481, 327
- Itoh et al. (2001) Itoh, Y., Tamura, M., Suto, H., et al. 2001, PASJ, 53, 495
- Jiang et al. (1984) Jiang, D. R., Perrier, C., & Lena, P. 1984, A&A, 135, 249
- Kameya et al. (1989) Kameya, O., Hasegawa, T. I., Hirano, N., Takakubo, K., & Seki, M. 1989, ApJ, 339, 222
- Kawabe et al. (1984) Kawabe, R., Ogawa, H., Fukui, Y., et al. 1984, ApJL, 282, L73
- Koresko et al. (1993) Koresko, C. D., Beckwith, S., Ghez, A. M., et al. 1993, AJ, 105, 1481
- Krassner et al. (1982) Krassner, J., Pipher, J. L., Sharpless, S., & Herter, T. 1982, A&A, 109, 223
- Lada & Gautier (1982) Lada, C. J. & Gautier, T. N., I. 1982, ApJ, 261, 161
- Lada & Harvey (1981) Lada, C. J. & Harvey, P. M. 1981, ApJ, 245, 58
- Lada et al. (1984) Lada, C. J., Thronson, H. A., Smith, H. A., Schwartz, P. R., & Glaccum, W. 1984, ApJ, 286, 302
- Lee et al. (2001) Lee, C., Stone, J. M., Ostriker, E. C., & Mundy, L. G. 2001, ApJ, 557, 429
- Leinert et al. (2001) Leinert, C., Haas, M., Ábrahám, P., & Richichi, A. 2001, A&A, 375, 927
- Leinert et al. (1997) Leinert, C., Richichi, A., & Haas, M. 1997, A&A, 318, 472
- Lenzen (1987) Lenzen, R. 1987, A&A, 173, 124
- Lenzen et al. (1984) Lenzen, R., Hodapp, K. W., & Reddmann, T. 1984, A& A, 137, 365
- Lucas & Roche (1998) Lucas, P. W. & Roche, P. F. 1998, MNRAS, 299, 699
- Lumsden et al. (2002) Lumsden, S. L., Hoare, M. G., Oudmaijer, R. D., & Richards, D. 2002, MNRAS, 336, 621
- Massi et al. (1985) Massi, M., Felli, M., & Simon, M. 1985, A&A, 152, 387
- McCarthy (1982) McCarthy, D. W. 1982, ApJL, 257, L93
- Mellema & Frank (1997) Mellema, G. & Frank, A. 1997, MNRAS, 292, 795
- Minchin et al. (1991) Minchin, N. R., Hough, J. H., Burton, M. G., & Yamashita, T. 1991, MNRAS, 251, 522
- Minchin et al. (1993) Minchin, N. R., White, G. J., & Padman, R. 1993, A&A, 277, 595
- Minchin et al. (1995) Minchin, N. R., White, G. J., & Ward-Thompson, D. 1995, A&A, 301, 894
- Minier et al. (2000) Minier, V., Booth, R. S., & Conway, J. E. 2000, A&A, 362, 1093
- Minier et al. (2001) Minier, V., Conway, J. E., & Booth, R. S. 2001, A&A, 369, 278
- Miralles et al. (1997) Miralles, M. P., Salas, L., Cruz-Gonzalez, I., & Kurtz, S. 1997, ApJ, 488, 749
- Mitchell et al. (1992) Mitchell, G. F., Hasegawa, T. I., & Schella, J. 1992, ApJ, 386, 604
- Mitchell et al. (1995) Mitchell, G. F., Lee, S. W., Maillard, J., et al. 1995, ApJ, 438, 794
- Mozurkewich et al. (1986) Mozurkewich, D., Schwartz, P. R., & Smith, H. A. 1986, ApJ, 311, 371
- Mundy & Adelman (1988) Mundy, L. G. & Adelman, G. A. 1988, ApJ, 329, 907
- Nakano & Yoshida (1986) Nakano, M. & Yoshida, S. 1986, PASPJ, 38, 531
- Nordh et al. (1984) Nordh, H. L., Fridlund, C. V. M., van Duinen, R. J., et al. 1984, A&A, 131, 221
- Park et al. (2000) Park, B., Sung, H., Bessell, M. S., & Kang, Y. H. 2000, AJ, 120, 894
- Persson et al. (1988) Persson, S. E., Campbell, B., & McGregor, P. J. 1988, ApJ, 326, 339
- Poetzel et al. (1992) Poetzel, R., Mundt, R., & Ray, T. P. 1992, A&A, 262, 229
- Preibisch et al. (2002) Preibisch, T., Balega, Y. Y., Schertl, D., & Weigelt, G. 2002, A&A, 392, 945
- Proga et al. (1998) Proga, D., Stone, J. M., & Drew, J. E. 1998, MNRAS, 295, 595
- Puga et al. (2003) Puga, E., Feldt, M., Hippler, S., & Costa, J. 2003, in ASP Conf. Ser. 287: Galactic Star Formation Across the Stellar Mass Spectrum, 247–251
- Ray et al. (1990) Ray, T. P., Poetzel, R., Solf, J., & Mundt, R. 1990, ApJL, 357, L45
- Redman et al. (1986) Redman, R. O., Kuiper, T. B. H., Lorre, J. J., & Gunn, J. E. 1986, ApJ, 303, 300
- Rolph & Scarrott (1991) Rolph, C. D. & Scarrott, S. M. 1991, MNRAS, 253, 63
- Scarrott & Warren-Smith (1989) Scarrott, S. M. & Warren-Smith, R. F. 1989, MNRAS, 237, 995
- Schertl et al. (2000) Schertl, D., Balega, Y., Hannemann, T., et al. 2000, A&A, 361, L29
- Schmidt (1972) Schmidt, E. G. 1972, ApJL, 176, L69
- Schreyer et al. (1997) Schreyer, K., Helmich, F. P., van Dishoeck, E. F., & Henning, T. 1997, A&A, 326, 347
- Schreyer et al. (2002) Schreyer, K., Henning, T., van der Tak, F. F. S., Boonman, A. M. S., & van Dishoeck, E. F. 2002, A&A, 394, 561
- Schwartz (1989) Schwartz, P. R. 1989, ApJL, 338, L25
- Scoville et al. (1986) Scoville, N. Z., Sargent, A. I., Sanders, D. B., et al. 1986, ApJ, 303, 416
- Simon et al. (1983) Simon, M., Felli, M., Massi, M., Cassar, L., & Fischer, J. 1983, ApJ, 266, 623
- Snell et al. (1988) Snell, R. L., Huang, Y.-L., Dickman, R. L., & Claussen, M. J. 1988, ApJ, 325, 853
- Snell et al. (1984) Snell, R. L., Scoville, N. Z., Sanders, D. B., & Erickson, N. R. 1984, ApJ, 284, 176
- Staude et al. (1982) Staude, H. J., Lenzen, R., Dyck, H. M., & Schmidt, G. D. 1982, ApJ, 255, 95
- Tamura et al. (1991) Tamura, M., Gatley, I., Joyce, R. R., Ueno, M. a nd Suto, H., & Sekiguchi, M. 1991, ApJ, 378, 611
- Tamura & Yamashita (1992) Tamura, M. & Yamashita, T. 1992, ApJ, 391, 710
- Thompson et al. (1997) Thompson, R., Rieke, M., & Schneider, G. 1997, STScI-PRC97, 16
- Thronson et al. (1980a) Thronson, H. A., Gatley, I., Harvey, P. M., Sellgren, K., & Werner, M. W. 1980a, ApJ, 237, 66
- Thronson et al. (1980b) Thronson, H. A., Harvey, P. M., Tokunaga, A. T., Thompson, R. I., & Rickard, L. J. 1980b, ApJ, 242, 609
- Tofani et al. (1995) Tofani, G., Felli, M., Taylor, G. B., & Hunter, T. R. 1995, A&AS, 112, 299
- Tomisaka (2002) Tomisaka, K. 2002, ApJ, 575, 306
- Torrelles et al. (1997) Torrelles, J. M., Gomez, J. F., Rodriguez, L. F., et al. 1997, ApJ, 489, 744
- Tuthill et al. (2001) Tuthill, P. G., Monnier, J. D., & Danchi, W. C. 2001, Nature, 409, 1012
- Tuthill et al. (2002) Tuthill, P. G., Monnier, J. D., Danchi, W. C., Hale, D. D. S., & Townes, C. H. 2002, ApJ, 577, 826
- Weigelt et al. (2002) Weigelt, G., Balega, Y. Y., Preibisch, T., Schertl, D., & Smith, M. D. 2002, A&A, 381, 905
- Weintraub & Kastner (1996) Weintraub, D. A. & Kastner, J. H. 1996, ApJ, 458, 670
- Weintraub et al. (1996) Weintraub, D. A., Kastner, J. H., Gatley, I., & Merrill, K. M. 1996, ApJL, 468, L45
- Whitney & Hartmann (1992) Whitney, B. A. & Hartmann, L. 1992, ApJ, 395, 529
- Whitney et al. (2003) Whitney, B. A., Wood, K., Bjorkman, J. E., & Wolff, M. J. 2003, ApJ, 591, 1049
- Wolf et al. (1990) Wolf, G. A., Lada, C. J., & Bally, J. 1990, AJ, 100, 1892
- Wolf (2003) Wolf, S. 2003, CoPhC, 150, 99
- Wu et al. (1996) Wu, Y., Huang, M., & He, J. 1996, A&AS, 115, 283
- Wynn-Williams (1982) Wynn-Williams, C. G. 1982, ARA&A, 20, 587
- Wynn-Williams et al. (1981) Wynn-Williams, C. G., Becklin, E. E., Beichman, C. A., Capps, R., & Shakeshaft, J. R. 1981, ApJ, 246, 801
- Wynn-Williams et al. (1974) Wynn-Williams, C. G., Becklin, E. E., & Neugebauer, G. 1974, ApJ, 187, 473
- Yamashita et al. (1987) Yamashita, T., Sato, S., Tamura, M., et al. 1987, PASJ, 39, 809
- Yao et al. (1997) Yao, Y., Hirata, N., Ishii, M., et al. 1997, ApJ, 490, 281
- Yao et al. (2000) Yao, Y., Ishii, M., Nagata, T., Nakaya, H., & Sato, S. 2000, ApJ, 542, 392
- Yao et al. (1998) Yao, Y., Ishii, M., Nagata, T., et al. 1998, ApJ, 500, 320
- Yorke & Welz (1996) Yorke, H. W. & Welz, A. 1996, A&A, 315, 555
- Zapata et al. (2001) Zapata, L. A., Rodríguez, L. F., & Kurtz, S. E. 2001, Revista Mexicana de Astronomia y Astrofisica, 37, 83
- Zavagno et al. (1999) Zavagno, A., Lagage, P. O., & Cabrit, S. 1999, A&A, 344, 499