Nuclear star formation in the quasar PG1126041 from adaptive optics assisted spectroscopy ††thanks: Based on data obtained at the VLT through the ESO program 71.B-0453(A).
We present adaptive optics assisted spectroscopy of three quasars obtained with NACO at VLT. The high angular resolution achieved with the adaptive optics (), joined to the diagnostic power of near-IR spectroscopy, allow us to investigate the properties of the innermost 100 pc of these quasars. In the quasar with the best adaptive optics correction, PG1126041, we spatially resolve the Pa emission within the nuclear 100 pc. The comparison with higher excitation lines suggests that the narrow Pa emission is due to nuclear star formation. The inferred intensity of the nuclear star formation (13 ) may account for most of the far-IR luminosity observed in this quasar.
Key Words.:
Galaxies: active – Galaxies: nuclei – quasars: emission lines – Galaxies: starburst – Techniques: high angular resolution – Instrumentation: adaptive optics1 Introduction
The study of the stellar populations and star formation in the host galaxies of Active Galactic Nuclei (AGNs) is fundamental to understand the connection between black-hole growth and galaxy formation. Several evidences for such a connection have been obtained in local low-luminosity AGNs, i.e. Seyfert galaxies (e.g. Cid Fernandes et al. cid01 (2001), Heckman et al. heckman97 (1997), Maiolino et al. maiolino95 (1995), Oliva et al. oliva99 (1999)). At higher, quasar-like luminosities the investigation of star formation and stellar population is much more difficult because the tracers of star formation are heavily diluted by the strong active nucleus. Nevertheless a few observational programs have been successful in disentangling the host galaxy and star formation from the quasar light. The separation of the two components has been achieved either through a spectroscopic decomposition or through high angular resolution imaging observations (e.g. Canalizo & Stockton canalizo01 (2001), Courbin et al. courbin02 (2002), Dunlop et al. dunlop03 (2003), Jahnke et al. jahnke03 (2003), Schade et al. schade00 (2000)). By using such observating strategies, evidence both for active star formation and relatively quiescent hosts was found. However, all these studies probed the stellar population on scales of a few kpc, while the stellar activity within the central 100 pc, where any interplay with the quasar activity is expected to occur, remains poorly explored.
During recent years the performances of adaptive optics systems have improved significantly, achieving very high angular resolutions () even on relatively faint sources. Such high angular resolution, coupled with spectroscopic capabilities of some of these systems, allows us to efficiently disentangle components associated with stellar activity even in the circumnuclear region of luminous quasars. In this letter we present NACO observations of three quasars at z 0.06 selected to have an excess of far-Infrared emission. In one of the quasars we find evidence for star formation within the central 100 pc with a rate of , which may account for most of its far-IR emission. We assume a ”standard” cosmology, with , and .
2 Sample selection, observations and data reduction
The targets were selected from the sample of Andreani et al. (andreani01 (1999)) who provide mid-IR and far-IR data for a large number of optically selected quasars. We selected quasars matching the following constraints: 1) z0.06, so that the CONICA projected resolution on the source is better than 100 pc (in the K band) and, at the same time, both Pa and [SiVI]1.97m emission lines are shifted into the K band; 2) far-IR luminosity , i.e. objects more IR luminous than the average of quasars at the same redshift and, therefore, suspected to harbor starburst activity; 3) radio quiet, to avoid synchrotron contamination to the far-IR radiation; 4) visible magnitude V14.5 mag, so that the Adaptive Optics correction can achieve good performances with Strehl ratios of 0.2 by using the quasar itself as a reference to close the loop. Four quasars were selected and three of them, whose properties are listed in Tab. 1, were observed in service mode with NACO.
| Name | RA(J2000) | DEC(J2000) | z | mV | LFIR | Date | seeing | FWHM | SR |
|---|---|---|---|---|---|---|---|---|---|
| IRAS091496206 | 09 16 09.4 | 62 19 29 | 0.057 | 14.1 | 7.9 | Apr 20, 2003 | 1.0′′ | 0.09′′ (100 pc) | 5% |
| PG1126041 | 11 29 16.6 | 04 24 08 | 0.060 | 14.5 | 3.2 | Jun 17, 2003 | 0.4′′ | 0.07′′ (81 pc) | 26% |
| PG2214+139 | 22 17 12.3 | +14 14 21 | 0.066 | 14.5 | 1.5 | Jun 18, 2003 | 0.8′′ | 0.09′′ (114 pc) | 11% |
Both images and spectra were obtained in the K band. Images were obtained in the IB_2.18 filter (to avoid saturation) with the S27 camera, yielding a pixel scale of /pix. Spectra were obtained with a slit at PA0∘, with the Grism2 coupled with the SK order sorting filter, yielding a spectral resolution , and with the S54 camera yielding a pixel scale along the slit of /pix. During each observing run we obtained a diffraction limited nuclear spike of (corresponding to 100 pc projected on these quasars). In the spectroscopic mode the pixel size undersamples the PSF. The Strehl Ratio ranges from 5% to 26% (see Tab. 1).
The spectra were reduced following the standard steps for NIR spectroscopy. The spectra obtained at different positions along the slit were subtracted from each other to remove the background, then flat fielded, aligned, co-added and calibrated. Atmospheric features were corrected by dividing for the spectrum of a reference star. B3III and B5V stars were used for PG1126 and IRAS09149 respectively, and in these cases the spectra were then multiplied by a blackbody at 20000 K to re-establish the correct slope of the continuum. For PG2214 we used a G0V star, and the spectra were then multiplied by the solar spectrum to remove the stellar features and continuum slope (see Maiolino et al. maiolino96 (1996) for details). Images were instead reduced using the eclipse software and the CONICA pipeline.
3 Analysis and results
In this letter we focus on the analysis of the spectra, since they provide the most interesting information. Of the three quasar spectra we obtain spatially resolved features only for the case with the best Adaptive Optics correction, i.e. PG1126041 which was observed with a Strehl Ratio of 26%. The integrated spectrum is shown in Fig. 1. In the following we will concentrate on the analysis of this spectrum.

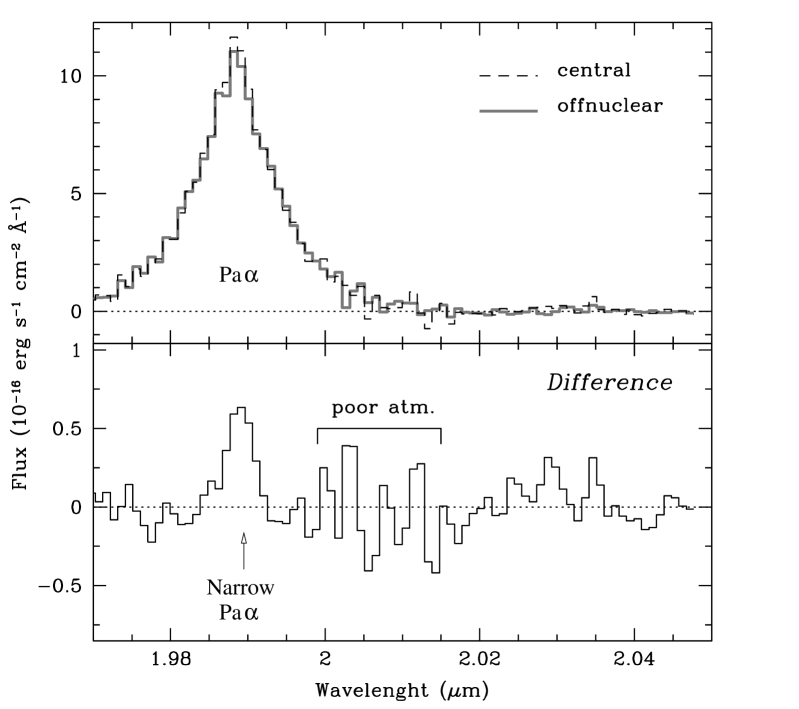
Pa is clearly broad and certainly dominated by the Broad Line Region (BLR). It is more difficult to indentify the presence of a narrow component associated either with a Narrow Line Region (NLR) or with star formation. A method to investigate the presence of a narrow component, while exploiting the high angular resolution delivered by the AO, is to study the spatial variation of the Pa profile along the slit. The BLR is certainly unresolved at our resolution (R1pc) and therefore the profile of the Pa, if totally attributed to the BLR, should not change spatially along the slit, and should simply scale in intensity following the profile of the PSF. We have investigated the variation of the Pa profile along the slit by subtracting the continuum of all spectra at different locations along the slit and then rescaled the spectra to match the Pa flux on the central spectrum. In Fig. 2 we show this comparison for the spectrum north of the central spectrum for PG1126: the solid line shows the (continuum subtracted) central spectrum, while the dashed line shows the rescaled off-nuclear spectrum. The lower panel shows the difference between the two spectra which, although noisy, shows the presence of a excess narrow component () in the off-nuclear spectrum. This demonstrates the presence of a narrow component of Pa, associated either with a NLR or with star forming regions.
Once proved the existence of a narrow component, separated from the BLR, we can follow its spatial behavior along with other spectral features. We have fitted the Pa of PG1126 profile with two broad gaussians, which reproduce the broad (BLR) component, and a narrow component. The resulting fit for the central spectrum is shown in Fig. 3.
| Line | Flux | vvsys | FWHM |
|---|---|---|---|
| Pa - Broad 1 | 953.3 43.3 | 14 37 | 3003 134 |
| Pa - Broad 2 | 457.1 41.7 | 37 32 | 1312 142 |
| Pa - Narrow | 27.6 7.0 | 71 32 | Unresolved |
| Br - Broad | 129.0 10.4 | 75 191 | 2277 258 |
| Br - Narrow | 13.8 6.3 | 124 123 | 697 413 |
| [SiVI] - Broad | 89.7 6.8 | 203 333 | 2797 240 |
| [SiVI] - Narrow | 8.0 1.7 | 42 89 | 360 185 |
In Tab. 2 we list the best fit parameters for the components. For what concerns the blend of [SiVI]1.96m and Br, each of the two lines was fitted by using two gaussian components only (additional components are not required given the lower S/N for these fainter lines)111Note that the profile of the Pa cannot be used to fit the Br because different hydrogen lines originating from the BLR have often different profiles, like in this case.. [SiVI] in particular is well fitted by a broad and a narrow component. The presence of both narrow and broad components of coronal lines (such as [SiVI]) is well known in AGNs. A component with a width intermediate between BLR and NLR () is commonly observed and ascribed to an “Intermediate Emission Line Region” (Giannuzzo et al. giannuzzo95 (1995)). The narrow component of the coronal lines comes instead from the “classical” NLR and extends for a few 100 pc (Maiolino et al. maiolino00 (2000), Thompson et al. thompson01 (2001)). The broad component requires also the profile to be asymmetric, and specifically with a blue wing. Such a blue asymmetry is also commonly observed on high excitation lines from the nuclear region of several Seyferts (e.g. Marconi et al. marconi96 (1996), Oliva et al. oliva94 (1994)).

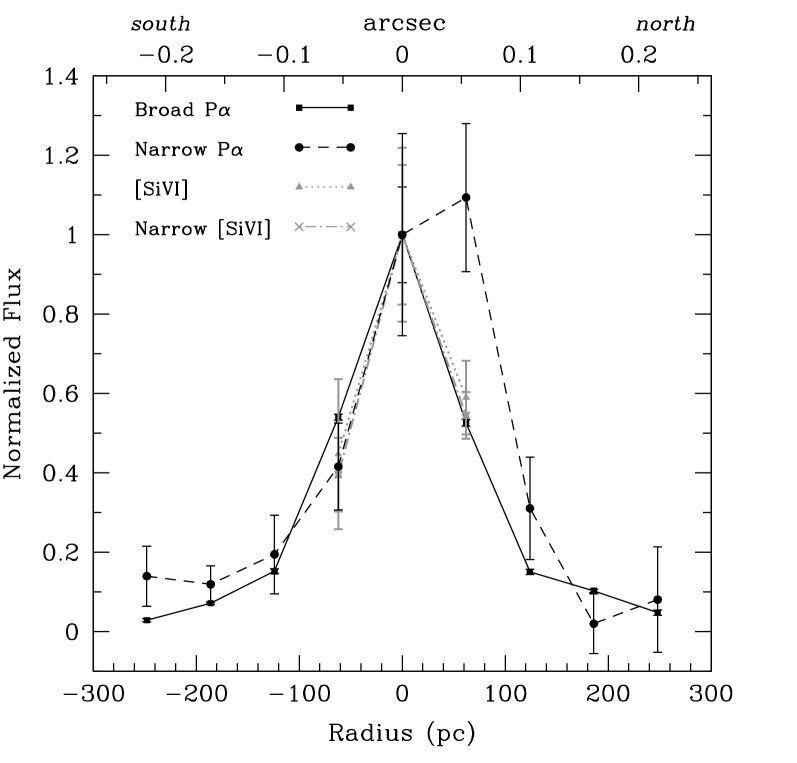
The line profiles on the off-nuclear spectra were fitted by keeping frozen the parameters of the broad components (except for a scaling factor) while the narrow components were left free to vary. In Fig. 4 we show the intensity of the various lines as a function of the offset from the nucleus. The broad component of the Pa gives the profiles of the PSF along the slit (and it is also consistent with the profile of the continuum, not shown). The most interesting result, expected from the analysis discussed above, is that the intensity of the narrow component of Pa does not follow the PSF profile and shows an excess of emission to the North, tracing an emission line region extending for 0.05′′–0.1′′, or 60–120 pc, from the nucleus.
We investigate the nature of the narrow Pa emitting region by comparing its flux with the observed [SiVI] emission. The narrow component of the latter traces the NLR as it is not produced by star forming regions, while the narrow Pa may either come from star formation or from the NLR. The different trends of the narrow Pa and [SiVI] in Fig. 4 suggest that the two lines have different origins. We have further investigated this issue by comparing the ratio between narrow Pa and [SiVI] in the narrow line region of Sy2 galaxies observed by other authors (Sy1 cannot be used because the hydrogen lines include the broad component and generally a decomposition of narrow and broad components is not given). Pa is not observable in low redshift Sy2s, but it can be easily derived from Br by using the case B recombination ratio (which holds for the NLR): Br/Pa=0.082. The additional problem is however that in Sy2 galaxies Br may well be contributed by star formation, since there are several evidences for nuclear and circumnuclear star formation, as discussed in Sect. 1. For this reason we decided to focus on two specific templates: NGC 1068 and Circinus. These are very nearby Sy2’s, extremely well studied, for which there is no evidence in the central region for significant contribution to Br by active star formation (star formation occurs in rings at a radius of ). The Pa/[SiVI] ratio inferred for the NLR is 2.2 in Circinus (Maiolino et al. maiolino98 (1998)) and 1.1 in NGC 1068 (Reunanen et al. reunanen03 (2003)). In PG1126 the ratio between narrow Pa/[SiVI] is 3.4 on the nucleus and 6.4 in the northern region at 60 pc from the nucleus. This comparison indicates that there is a strong excess of narrow Pa emission with respect to that expected from a NLR. Such a Pa excess is probably due to active star formation in the nuclear and circumnuclear region, within the central 100 pc.
Assuming that all the narrow Pa is associated with star formation we can estimate the star formation rate in the central region of this quasar. Unfortunately, our data do not provide a bi-dimensional information of the Pa distribution in the central region. However, we can roughly estimate the circumnuclear integrated Pa emission by assuming that the emission is well represented by the average of the northern and southern sides in our spectrum. The inferred total narrow Pa flux estimated in this way is . From case B recombination (), we infer a total H luminosity due to star formation of . By using the relation between H luminosity and star formation rate given in Kennicutt et al. (kennicutt98 (1998)) we derive a nuclear star formation rate of . According to the relation between SFR and far-IR emission obtained by Kennicutt et al. (kennicutt98 (1998)), such a star formation rate is expected to produce a far-IR luminosity of , which matches the luminosity observed from this quasar (Tab. 1). Therefore, the nuclear star formation detected in the nuclear few 100 pc may well account for most of the far-IR luminosity emitted by this quasar and could explain the excess of far-IR emission in this object (Sect. 2). A similar result was found at higher redshift by Alexander et al. (alexander (2004)), who derived that star formation appears to dominate the bolometric output of AGNs hosted in bright SCUBA galaxies.
Of course, the estimated nuclear star formation rate is derived from a monodimensional spectrum and, in particular, the inferred nuclear (R250 pc) Pa luminosity has required a large aperture correction (a factor of 3). As consequence, a confirmation of these findings is certainly required with integral field spectroscopy. Another source of uncertainty is the possible star formation activity occurring in the host galaxy at radii larger than 250 pc; indeed the limited signal-to-noise ratio of our spectra in the outer regions can only provide a relatively loose upper limit of 0.18 on the star formation rate per unit surface area. Deeper observations are required to further constrain the star formation in the host galaxy.
In the other two quasars the analysis of the line profile is more complex due to imperfect subtraction of some deep atmospheric absorption features and to a much lower Strehl ratio than in PG1126. There are some hints of a resolved narrow component of Pa, but need to be confirmed with higher quality spectra and higher Strehl Ratios.
4 Conclusions
We have obtained K-band spectroscopic observations assisted by adaptive optics of three quasars at z0.06 which are luminous in the far-IR. The adaptive optics correction allows us the reach a diffraction limited angular resolution (, corresponding to pc), with Strehl ratios ranging from 5% to 26%. In the quasar observed with the highest Strehl ratio (PG1126041) we spatially resolve a narrow component of Pa on scales of 50–100 pc. By comparing the spatial distribution of the narrow Pa with the distribution of the coronal line [SiVI]1.96m, we infer that most of the narrow Pa is due to star formation in the nuclear and circumnuclear region of the quasar. We also derive that most of the far-IR emission of this quasar is due to the nuclear star formation detected by us.
These observations clearly demonstrate that adaptive optics assisted spectroscopy is a powerful tool to investigate the nuclear region even in bright quasars.
Acknowledgements.
This work was partially supported by the Italian Ministry of Research (MIUR). We are grateful to the ESO staff on Paranal for having performed these observations in service mode.References
- (1) Alexander, D. M., Bauer, F. E., Chapman, S. C., et al. 2004, astro-ph/0401129
- (2) Andreani, P., Franceschini, A., & Granato, G. 1999, MNRAS, 306, 161
- (3) Canalizo, G. & Stockton, A. 2001, ApJ, 555, 719
- (4) Cid Fernandes, R., Heckman, T., Schmitt, H., Delgado, R. M. G., & Storchi-Bergmann, T. 2001, ApJ, 558, 81
- (5) Courbin, F., et al. 2002, A&A, 394, 863
- (6) Dunlop, J. S., et al. McLure, R. J., Kukula, M. J., Baum, S. A., O’Dea, C. P., & Hughes, D. H. 2003, MNRAS, 340, 1095
- (7) Giannuzzo, E., Rieke, G. H., & Rieke, M. J. 1995, ApJ, 446, L5
- (8) Heckman, T. M., Gonzalez-Delgado, R., Leitherer, C., et al. 1997, ApJ, 482, 114
- (9) Jahnke, K. & Wisotzki, L. 2003, MNRAS, 346, 304
- (10) Kennicutt, R. C. 1998, ARA&A, 36, 189
- (11) Maiolino, R., Ruiz, M., Rieke, G. H., & Keller, L. D. 1995, ApJ, 446, 561
- (12) Maiolino, R., Rieke, G. H., & Rieke, M. J. 1996, AJ, 111, 537
- (13) Maiolino, R., Krabbe, A., Thatte, N., & Genzel, R. 1998, ApJ, 493, 650
- (14) Maiolino, R. Alonso-Herrero, A., Anders, S., et al. 2000, ApJ, 531, 219
- (15) Marconi, A., van der Werf, P. P., Moorwood, A. F. M., & Oliva, E. 1996, A&A, 315, 335
- (16) Oliva, E., Salvati, M., Moorwood, A. F. M., & Marconi, A. 1994, A&A, 288, 457
- (17) Oliva, E., Origlia, L., Maiolino, R., & Moorwood, A. F. M. 1999, A&A, 350, 9
- (18) Reunanen, J., Kotilainen, J. K., & Prieto, M. A. 2003, MNRAS, 343, 192
- (19) Schade, D. J., Boyle, B. J., & Letawsky, M. 2000, MNRAS, 315, 498
- (20) Thompson, R. I., Chary, R., Corbin, M. R., & Epps, H. 2001, ApJ, 558, L97