Spectral Properties of Low Frequency Quasi-Periodic Oscillations in GRS 1915+105
Abstract
We report on the timing analysis of RXTE observations of the Galactic micro-quasar GRS + performed in 2003. Out of a total of six times ks, we focus here only on the three observations during which GRS + is found in a steady C-state (referred to as class ) resulting in a total of ks. During these observations, we detect low frequency quasi-periodic oscillations with high () rms amplitude in the 2–40 keV energy range. Contrary to what is usually observed in GRS 1915+105, in most of our observations the QPO frequency present no correlation with the RXTE/PCA count rate, nor with the RXTE/ASM count rate. We present, for the first time, high resolution (22 spectral channels) 2-40 keV spectral fits of the energy dependence of the QPO amplitude (“QPO spectra”). The QPO spectra are well modeled with a cut-off power law except on one occasion where a single power law gives a satisfactory fit (with no cut-off at least up to keV). The cut-off energy evolves significantly from one observation to the other, from a value of keV to keV in the other observations where it is detected. We discuss the possible origin of this behavior and suggest that the compact jet detected in the radio contributes to the hard X-ray ( keV) mostly through synchrotron emission, whereas the X-ray emitted below 20 keV would originate through inverse Compton scattering. The dependence of the QPO amplitude on the energy can be understood if the modulation of the X-ray flux is contained in the Comptonized photons and not in the synchrotron ones.
1 Introduction
GRS + was discovered by the WATCH instrument on-board
GRANAT
in 1992 (Castro-Tirado et al. 1992). It is the first
Galactic source observed to have apparent superluminal
motion in radio (Mirabel & Rodríguez, 1994),
corresponding to the ejection of plasma at a speed of
of the speed of light. It distance is
estimated to kpc (Chapuis & Corbel 2004), and the mass of the
compact object
in GRS + is estimated to be 14.0 M⊙
(Harlaftis & Greiner 2004).
Systematic monitoring in the X-rays (mainly with
the Rossi X-ray Timing Explorer, RXTE), revealed a rich
pattern of variability on all time scales.
GRS + is a source of Low and High Frequency QPOs (LFQPO,
HFQPO, Morgan, Remillard & Greiner 1997), whose properties
(frequency, rms amplitude) are tightly correlated to the
spectral parameters (Morgan et al. 1997,
Muno et al. 1999, Markwardt et al.
1999, Rodriguez et al. 2002a,b, Vignarca et al. 2002).
When analyzing data of black hole binaries, the frequency of LFQPOs
have been shown to be best correlated with
the slope of the high energy tail of the energy spectra
(Vignarca et al. 2002). It should be noted that the
LFQPO frequency is usually correlated with the soft X-ray flux, thought
to originate from the accretion disk.
Belloni et al. (2000, hereafter B00) analyzing 163
RXTE observations, have shown that,
though complex, the behavior of GRS + could be understood
as spectral transitions between 3 basic states A, B, C.
They identified 12 recurrent classes of variability
on a timescale of 3000 s. GRS + spends most of the time
in the so-called class of variability that corresponds to a
steady state in the X-rays, lying in a rather hard part
of the color-color diagram (state C or hard
state).
Based on the X-ray (spectral end temporal) and radio
properties of GRS +, 4 subclasses (, ,
, ) can be distinguished.
Two of them have a high level of radio emission with a flat
spectrum, LFQPOs, and a high energy tail (B00,
Trudolyubov 2001, Muno et al. 2001, Klein-Wolt et al.
2002).
We monitored GRS + with the INTErnational
Gamma-Ray Astrophysics Laboratory (INTEGRAL) during its
first AO, for a total of 6100 ks (Hannikainen et
al. 2003, 2004), and obtained 120 ks divided in 6 sequences of
simultaneous observations with RXTE.
One of our RXTE observations was planned during an INTEGRAL
target of opportunity on GRS +, and allowed a wide band
simultaneous spectral and temporal coverage to be
performed (Fuchs et al. 2003, hereafter F03). The global analysis of the
whole campaign is dedicated to a future publication. Here we
focus on the timing analysis of the 3 steady
C-state RXTE observations. The data reduction methods are
described in Sec. 2, while the results are presented in Sec. 3
and discussed in Sec. 4
2 Observations and Data Reduction
The log of the observations analyzed in this paper can be found in Table 1. Each observation covers several satellite orbits. The analysis was first performed on each single revolution, and when no noticeable (spectral or temporal) evolution was found, the different orbits were further averaged to increase the statistics.
We extracted light curves from the
Proportional Counter Array (PCA) following the standard
way described in the Cook Book and ABC of RXTE, with the
LHEASOFT V5.3 package.
Good time intervals (gti) are defined as follows:
satellite elevation over the Earth limb ,
offset pointing , and PCU 0 and 2 turned
on. Light curves were extracted from Binned and Event data.
We first accumulated a broad band 2–40 keV (absolute channels 0-94,
epoch 5) light curve with the highest time resolution allowed by
the (Binned) data format ( ms). We then extracted light curves
in small energy bins, with the highest spectral resolution
allowed by the (Binned) data (16 energy bins from 2 to 14.8 keV), and over
7 additional spectral bins for the Event data (from 15 to 40 keV).
Power density spectra (PDS) were produced using
Powspec V1.0, and corrected for white noise.
In the case of the 2–40 keV light curves, PDS were produced on
interval length of 64 s between
15.625 mHz and 64 Hz. All intervals were averaged together.
The energy dependent PDSs were produced on interval of 160 s length,
between 6.25 mHz and 12.8 Hz. Fig. 1 shows, as an example,
the PDS’s extracted in three energy bands, for Obs.1
We extracted background light curves in all these energy ranges,
and used their count rate to obtain the true
rms amplitude following Berger and van der Klis (1994). In addition,
to check for short term evolution of the QPO frequency, we produced dynamical
power spectra with s resolution between absolute channels 0-35
( keV).
3 Results
The preliminary spectral analysis (in a multi-wavelength context) of the first observation is presented in F03. The 8 other sequences presented here show similar steady light curves (see Hannikainen et al. 2004, hereafter H04, for details on the INTEGRAL/RXTE campaign). The RXTE/ASM light curve, showing the dates of our pointed INTEGRAL/RXTE observations is represented in Fig. 2. While the long term evolution shows a slow decay, a double flare occurs between Obs. 1 and Obs. 2-7. This X-ray flare is associated with a radio flare (F03), probably indicative of a discrete ejection. We identify the class of variability of our observations as class of B00. The high level of radio emission detected during each of these observations (F03, H04) allows us to further classify the observations as class also known as the radio loud hard state (Muno et al. 2001) or type II hard state (Trudolyubov 2001). It should be noted, however, such a long term decay with the source mostly in class is rather peculiar, and had never been seen previously. A preliminary spectral analysis (F03; H04) shows that the common model of black hole X-ray binaries, i.e. a multicolor disk black body and a power-law, represents the data well. As mentioned for such classes (Muno et al. 2001), however, the disk temperature returned from the fit is too high (3-4 keV), and the inner radius far too small. Alternative models of broken power-law or broken power-law plus disk component fit the data well and lead to parameters closer to what is seen in other systems (H04). We also successfully fitted the RXTE/PCA 3-25 keV spectra with a cut off power-law with a high energy cut-off of about 20-25 keV (Rodriguez et al. 2004, Fig 3). When adding higher energy spectra, such as those extracted with RXTE/HEXTE, a large deviation to the spectrum is seen at high energy, indicating the need of an additional spectral component to the model, e.g. an extra power law (Zdziarski et al. 2001; Hannikainen et al. in prep.). This is illustrated in Fig. 3 (left panel) with the particular example of Obs. 1111Note that the details of the RXTE and INTEGRAL spectral analysis will be given in a forthcoming paper, dedicated to the spectral analysis of the whole campaign. However, the RXTE (PCA, and HEXTE) spectra have been extracted in the same way as in, e.g., Rodriguez et al. 2003.. Furthermore, Rodriguez et al. (2004) have shown that the 20-400 keV combined RXTE/HEXTE and INTEGRAL/IBIS and SPI spectra could be fitted with a power law of photon index . Note that similar results were found from the OSSE spectral analysis of Zdziarski et al. (2001).
For all sequences, the 2–40 keV PDS were fitted between 15 mHz
and 10 Hz with a sum of 2 or 3 Lorentzians (depending on the energy range),
to account for the wide band variability (Belloni, Psaltis & van der Klis 2002).
A strong LFQPO is detected in all the
PDSs, and is modeled with an additional Lorentzian (harmonics are also detected,
especially during intervals with the longest exposures). A first analysis of Obs. 8
showed a rather broad QPO, with parameters poorly constrained.
As the dynamical power spectrum showed two distinct features, we separated this
observation in sub-intervals
and averaged those showing the QPO at the same frequency. This resulted in two
distinct sets of data, for which we identified two different QPOs.
The LFQPO parameters are reported in Table 2.
At first glance, there is apparently no obvious correlation between the
QPO frequency and the PCA 2–60 keV count rate (Tables 1 &
2). To further verify this, we fitted each of the keV 16 s PDS
used to construct our dynamical power spectra with a Lorentzian around the average QPO frequency
(Table 2), and could therefore obtain the variations of the QPO frequency
with a time resolution of 16 s. No correlation is found between the QPO frequency and
the PCA keV count rate from Obs. 1 through 7, whereas we do find
a correlation in Obs. 8.
We further averaged sequences showing the QPO at a similar
frequency (Obs. 7, showing the QPO at 1.06 Hz is averaged with Obs. 2
and Obs. 4, whereas Obs. 3, 5 and 6 are averaged together), and produced PDS in
the 22 energy bins described in Sec. 2.
These energy dependent PDSs were fitted
between 6.25 mHz and 10 Hz. The energy dependences of the amplitude
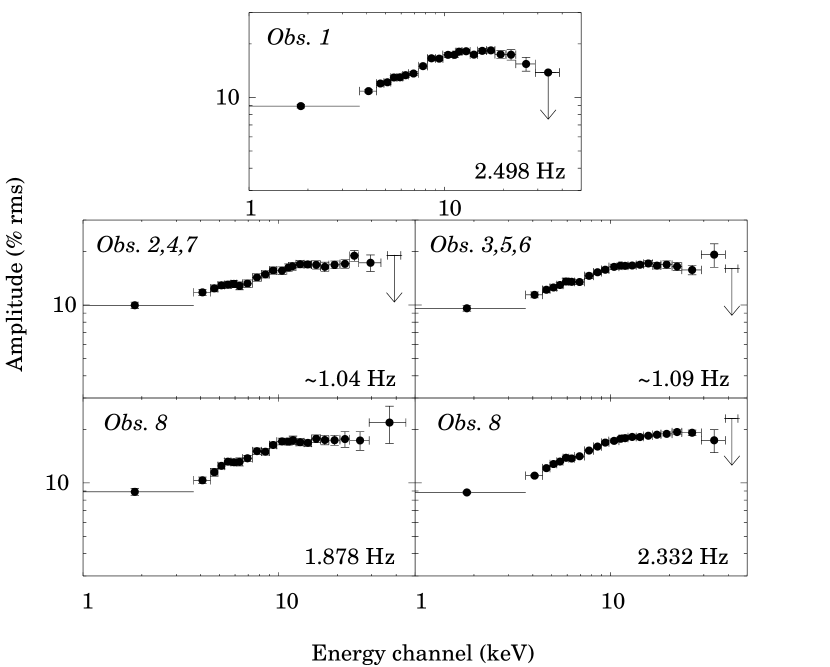
of the four distinct features are reported in Fig. 4.
A clear difference in the shape of the energy dependence of the amplitude
of the QPO appears in Fig. 4. A clear turn-over in the amplitude
vs. energy relation is visible for the Hz QPO
detected on MJD 52731, and another one is visible for the Hz QPO
from the observation of MJDs 52738-52739, although it is not as clear as for the first
QPO. For the three other features we do not see any clear turn-over
(Fig. 4), although a flattening is obvious at energies above 10 keV.
This may suggest that the turn-over energy evolves from one observation to the other,
and is above the upper energy limit of our QPO ”spectra”. To further test this hypothesis,
we fitted the QPO spectra in XSPEC V11.3.0. For all QPOs but the 1.04 Hz one, the
spectra are well fitted by a cut-off power-law (cutoffpl in XSPEC). The fit
parameters are reported in Table 3, while the right panel of Fig.
3 shows the QPO spectrum of Obs. 1 with the best fit model superimposed.
It should be added here that a single power law
gives a rather good representation of the 1.878 Hz QPO detected in Obs. 8, with a
reduced chi square of 1.89 (20 dof). A cut-off power law model improve the fit (Table
3), although the cut-off energy is poorly constrained (4.7- significance
on this parameter). It is interesting to note that the break energy seems anti-correlated with
the QPO frequency, i.e. the lowest break energy is observed for the highest QPO frequency
(Table 3). Caution has to be expressed, however, since the statistical uncertainties
on the break energies does not allow us to draw firm conclusion.
4 Discussion
The presence of LFQPO in GRS 1915+105 during class (as well as during other
classes) is a known fact (e.g. Muno et al. 1999, Rodriguez et al. 2002a,b).
It is also known that QPO parameters depend
on spectral parameters in black hole binaries (BHB) in general.
Here we present observations taken during the same state, with
few differences between the spectral parameters returned from the spectral fits.
The parameters of the QPO change dramatically from one observation to another.
Except in Obs. 8, the frequency of the QPO does not seem to correlate to the PCA
2–15 keV flux or the ASM 1.2–12 keV flux either (although the highest frequency
is observed when the ASM flux is the highest, Fig. 2, and Table 2),
contrary to what is usually claimed/observed. This could indicate some definite
peculiarities in Obs. 1-7 that are taken just before and after the X-ray/radio flare
(Fig. 2, F03). On the other hand, Obs. 8 occurs later, after GRS 1915+105
apparently went off the linear decay phase, after the ASM light curve
showed some variability again.
The most striking behavior appears when studying the energy dependence
of the QPO amplitude. It is expected and a known fact that it presents
a turn-over at some point (e.g. Tomsick & Kaaret 2001, Rodriguez et al. 2002a).
We report here, for the first time, a clear evolution of the turn-over energy
between states that are spectrally similar, and have similar PCA fluxes. This “cut-off”
energy has an origin that is unclear. It could represent, for example, some specific
temperature at which the QPO is produced, either through oscillations of a shocked
boundary layer between the accretion disk, and a hot inner flow (e.g. Chakrabarti
& Titarchuk 1995), or by a hot spot orbiting at some specific radius in the disk
(e.g. Rodriguez et al. 2002a; Tagger et al. 2004). In these two cases, however,
we would expect the frequency of the QPO to scale with the inner radius
of the accretion disk, and thus the soft X-ray flux (Molteni, Sponholz &
Chakrabarti 1996; Tagger & Pellat 1999), unless the soft X-rays are not uniquely produced
by the accretion disk, but by another physical medium, as e.g. a
compact jet (see Markoff & Nowak 2004).
The variations of the soft X-rays flux could be due to variations of the compact jet flux
(with a steady thermal flux from the accretion disk), as we discuss below.
The spectral approach presented in H04, and
Rodriguez et al. (2004), the systematic analysis of type II states
(Trudolyubov 2001), and the detection of a hard tail up to (at least)
600 keV with OSSE (Zdziarski et al. 2001) raise the challenging question of the origin of the
third spectral component needed to fit the high energy spectra well. Models
of jet emission (e.g. Markoff et al. 2003, Markoff & Nowak 2004)
propose a jet model in which the X-ray spectrum of an XRB would represent the sum of
thermal emission from the accretion disk, direct synchrotron from the jet,
inverse Comptonization (either through synchrotron self-Compton from the jet, or
Comptonization on the basis of the jet, the “corona”), reflection of these radiations on
the accretion disk. It should be noted
This proposition has found an echo with
the radio flux/X-ray flux correlation found in several BHBs when in the
low hard state (when the compact jet is present, e.g. Corbel et al. 2003, Gallo et al. 2003),
but also in the case of radio loud AGN (e.g. Merloni, Heinz & di Matteo, 2003;
Falcke, Körding & Markoff, 2004).
Our RXTE observation of MJD 52731 occurred at a time when the radio flux
was high and indicative of the presence of the compact jet (F03).
The level of radio emission as measured by the Ryle telescope at 15 GHz is about
130-150 mJy during this observation, with a spectrum extending up to the near
infra-red range (F03). Unfortunately we do not have such a nice
coverage for the following observations, but the observation of MJDs 52738-52739
indicates a
level of 15 GHz emission higher ( mJy, F03), that is
dropping rapidly. We remark that this observation occurred just after a radio flare
indicative of a discrete ejection. It is thus very likely that the radio emission
this day partly originates from the discrete ejection (with a different spectrum).
During the last observation, the radio
flux is very low compared to the two previous dates, with a level dropping from
107 mJy on MJD 52767 to 44 mJy on MJD 52769 (H04). Both our spectral analysis
(H04, Rodriguez et al. 2004) and the properties of the
QPOs (present work) can be understood easily, if the X-ray emission in GRS 1915+105 during
radio loud/type II/class observations originate (as proposed
by Markoff & Nowak 2004) from two different physical processes (beside the thermal emission of the
accretion disk): Comptonization and synchrotron radiation. The high energy spectrum of a
source with a compact jet represents thus the sum of these different emission processes.
As a result the spectrum will therefore strongly depend on the relative contribution of each
of these emission processes.
The break in the energy spectrum could be representative of the energy at which the relative
contributions of these components cross each other. Above the break the
contribution of the synchrotron radiation would be the dominant process to the spectrum.
Then the higher the relative contribution of the
synchrotron component (to the overall spectrum) the lower the break energy is.
In this case, to understand the energy dependence
of the QPO amplitude, one has to assume that the QPO is contained in the Comptonized
flux, and not in the synchrotron flux. Then the position of the cut-off in the energy
dependence of the QPO amplitude would be linked to the synchrotron flux emitted by
the jet.
We find this interpretation at least qualitatively in good agreement with several
observational facts:
-
•
the compact jet model has successfully been used in the fitting of different BHBs (e.g. Markoff et al. 2001).
-
•
type II states show a 2–30 keV level of variability lower than that of type I (radio quiet) states (Trudolyubov 2001).
-
•
a compact jet is detected during the observation showing the clear and well constrained cut-off in the energy dependence of the QPO amplitude (Obs. 1, Fig. 4)
-
•
a high level of radio emission is detected during the observation taken on MJDs 52738-52739, a turn-over in the energy dependence of the Hz QPO is detected (Fig. 4, Table 3, although it is absent in the spectrum of the Hz QPO), while for the last observation (MJD 52768) the radio flux is much lower, a single power law can fit the first QPO spectrum, and the turn over is poorly constrained (Fig. 4, Table 3).
We should add that the Optical/UV/X-ray variability (and presence of LFQPO
in those bands) seen in XTE J1118+480 (Hynes et al. 2003), a Black Hole X-ray transient in which the compact jet model
has been shown to fit the broad band spectra well (Markoff et al. 2001), is also
compatible with our interpretation. Hynes et al. (2003) pointed out that the
variability could not originate from the disk itself, but involved another non-thermal
source of photons.
The lack of complete simultaneity, between the radio and X-ray observations,
prevents
us from drawing any firmer conclusions. In addition, a cut-off in the spectrum of the
compact jet is expected in the near infra-red domain. Knowing its exact position
would allow us to estimate the flux expected from the jet in the hard
X-rays accurately, and thus test our hypothesis. We hope to obtain such simultaneous
coverages in the near future, with INTEGRAL, RXTE for the high energies, but also
the Ryle telescope and the VLA, in the radio domain, and Spitzer,
and ground based telescopes in the infra red domain.
References
- (1) Belloni T., Klein-Wolt M., Méndez M., et al. 2000, A&A, 355, 271, B00.
- (2) Belloni T., Psaltis D., van der Klis M. 2002, ApJ, 572, 392.
- (3) Berger M. & van der Klis M., 1994, A&A, 292, 175.
- (4) Castro-Tirado A.J., Brandt S., Lund N. 1992, IAUC 5590.
- (5) Chapuis C. & Corbel S. 2004, A&A, 414, 659.
- (6) Chakrabarti S.K., Titarchuk L. G., 1995, ApJ, 455, 623.
- (7) Corbel S., Nowak M., Fender R.P., Tzioumis A. K., Markoff S. 2003, A&A, 400, 1007.
- (8) Falcke H., Körding E., Markoff S., 2004, A&A, in press, astro-ph/0305335
- (9) Fuchs Y., Rodriguez J., Mirabel I.F., et al. 2003, A&A, 409, L35, F03.
- (10) Gallo E., Fender R.P., Pooley G.G. 2003, MNRAS, 344, 60.
- (11) Hannikainen D.C., Vilhu O., Rodriguez J., et al. 2003, A&A 411, L415.
- (12) Hannikainen D.C., Vilhu O., Rodriguez J., et al. 2004, Proceedings of the 5th INTEGRAL workshop, H04.
- (13) Harlaftis E. T.& Greiner J. 2004, A&A, 414, L13.
- (14) Hynes R. I., Haswell C. A., Cui W., et al. 2003, MNRAS, 345, 292
- (15) Klein-Wolt M., Fender R.P. Pooley G.G. et al. 2001, MNRAS, 331, 745.
- (16) Markoff S., Falcke H., Fender R.P. 2001, A&A, 372, L25.
- (17) Markoff S., Nowak M., Corbel S., Fender R., Falcke H. 2003, A&A, 397, 645.
- (18) Markoff S. & Nowak M. 2004, ApJ in press, astro-ph 0403468.
- (19) Markwardt C.B., Swank J.H., Taam R.E., 1999, ApJ, 513, 37.
- (20) Merloni A., Heinz S., di Matteo T., 2003, MNRAS, 345, 1057
- (21) Mirabel I.F., Rodrìguez L.F. 1994, Nature, 371, 46.
- (22) Molteni D., Sponholz H., Chakrabarti S.K., 1996, ApJ, 457, 805.
- (23) Morgan E.H., Remillard R.A., Greiner J. 1997, ApJ, 482, 993.
- (24) Muno M. P., Morgan E. H., and Remillard R. A. 1999, ApJ, 527, 321.
- (25) Muno M.P., Remillard, R.A., Morgan, E.H., et al. 2001, ApJ, 556, 515.
- (26) Rodriguez J., Durouchoux P., Mirabel F., Ueda Y., Tagger M., Yamaoka K. 2002a, A&A, 386, 271.
- (27) Rodriguez J., Varnière P., Tagger M., Durouchoux P. 2002b, A&A 387, 487.
- (28) Rodriguez J., Corbel S., Tomsick J.A. 2003, ApJ 595, 1032.
- (29) Rodriguez J., Fuchs Y., Hannikainen et al. 2004, Proceedings of the 5th INTEGRAL workshop, astro-ph 0403030.
- (30) Tagger M. & Pellat R. , 1999, A& A, 349, 1003.
- (31) Tagger M. Varnière P., Rodriguez J., Pellat R., 2004, ApJ, in press, astro-ph 0401539.
- (32) Tomsick J.A., Kaaret P., 2001, ApJ, 548, 401.
- (33) Trudolyubov S. 2001, ApJ, 558, 276
- (34) Vignarca F., Migliari S., Belloni T., Psaltis D., van der Klis M. 2003, A&A, 397, 729.
- (35) Zdziarski A.A., Grove E.J., Poutanen J., Rao A.R., Vadawale S.V. 2001, ApJ, 554, L45.
| Observation # | Obs. Date | Obs. Id. | Good Time | Number of | Net Count Rate |
|---|---|---|---|---|---|
| (MJD) | (P80127-) | (s) | PCU | /PCU⋆ | |
| 1 | 52731 | 01-03-00 | 9,300 s | 4 | 1737.5 cts/s |
| 2 | 52738 | 02-01-00 | 5,400 s | 3 | 1700.8 cts/s |
| 3 | 52739 | 02-02-02 | 1,800 s | 3 | 1675.8 cts/s |
| 4 | 02-02-01 | 1,800 s | 4 | 1666.9 cts/s | |
| 5 | 02-02-00 | 2,060 s | 3 | 1660.4 cts/s | |
| 6 | 02-03-00 | 11,100 s | 3-4 | 1674.7 cts/s | |
| 7 | 02-01-01 | 3,200 s | 3 | 1677.0 cts/s | |
| 8 | 52768 | 03-01-00 | 14,000 | 3-4 | 1460.2 cts/s |
| Obs. sequence | QPO frequency | Q⋆ | rms amplitude |
| (Hz) | % | ||
| 1 | 2.498 | 5.0 | 12.6 |
| 2 | 1.040 | 3.8 | 13.5 |
| 3 | 1.081 | 7.2 | 13.2 |
| 4 | 1.039 | 7.2 | 12.7 |
| 5 | 1.097 | 10.0 | 11.5 |
| 6 | 1.096 | 6.4 | 13.4 |
| 7 | 1.060 | 6.4 | 13.0 |
| 8_QPO1 | 1.878 | 6.8 | 12.9 |
| 8_QPO2 | 2.332 | 5.3 | 14.9 |
| QPO freq. | Power-law slope | Cut-off energy | reduced (dof) |
|---|---|---|---|
| (Hz) | () | (keV) | |
| 2.498 | 1.0 (19) | ||
| 1.04 | No cut-off⋆ | 0.92 (21) | |
| 1.09 | 0.37 (20) | ||
| 1.878 | 0.5 (19) | ||
| 2.332 | 0.28 (20) |