DENIS detections of highly obscured galaxies in the area around PKS 1343 – 601
Abstract
We present results of a search for galaxies around the highly obscured giant radio galaxy PKS 1343 – 601 using the near-infrared DENIS survey. We compare our findings with surveys in the -band, at the 21 cm line emission, and with 2MASS. Recession velocities of galaxies in this area suggest a low-velocity-dispersion group or cluster of galaxies including an X-ray confirmed Seyfert 2. The colours of the galaxies have been used to examine the extinctions in this low-latitude area where IRAS/DIRBE estimates are unreliable. We find the true extinction to be roughly 15% lower than the IRAS/DIRBE extinctions.
Dept. of Physics & Astronomy, University of Leicester, University Road, Leicester LE1 7RH, UK
Depto. de Astronomía, Universidad de Guanajuato, Apdo. Postal 144, Guanajuato GTO 36000, Mexico
IAP (CNRS UMR 7095), 98 bis Blvd Arago, 75014 Paris, France, and
GEPI (CNRS UMR 8111), Observatoire de Paris, 92195 Meudon, France
Dept. of Astronomy, University of Cape Town, Rondebosch 7700, South Africa
1. Introduction
PKS 1343 – 601 (Centaurus B) is a very strong radio source in the southern Zone of Avoidance (ZoA). Near-infrared (NIR) observations revealed it to be a giant elliptical galaxy as often found in the centre of galaxy clusters. At a distance of from the Great Attractor (GA) and with a recession velocity of 3872 km s-1 (West & Tarenghi 1989) it lies within the GA overdensity. Finding a new cluster here will have considerable impact on the local velocity field calculations. On the other hand, X-ray observations with ASCA have only revealed diffuse emission from PKS 1343 – 601 itself (Tashiro et al. 1998, see also the discussion in Ebeling et al. 2002) which would rule out a rich cluster. A more sensitive XMM-Newton observation does not indicate any obvious cluster emission either but will have to be analysed in detail for an improved estimation.
A detailed discussion of PKS 1343 – 601 and the potential for a cluster in this area can be found in Kraan-Korteweg et al. (these proceedings), who present -band observations of a area around PKS 1343 – 601. Nagayama et al. (2004) have analysed deep observations of the inner (see also Nagayama et al., these proceedings). A more detailed presentation of the following work will be given in Schröder et al. (2004).
To search for galaxies in this highly obscured area () we have used the NIR survey DENIS (Epchtein 1997, 1998). The NIR has the advantage that it is less affected by the foreground extinction as compared to the optical (the extinction in is about 10% of the extinction in ), and that it is sensitive to early-type galaxies, tracers of massive groups and clusters which are neither uncovered in far infrared surveys nor in the 21 cm radiation where extinction is negligible (see Mamon 1994).
2. The DENIS survey
The DENIS survey is a NIR survey of the southern sky in the Cousins-, and passbands with a resolution of in and in and (Epchtein 1997, 1998). The observations were carried out between 1996 and 2001 with a dedicated 1 m ESO telescope at La Silla (Chile). About 92% of the southern sky () were covered.
DENIS images are large with an exposure time of 9 s. The observing mode consisted of step-and-stare scans of 180 images in declination, resulting in strips of . There is an overlap region of on each side of every image. The limiting magnitudes (at a sensitivity of about ) are , , for the -, -, and -bands, respectively, while the limits for high completeness and reliability of the galaxy extraction at high galactic latitudes are , , and , respectively (Mamon 1998).
Interpolating from Cardelli et al. (1989), the extinctions in the DENIS NIR passbands are , , and for . Thus the decrease in number counts of galaxies in the ZoA as a function of extinction is considerably slower in the NIR than in the optical (Schröder et al. 2004, Schröder, Kraan-Korteweg, & Mamon, 1999). While DENIS easily detects galaxies up to extinctions of , we can find intrinsically bright and close by galaxies in the -band at much higher extinctions.
3. DENIS detections
We have searched 29 DENIS slots each with 37 images around PKS 1343 – 601. The total area covered amounts to square degrees. Using the DENIS visualisation package Denis3d by E. Copet we scanned each image simultaneously in the three passbands. That way the relative appearance of highly-obscured galaxies in the three bands, which is different to most stars, could be used to distinguish galaxies from blended stars and extended Galactic objects.
The automatic extraction package SExtractor (Bertin & Arnouts 1996) was used to obtain photometry for the visually detected galaxies. We have derived total magnitudes as well as colours within a 7-arcsecond aperture (to avoid strong contamination by superimposed stars). We have subsequently checked the magnitudes and colours of each galaxy and compared them with the image to see whether SExtractor has deblended all objects close by and whether all the parameters agree with each other.
The Galactic foreground extinctions has been determined using the IRAS/ DIRBE maps by Schlegel, Finkbeiner, & Davis (1998): The colour excess has been converted to using (Cardelli et al. 1989). Note that measurements at latitudes have not been properly calibrated and are thus uncertain.
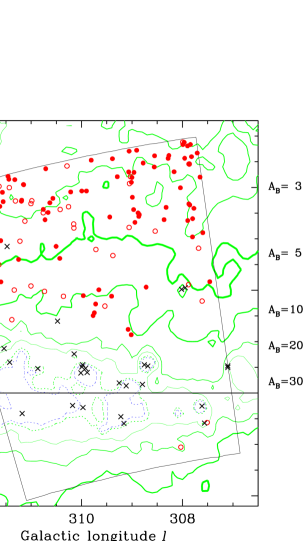
On 1073 searched images we found 83 galaxies (plus 38 uncertain candidates). Of these, 79 (33) are visible in the -band, 82 (35) in , and 67 (25) in (see Schröder et al. 2004 for details). Figure 1 shows the distribution of the detected galaxies: filled circles stand for definite galaxies, and open circles show uncertain candidates. Crosses denote Galactic objects. The contours depict the extinctions at , , , , , , , and , as indicated.
While PKS 1343 – 601 is prominent in all three passbands, a nearby equally large galaxy is not visible in the -band and is probably an early-type spiral with an elongated halo. Two objects at very high extinctions (with and , for DZOA4641-06 and DZOA4645-13, respectively) are classified as uncertain galaxies; they are only visible in the -band. With extinction-corrected (but not diameter-corrected, cf. Cameron 1990) magnitudes of and , respectively, they are only slightly fainter than the central elliptical galaxy at , which would indicate that these two galaxy candidates could lie at the distance of the cluster or closer.
At very high extinctions, we also detected extended Galactic objects like planetary nebulae, H II regions, and reflection nebulae, which are often associated with young stellar objects. Some of these objects are easily recognisable as non galaxian, but there are cases where a distinction could only be made on the basis of high foreground extinction (which is usually ). A careful comparison between unambiguous galaxies and Galactic objects was used to classify cases at intermediate extinctions.
4. Comparison with other catalogues
4.1. -band
Woudt & Kraan-Korteweg (2001, hereafter WKK), who have conducted a deep search for galaxies using copies of the ESO-SERC -band photographic plates, list 35 galaxies within our search area. Only one of their galaxies (WKK2589, DZOA4655-08) is not visible on the DENIS images; it is a small, very low surface brightness galaxy, probably of type Sm or Irr. Five -band galaxies, all classified as uncertain galaxies by WKK, were identified as (blended) stars with the higher spatial resolution of the DENIS -band images.
Most -band galaxies are found in the low extinction regions, that is, at . The highest extinction for a -band galaxy in the searched area is (DZOA4641-07, WKK2301). The completeness limit for and of the WKK-catalogue is .
4.2. 2MASS
We have extracted 65 objects from the 2MASS all-sky extended source catalogue (2MASS, 2003) within the region RA and Dec , 11 of which are just outside the searched DENIS area. Forty nine objects are common in both data sets, nine of which are classified by us as Galactic objects and two as uncertain galaxies. Five 2MASS objects were not found with DENIS; one is a Galactic object, two are mis-identifications, and two are very small but bright galaxies that were not recognised as such in the DENIS search. This gives a rough estimate of the reliability of 80% for the automatic 2MASS extraction in this highly confused and obscured region, while the completeness of the 2MASS galaxy extraction in this area is %. Many of the DENIS galaxies which are not in the 2MASS extended source catalogue were either not recognised as extended by the 2MASS automatic search algorithm (they will be in the 2MASS point source catalogue however), or they are very faint in and and were only found through the DENIS -band.

Figure 2 shows a comparison of the 2MASS - and -band magnitudes with our magnitudes. The -band shows a magnitude difference of and a standard deviation of (upper panel), while in the -band (middle panel) the differences is with a standard deviation of , that is, there is a substantial offset between the two catalogues in the -band. This offset is due to the large difference in magnitude limits of the two surveys: the high-latitude () nominal values for 2MASS are and for and , respectively, while for DENIS they are and , respectively. If we use the 2MASS isophotal -band magnitudes (at per square arcsecond) instead the mean of the differences becomes smaller at (, bottom panel), indicating that the DENIS isophotal limit out to which SExtractor determines the total -band magnitudes is even brighter.
Using the 2MASS isophotal -band the change in offset is negligible (the mean is now with ; not shown) as expected by the smaller difference in limiting magnitudes.
4.3. X-rays
One of the galaxies found in our DENIS search, DZOA4653-11, was discovered in the serendipitous 1XMM catalogue (XMM SSC, 2003) and was identified as a highly obscured AGN (Motch, priv. comm.) with high foreground extinction. A deep -band image obtained by Motch indicates an early type spiral galaxy. A prominent H line in the optical spectrum obtained with EFOSC at the 3.6 m ESO telescope by Motch leads to a heliocentric velocity of km s-1, which means this galaxy is a cluster member. The X-ray flux over the energy range keV is slightly variable with time and gives erg cm-2 s-1, i.e., .

Fitting a cold absorber plus a power law to the XMM-Newton spectrum (Fig. 3) we find a photon index of and a hydrogen column density of cm-2. The Galactic column density at this position from the IRAS/DIRBE estimate from Schlegel et al. is only cm-2, indicating there is significant intrinsic absorption (note, though, that the IRAS/DIRBE maps are uncertain at this latitude), suggesting it to be a Seyfert 2 galaxy. A faint iron line (44 eV equivalent width) is also visible.
4.4. 21 cm wavelength
At 21 cm, the Galactic plane is transparent and the search for galaxies here is limited because of the increased noise due to strong Galactic continuum sources. We have extracted H I velocities for galaxies in this area from the blind H I Parkes All Sky Survey ZoA (HIZOA) survey of the southern ZoA conducted with the multibeam receiver on the Parkes telescope (Kraan-Korteweg et al. 2004), which covers the entire southern ZoA () in the velocity range to 12 700 km s-1 with an integration time of 25 minutes. To these, we added 7 optical velocities of galaxies within the search area (Fairall et al. 1998; Visvanathan & Yamada 1996; West & Tarenghi 1989; and the AGN DZOA4653-11).
Figure 4 shows the velocities plotted as a function of the distance to the giant elliptical PKS 1343 – 601. The velocities in close multiplets and pairs were replaced by their median values, so as to avoid double counting multiply-identified single objects, as well as to remove the binary contribution to the group velocity dispersion. The velocity dispersion out to and for is . However, Figure 4 shows wide gaps in the velocity distribution. In the range there are 18 galaxies with a velocity dispersion , and the gaps outside of the extreme velocities among these 18 galaxies correspond to over . Taking the velocity dispersion at face value, we estimate the virial radius of the system to be , but we only have two velocities within this distance to PKS 1343 – 601, and, iterating over assumed values of the virial radius, one finds that the velocities within the virial radius are compatible with the idea that the system around PKS 1343 – 601 is richer with a larger true velocity dispersion, although it cannot be as rich as a rich cluster (see Schröder et al. 2004, for details). This is consistent with the upper limit on the cluster X-ray emission (Ebeling et al. 2002). However, more velocity measurements and deeper NIR imaging will be needed to confirm this result.

5. Extinction and NIR colours
Colours of galaxies are independent of distance but sensitive to extinction. Hence, NIR colours can be used to derive extinctions in low latitude areas where the IRAS/DIRBE maps are not properly calibrated. Cameron (1990) has shown that one needs to apply both a correction to the isophotal magnitude of a galaxy as well as for the reduction of the major axis of an obscured galaxy. Since the colours used for the following analysis were derived from 7-arcsecond apertures (where contamination by superimposed stars is small) we only applied the magnitude correction according to the extinction in the IRAS/DIRBE maps and looked for dependencies in the residuals.
The left-hand panels in Fig. 5 show the extinction-corrected colours as a function of extinction in the -band (filled circles are galaxies, open circles uncertain candidates). Galaxies at higher extinctions are clearly too blue, i.e., the extinction correction according to the IRAS/DIRBE maps overestimates the true extinction.
With the least square fits to the filled circles (i.e., excluding the uncertain candidates), written in the form where is the colour, we find:
If we assume the true extinction to be a constant factor of the IRAS/DIRBE value of Schlegel et al., i.e., , we can derive the correction from the above equations as
where is the reddening in the respective colour. Combining the (independent) estimates of for and , we derive

To verify this result and to exclude the possibility that this particular region shows an unusual deviation, we have also derived DENIS colours of galaxies found in a different region of the ZoA. These are part of a project that looks for DENIS counterparts of galaxies found with the blind H I ZoA shallow survey (HIZSS, Henning et al. 2002) within a 10-arcminute search radius. Forty H I detections in the area , have been searched so far (Schröder et al., in preparation). The right-hand panels in Fig. 5 show the results for all galaxies found in these regions and with good photometry. The least square fits to the filled circles give:
Despite the different coverage in extinction the slopes of the least square fits agree well within the errors. Combining now the estimates for both regions in the colours and we derive
In other words, we find the true extinction in the southern ZoA to be about 17% lower than the estimates of the maps by Schlegel et al. (1998).
One has to keep in mind that, apart from the difficulties in interpreting high IRAS/DIRBE measurements as reddening values, the gas/dust distribution in the Galactic Plane shows variations on a small spatial scale. This patchiness may lead to a bias in finding galaxies preferentially in the low extinction areas and therefore to underestimate the true extinction. However, the agreement between the two regions we have used is excellent despite the fact that one covers a range in extinction of while the other is restricted to . In other words, the fraction of galaxies missed in the range due to much higher extinction patches is negligible and does not affect our result.
We will continue with this work using the colours of galaxies found within the search radii of the other half of the 110 HIZSS detections at higher Galactic longitudes (and often at higher extinctions) to improve the statistics. Future deeper NIR surveys, like UKIDSS (Warren, 2004) and VISTA (McPherson, Craig, & Sutherland 2003), can be used to go to higher extinction values. A comparison with the current work will be important to verify that no high-extinction patches have substantially influenced the here presented results.
Acknowledgments.
This research has made use of the NASA/IPAC Infrared Science Archive (2MASS) and the NASA/IPAC Extragalactic Database (NED), which are operated by the Jet Propulsion Laboratory, California Institute of Technology, under contract with the National Aeronautics and Space Administration. The authors are grateful to the HIPASS-ZOA team and the DENIS teams in Chile and at PDAC for all the efforts in observing and reducing the data. We also thank Ch. Motch for making unpublished data available to us. ACS and PAW thank the National Science Foundation for financial support; RCKK thanks CONACyT for their support (research grants 27602 and 40094-F).
References
- (1) Bertin, E., & Arnouts, S. 1996, A&A 117, 393
- (2) Cameron, L.M. 1990, A&A 233, 16
- (3) Cardelli, J.A., Clayton, G.C., & Mathis, J.S. 1989, ApJ 345, 245
- (4) Ebeling, H., Mullis, C.R., & Tully, R.B. 2002, ApJ 580, 774
- (5) Epchtein, N. 1997, in 2nd Euroconference, The Impact of Large Scale Near-Infrared Surveys, eds. F. Garzón et al., (Dordrecht: Kluwer), 15
- (6) Epchtein, N. 1998, in 179th Symposium of the IAU, New Horizons from Multi-Wavelength Sky Surveys, eds. B.J. McLean, D.A. Golombek, J.J.E. Hayes, H.E. Payne, (Dordrecht: Kluwer), 106
- (7) Fairall, A.P., Woudt, P.A., & Kraan-Korteweg, R.C. 1998, A&ASS 127, 463
- (8) Henning, P.A., Staveley-Smith, L., Ekers, R.D., Green, A.J., et al. 2000, AJ 119, 2686 (HIZSS)
- (9) Kraan-Korteweg, R.C., Staveley-Smith, L., Donley, J., Koribalski, B., & Henning, P.A. 2004, in IAU Symposium 216, Maps of the Cosmos, eds. M. Colless, and L. Staveley-Smith, ASP Conf. Ser. (ASP: San Francisco), in press, astro-ph/0311129
- (10) Kraan-Korteweg, R.C., Ochoa, M., Woudt, P., & Andernach, H. 2004, these proceedings
- (11) Mamon, G.A. 1994, Ap&SS 217, 237 (astro-ph/9312036)
- (12) Mamon, G.A. 1998, in XIVth IAP Astrophysics Meeting, Wide Field Surveys in Cosmology, eds. S. Colombi, Y. Mellier, & B. Raban, (Gif-sur-Yvette: Editions Frontières), 323 (astro-ph/9809376)
- (13) McPherson, A.M., Craig, S.C., & Sutherland, W. 2003, Large Ground-based Telescopes, eds. J.M. Oschmann, L.M. Stepp, Proceedings of the SPIE, Volume 4837, 82
- (14) Nagayama, T., Woudt, P.A., Nagashima, C., Nakajimia, Y., et al. 2004, MNRAS (in press)
- (15) Nagayama, T., Woudt, P.A., Nagashima, C., Nakajimia, Y., et al. 2004, these proceedings
- (16) Schröder, A., Kraan-Korteweg, R.C., & Mamon, G. 1999, PASA 16, 42
- (17) Schröder, A., Mamon, G., Kraan-Korteweg, R.C., & Woudt, P.A. 2004, A&A (in preparation)
- (18) Schlegel, D.J., Finkbeiner, D.P., & Davis, M. 1998, ApJ 500, 525
- (19) Tashiro, M., Kaneda, H., Makishima, K., Iyomoto, N., et al. 1998, ApJ 499, 713
- (20) Two Micron All Sky Survey team 2003, 2MASS extended objects. Final release. vol.p.
- (21) Visvanathan, N., & Yamada, T. 1996, ApJS 107, 521
- (22) Warren, S. 2004, in IAU Symposium 216, Maps of the Cosmos, eds. M. Colless, and L. Staveley-Smith, ASP Conf. Ser. (ASP: San Francisco), in press
- (23) West, R.M., & Tarenghi, M. 1989, A&A 223, 61
- (24) Woudt, P.A., & Kraan-Korteweg, R.C., 2001, A&A 380, 441
- (25) XMM-Newton Survey Science Centre (SSC) 2003: The First XMM-Newton Serendipitous Source Catalogue, Version 1 (1XMM)