A Possible Origin of Bimodal Distribution of Gamma-Ray Bursts
Abstract
We study the distribution of the durations of gamma-ray bursts (GRBs) in the unified model of short and long GRBs recently proposed by Yamazaki, Ioka, and Nakamura. Monte Carlo simulations show clear bimodal distributions, with lognormal-like shapes for both short and long GRBs, in a power-law as well as a Gaussian angular distribution of the subjets. We find that the bimodality comes from the existence of the discrete emission regions (subjets or patchy shells) in the GRB jet. To explain other temporal properties of short and long GRBs, the subjet parameters should depend on the angle in the whole jet.
Subject headings:
gamma rays: bursts — gamma rays: theory1. Introduction
The durations of gamma-ray bursts (GRBs) observed by BATSE show a bimodal distribution, which has led to a classification of GRBs into two groups: bursts with durations are called short GRBs, and those with durations are called long GRBs (Kouveliotou et al., 1993; McBreen et al., 1994). If directly reflects the active time of the progenitor of the GRB, different origins of short and long bursts are implied, such that the former arise from the binary neutron star mergers while the latter arise from the collapse of massive stars (e.g. Mészáros, 2002; Zhang & Mészáros, 2004).
The short and long bursts roughly consist of 25% and 75%, respectively, of the total BATSE GRB population. We should regard these fractions as comparable, considering possible instrumental effects on the statistics. If these two phenomena arise from essentially different origins, the similar number of events is just by chance. However, some observations have suggested that the short GRBs are similar to the long GRBs (e.g., Germany et al., 2000; Lazzati, Ramirez-Ruiz, & Ghisellini, 2001; Nakar & Piran, 2002; Lamb et al., 2003; Ghirlanda, Ghisellini, & Celotti, 2004). Motivated by these facts, Yamazaki, Ioka, & Nakamura (2004b) proposed a unified model of short and long GRBs, even including X-ray flashes (XRFs) and X-ray–rich GRBs, and showed that it is possible to attribute the apparent differences of the light curves and spectra of these four kinds of events to the different viewing angles of the same GRB jet. This is a counter-argument against the current standard scenario of the origins of short and long GRBs.
In this paper, we perform Monte Carlo simulations to show that our unified model naturally leads the bimodal distribution of the durations of GRBs. The paper is organized as follows. In § 2 we begin with a brief review of our unified model of short and long GRBs. The duration distribution is calculated in § 3. Section 4 is devoted to discussions.
2. Unified Model of Short and Long GRBs
We briefly describe our unified model of short and long GRBs (for details, see Yamazaki, Ioka, & Nakamura, 2004b). We assume that the GRB jet is not uniform but made up of multiple subjets, and that each subjet causes a spike in the observed light curve. This is an extreme case of an inhomogeneous jet model (Nakamura, 2000; Kumar & Piran, 2000). Let us consider a subjet with the opening half-angle moving with Lorentz factor , observed from the viewing angle . Because of relativistic effects, the subjet emission becomes dim and soft when is larger than (Ioka & Nakamura, 2001). The effective angular size of its emission region is , which is larger than the geometrical size of . For the multiple subjet case, the crucial parameter is the multiplicity () of the effective emission regions along a line of sight . If many subjets point toward us (i.e., ) the event looks like a long GRB, while if a single subjet points toward us (i.e., ) the event looks like a short GRB.
Below we give a typical set of parameters for the temporal and spatial configurations of the GRB jet to demonstrate which type of event is observed depending on . We suppose that subjets are launched from the central engine of the GRB randomly in time and directions and that the whole jet consists of these subjets. We introduce a spherical coordinate system in the central engine frame, where the origin is the location of the central engine, and is the axis of the whole jet. The axis of the th subjet () is denoted by , while the direction of the observer is denoted by . We suppose that the th subjet departs at time from the central engine and emits at radius and time . The departure time of each subjet is assumed to be homogeneously random between and , where is the active time of the central engine measured in its own frame and is set to s. The emission model for each subjet is the same as the uniform jet model in Yamazaki, Ioka, & Nakamura (2003a). For simplicity, all the subjets are assumed to have the same intrinsic luminosity and opening half-angle rad, and the other properties are , cm, , , and keV for all . The opening half-angle of the whole jet is set to rad. We randomly spread subjets following the angular distribution function of the subjets as
| (1) |
where and rad (see also Rossi, Lazzati & Rees, 2002; Zhang & Mészáros, 2002). Figure 1 shows an example of the angular distribution of the effective emission regions of the subjets in our calculation. Most of the subjets are concentrated near the axis (i.e., the multiplicity in the center ). For our adopted parameters, isolated subjets exist near the edge of the whole jet, and there are some directions in which no subjet is launched.
Figure 2 shows examples of the observed light curves in the 50–300 keV band, each of which corresponds to the lines of sight A, B, C, and D in Figure 1. The coordinate of C is , and D is close to the center of the whole jet. If many subjets point in the direction of the line of sight, such as in the cases of C () and D (), we see a spiky temporal structure. In the case of B (), the event consists of the distinct emission episodes. These are identified as long GRBs. If only one subjet points toward us, like in the case of A (), the contributions to the observed light curve from the other subjets are negligible because of relativistic beaming effect, so that the observed gamma-ray fluence and duration are both about a hundredth of the typical values of long GRBs. These are quite similar to the characteristics of short GRBs. In addition, when the line of sight is away from any effective subjet regions (i.e., ), the soft and dim prompt emission is observed because of relativistic Doppler effect and beaming effect, which is identified as an XRF or an X-ray–rich GRB (Ioka & Nakamura, 2001; Yamazaki, Ioka, & Nakamura, 2002, 2003a, 2004a, 2004b; Yamazaki, Yonetoku, & Nakamura, 2003b).


3. Distribution of Duration
We perform Monte Carlo simulations to show that our unified model can explain the observed bimodal distribution of durations of GRBs. We fix the subjets’ configuration as in Figure 1. We vary only the line of sight of the observer and calculate the duration for each observer in the 50–300 keV band. We generate 2000 lines of sight with rad according to the probability distribution of . We then select only hard events, whose observed hardness ratio is (Sakamoto et al., 2004). The other soft events are classified as XRFs or X-ray–rich GRBs, which are observed when all subjets are viewed off-axis.
Figure 3 shows the distribution of in our simulation. The multiplicity is roughly proportional to . Then the distribution of is given by (Fig. 3, dashed line). We first consider the distribution in the case in which the redshifts of all the sources are fixed at for simplicity. The result is shown in Figure 4. One can see a bimodal distribution of clearly. Which type of burst is observed, long or short, depends on , and the distribution of is unimodal. Then why does the distribution of the duration become bimodal? The reason for the scarcity of the events for s is as follows. Let us first consider the event with . In this case the duration does not vary significantly around s when , which is determined by the angular spreading time of a subjet. As the viewing angle increases, increases (Ioka & Nakamura, 2001). When , however, the emission becomes soft and dim, so that the event will not be detected as a GRB (Yamazaki, Ioka, & Nakamura, 2002, 2003a; Yamazaki, Yonetoku, & Nakamura, 2003b). The takes a maximum value of s when . We confirm that for almost all s events. Next let us consider the case. The example of the light curve for this case is Figure 2, and the is 14.1 s. The duration is roughly given by the interval between the arrival times of two pulses. Since the two pulses arrive sometime in the range , where is the active time of the central engine measured in the observer’s frame, s, the mean interval is 40/3=13.3 s. This means that the duration of the event is much longer than that for . For , the mean duration is longer than 13.3 s. The typical example is Figure 2 for , with s. This is the reason we have few events for s. The maximum value of is . For the long bursts, the distribution function of durations can be derived from a simple probability argument (see the Appendix A for details). The dashed line in Figure 4 represents the analytical formula of equation (A2). On the other hand, the distribution function of the short bursts seems to be too complicated to calculate analytically, since it sensitively depends on the jet configurations, such as the angular distribution and the intrinsic properties of the subjets.


The ratio of events of the short GRBs and the long GRBs is about , which can be explained as follows (Yamazaki, Ioka, & Nakamura, 2004b). The event rate of the long GRBs is in proportion to the effective angular size of the central core , where . The event rate of the short GRBs is in proportion to , where is the number of isolated subjets in the envelope of the core and in our present case. Then the ratio of event rates of the short and long GRBs becomes .
In reality, we should take into account the source redshift distribution. We assume that the rate of GRBs is in proportion to the cosmic star formation rate. We adopt the model SF2 in Porciani & Madau (2001), in which we take the standard cosmological parameters of and . Figure 5 shows the result. The distribution is again clearly bimodal, and the shapes of the short and long GRBs look like lognormal distributions. The ratio of the number of short and long GRBs is about in this case as well. The dispersion of the lognormal-like distribution seems relatively small compared to the observations. This is ascribed to simple modeling in this paper. We fix the jet configuration and use the same intrinsic properties of the subjets. If we vary for each source and for each subjet randomly, for example, the dispersion of lognormal-like duration distribution will increase from the general argument that the dispersion of the lognormal distribution increases with the increase of the number of the associated random variables (Ioka & Nakamura, 2002). In more realistic modeling the observed dispersion will be reproduced.

4. Discussion
We have investigated the duration distribution of GRBs under the unified model of short and long GRBs proposed by Yamazaki, Ioka, & Nakamura (2004b), and found that the model can reproduce the bimodal distribution observed by BATSE. In our model, the crucial parameter is the multiplicity () of the subjets in the direction of the observer. The duration of an burst is determined by the angular spreading time of one subjet emission, while that of an burst is determined by the time interval between the observed first pulse and the last one. These two different time scales naturally lead a division of the burst durations into the short and long ones. We also performed a similar calculation for a Gaussian distribution, , and found that the duration distribution is bimodal in the same way as for the power-law subjet model.
Let us make another comparison of our model with BATSE data. Mitrofanov et al. (1998) have computed the distribution of the observed pulse number (denoted by in their paper) and found that it is unimodal. If the distribution were compared with the distribution, our model might be compatible with the observations, although some long GRBs are identified as events. They also derive the distribution of the ON time duration—defined as the time during which the emission is larger than 40% of the peak flux—and found it bimodal. Furthermore, they argue that the mean pulse widths of short and long GRBs are different. On the other hand, we computes the ON time duration distribution in the context of our theoretical model and found it unimodal (see Fig. 6), which is expected since the pulse widths are almost the same. However, there are several observational implications that the distances to short GRBs detected with BATSE are smaller than those of long GRBs (e.g., Tavani, 1998; Ghirlanda, Ghisellini, & Celotti, 2004), although this is controversial. Then the observed pulse widths for short and long GRBs might be different because of the redshift factor. To give an example, let us assume that the intrinsic luminosity of each subjet in the core region of the whole jet is larger than that in the periphery of the whole jet and count only the GRB events with peak flux larger than of the maximum peak flux in our simulation. The result is shown in Figure 7, in which we find that the effect of the peak flux cut off contributes to the bimodality of the ON time duration distribution.
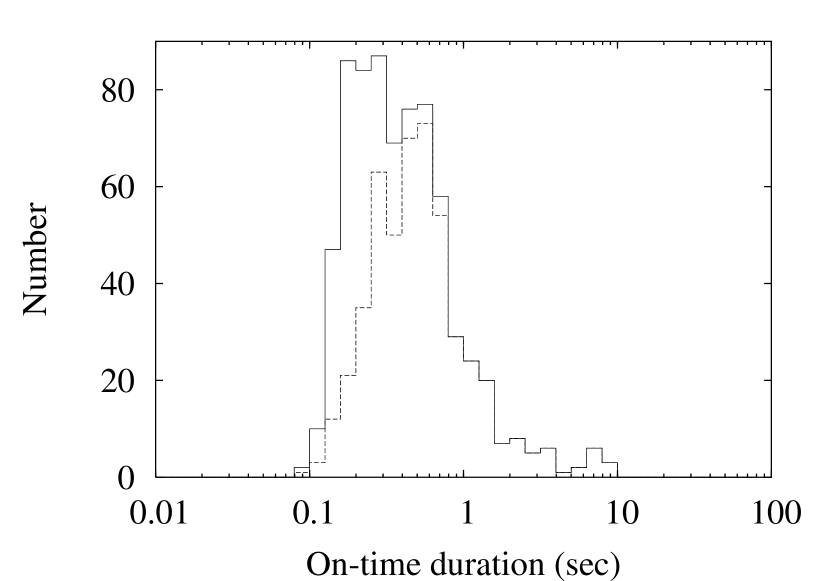

At present, the observationally inferred bimodality of ON time duration is not explained in our current model, in which all the subjets have the same intrinsic luminosity, the same opening half-angle, the same gamma factor, the same emission radius, and so on. This is an extreme modeling for simple calculation. In reality, they may depend on the off-axis angle in the whole jet; so may the pulse widths. Furthermore, Nakar & Piran (2002) investigated the pulse widths of GRBs using 2 ms time resolution and report that short GRBs also consist of several pulses. This can be incorporated into our model by assuming that a subjet radiates successive emissions rather than one instantaneous emission. Then the pulse width with 64 ms resolution (which is used in Mitrofanov et al., 1998) will be determined by the active time of the subjet. If the pulse widths from the subjets in the central part are larger than those in the periphery, the bimodality of ON time duration distribution can be explained. For example, we assume that the emission radius is larger for the core region than for the periphery. Figure 8 is the result, which shows the bimodal-like distribution. Therefore, as we show in two examples (Figs. 7 and 8), some modifications of our model contribute to the bimodality of the ON time duration, so that the current observed ON time duration distribution is not inconsistent with our model. We hope that in the future more sophisticated modeling will reproduce the observed ON time duration distribution.
It has commonly been said that the observed bimodal distribution of the durations of BATSE bursts shows the different origins of short and long GRBs. However, the bimodal distribution is also available as a natural consequence of our unified model of short and long GRBs. The clear prediction of our unified model is that short GRBs are associated with energetic supernovae (SNe), since the association of long duration GRBs with SNe is strongly suggested (Galama et al., 1998; Stanek et al., 2003; Hjorth et al., 2003; Della Valle et al., 2003). Indeed, one of the short GRBs shows possible association with a SN (Germany et al., 2000). Even if the SNe are not identified with short GRBs because of some observational reasons, we predict that the spatial distribution of short GRBs in host galaxies should be similar to that of the long GRBs. Another prediction is that short GRBs have the same total kinetic energies as long GRBs, which might be confirmed by radio calorimetry (Berger et al., 2003).
Appendix A Analytical Estimate of the intrinsic distribution of the Long Bursts
In this Appendix we derive the analytical distribution function of the durations of the long GRBs when all sources are assumed to be at . At first we consider for a given . Each subjet causes one pulse, whose shape is a -function for simplicity. In the present case the arrival time of the pulse from each subjet is random in the range . For a given , the first pulse is required to arrive within . The arrival time of the last pulse is determined as the time after the first pulse. The rest of the pulses are required to arrive within the range of . Thus, the probability function of for a fixed is approximately given by
| (A1) |
For the power-law angular distribution of the subjets the distribution function of is proportional to , so that we get
| (A2) |
The distribution function of for the Gaussian angular distribution of the subjets can be obtained in a similar way.
References
- Berger et al. (2003) Berger, E., et al. 2003, Nature, 426, 154
- Della Valle et al. (2003) Della Valle, M., et al. 2003, A&A, 406, L33
- Galama et al. (1998) Galama, T. J., et al. 1998, Nature, 395, 670
- Germany et al. (2000) Germany, L. M., et al. 2000, ApJ, 533, 320
- Ghirlanda, Ghisellini, & Celotti (2004) Ghirlanda, G., Ghisellini, G., & Celotti, A. 2004, A&A, 422, L55
- Hjorth et al. (2003) Hjorth, J., et al. 2003, Nature, 423, 847
- Ioka & Nakamura (2001) Ioka, K., & Nakamura, T. 2001, ApJ, 554, L163
- Ioka & Nakamura (2002) Ioka, K., & Nakamura, T. 2002, ApJ, 570, L21
- Kouveliotou et al. (1993) Kouveliotou, C., et al. 1993, ApJ, 413, L101
- Kumar & Piran (2000) Kumar, P., & Piran, T. 2000, ApJ, 535, 152
- Lamb et al. (2003) Lamb, D. Q., et al. 2003, preprint (astro-ph/0312503)
- Lazzati, Ramirez-Ruiz, & Ghisellini (2001) Lazzati, D., Ramirez-Ruiz, E., & Ghisellini, G. 2001, A&A, 379, L39
- McBreen et al. (1994) McBreen, B., Hurley, K. J., Long, R., & Metcalfe, L. 1994, A&A, 271, 662
- Mészáros (2002) Mészáros, P. 2002, ARA&A, 40, 137
- Mitrofanov et al. (1998) Mitrofanov, I. G., et al. 1998, ApJ, 504, 925
- Nakamura (2000) Nakamura, T. 2000, ApJ, 534, L159
- Nakar & Piran (2002) Nakar, E., & Piran, T. 2002, MNRAS, 330, 920
- Porciani & Madau (2001) Porciani, C., & Madau, P. 2001, ApJ, 548, 522
- Rossi, Lazzati & Rees (2002) Rossi, E., Lazzati, D., & Rees, M. J. 2002, MNRAS, 332, 945
- Sakamoto et al. (2004) Sakamoto, T., et al. 2004, ApJ, 602, 875
- Stanek et al. (2003) Stanek, K. Z., et al. 2003, ApJ, 591, L17
- Tavani (1998) Tavani, M. 1998, ApJ, 497, L21
- Yamazaki, Ioka, & Nakamura (2002) Yamazaki, R., Ioka, K., & Nakamura, T. 2002, ApJ, 571, L31
- Yamazaki, Ioka, & Nakamura (2003a) Yamazaki, R., Ioka, K., & Nakamura, T. 2003a, ApJ, 593, 941
- Yamazaki, Yonetoku, & Nakamura (2003b) Yamazaki, R., Yonetoku, D., & Nakamura, T. 2003b, ApJ, 594, L79
- Yamazaki, Ioka, & Nakamura (2004a) Yamazaki, R., Ioka, K., & Nakamura, T. 2004a, ApJ, 606, L33
- Yamazaki, Ioka, & Nakamura (2004b) Yamazaki, R., Ioka, K., & Nakamura, T. 2004b, ApJ, 607, L103
- Zhang & Mészáros (2002) Zhang, B., & Mészáros, P. 2002, ApJ, 571, 876
- Zhang & Mészáros (2004) Zhang, B., & Mészáros, P. 2004, Int. J. Mod. Phy. A., 19, 2385