1]Institut für Astronomie und Astrophysik – Astronomie, University of Tübingen, Germany 2]INTEGRAL Science Data Center, ISDC, 1290 Versoix, Switzerland 3]Max-Planck-Institut für extraterrestrische Physik, Giessenbachstr. 1, 85740 Garching, Germany 4]IASF CNR Palermo, Italy 5]IASF Milano, Italy 6]Department of Physics, University of Warwick, Coventry, CV7 1AL, UK 7]Space Sciences Laboratory, University of California, Berkeley, Berkeley, CA, 94702-7450, U.S.A. 8]CASS, University of California, San Diego, La Jolla, CA 92093, U.S.A.
GX 3012 as seen by INTEGRAL
Abstract
We present observations of the High Mass X-ray Binary GX 3012 taken during the Galactic Plane Scan (GPS) with INTEGRAL following our RXTE observations (Kreykenbohm et al., 2004). The optical companion of GX 3012 is the B1Ia+ hypergiant Wray 977 with a luminosity of and a mass of 48 making the system one of the most massive X-ray binaries known. The system was observed 24 times during the GPS thus covering many orbital phases including the pre-periastron flare. The source is clearly detected in all INTEGRAL instruments in most pointings. The derived X-ray light curves show strong variability on all timescales. Depending on the orbital phase of the pointings, the luminosity changes by factor of more than 10 during the pre-periastron flare compared to other pointings. Furthermore, broad band spectra using all instruments available on INTEGRAL are compared with data taken by the RXTE instruments PCA and HEXTE (using the same data as in Kreykenbohm et al., 2004).
1 Wray 977 and GX 3012
GX 3012 consists of a 1.4 neutron star orbiting the early B-emission line star Wray 977. The neutron star is an accreting X-ray pulsar with a rotational period of685 s and a magnetic field strength of G (derived from the measurement of a cyclotron line at 35 keV, Kreykenbohm et al., 2004). While Parkes et al. (1980) classify Wray 977 as a B2 Iae supergiant, Kaper et al. (1995) reclassify it as a B1 Ia+ hypergiant, derive a distance of = 5.3 kpc, opposed to 1.8 kpc, and a higher lower mass limit of 48 . The latter authors also estimate a mass-loss via wind ( = 400 km s-1) of 10-5 /yr which is one of the highest wind-mass-loss rates known. This dense wind can supply the accreting neutron star even over a large distance (e.g., apastron) with enough material to explain the observed luminosity of 1037 erg s-1.
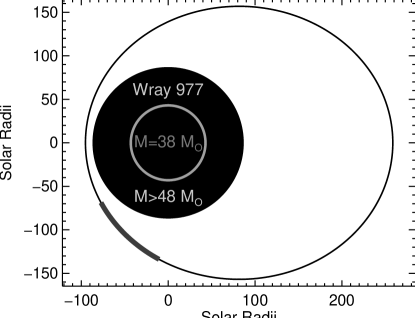
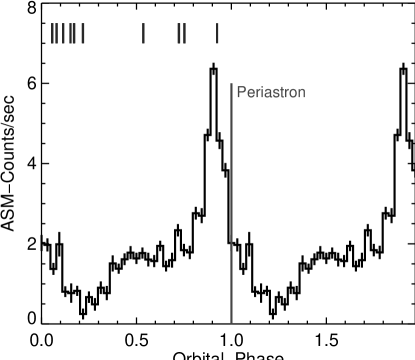
The orbit of the neutron star has a period of 41.4980.007 days (Koh et al., 1997) and an eccentricity of 0.472. Shortly before periastron passage, the neutron star passes through the atmosphere at a height of 0.1 R⋆ above Wray 977 (see Fig. 1). This gives rise to a significant fraction of the X-rays being reflected by the stellar companion. Furthermore it also intercepts a gas stream from the optical companion resulting in periodic extended flares which are centered shortly before periastron passage (see Figs. 1, 2, and Pravdo et al., 1995). After the periastron passage the X-ray activity reaches a minimum to increase slowly over the orbit with a possible second maximum at apastron (Leahy, 1991, 2002). During the pre-periastron flare, GX 3012 can be 25 times brighter than in quiescence and the source is very variable: brightness changes by a factor of two within one hour are not uncommon (Rothschild & Soong, 1987; Kreykenbohm et al., 2004). Following the periastron passage is an extended low which is probably due to the optical companion almost eclipsing the neutron star.
The spectrum of GX 3012 is usually modeled by a power law modified at higher energies by an exponential cutoff and photoelectric absorption at lower energies. The spectrum is further modified by an additive iron fluorescence line at 6.4 keV and a cyclotron resonant scattering feature (CRSF) at 38 keV.
2 Data
GX 3012 was observed several times by INTEGRAL during the Galactic Plane Scan (GPS). We obtained 24 Science Windows (ScWs) during which GX 3012 was in the field of view (FOV) of ISGRI and SPI. Since the FOV of JEM-X is considerably smaller, the source was only visible in 2 ScWs. The observations cover almost all orbital phases, but are mostly concentrated around orbital phase 0.1 (see Fig. 2), where the source is relatively dim. In the ScWs taken when GX 3012 is in the extended low around orbital phase 0.2, the source is only marginally detected. Fortunately, we also have one observation during the pre-periastron flare. (see Fig. 4 and Fig. 4). During this pre-periastron flare the luminosity of the source increased by a factor of 10: compare Fig. 4 and Fig 4 when the source was in the extended low.
3 Spectra
We derived spectra for all ScWs for SPI and ISGRI using OSA version 3.0 which were then combined to obtain spectra of higher statistical quality. To model the resulting spectra, we used several models including a single power-law, a power-law modified by an exponential cutoff (in XSPEC: cutoffpl), and a power-law modified at higher energies by the Fermi-Dirac cutoff (FDCO, Tanaka, 1986):
| (1) |
The conventional high energy cutoff of White et al. (1983) cannot be used as it produces line like residuals at the cutoff energy (Kreykenbohm et al., 1999). While the FDCO and the cutoffpl produce almost identical results in terms of resulting parameters (see Table 1) and , simpler models like a single power law cannot describe the data at all. The resulting parameters show clearly that low energy coverage is required: for the FDCO model, the cutoff energy could not be determined and had to be fixed to a typical value.
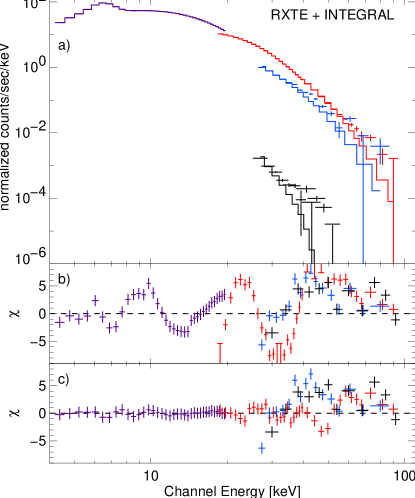
To get coverage at energies below 25 keV, we used a 200 ksec RXTE observation taken in 2000 covering most of the pre-periastron flare and the periastron passage (Kreykenbohm et al., 2004). Since a power law plus cutoff cannot describe the spectrum of GX 3012 below 20 keV (Kreykenbohm et al., 2001), we used an absorbed partial covering model (PC; as described by Kreykenbohm et al., 2004) to simultaneously fit INTEGRAL and RXTE data (see Table 1). The high values for the high as well as the less absorbed component show that the neutron star is indeed deeply embedded in the dense stellar wind of the optical companion.
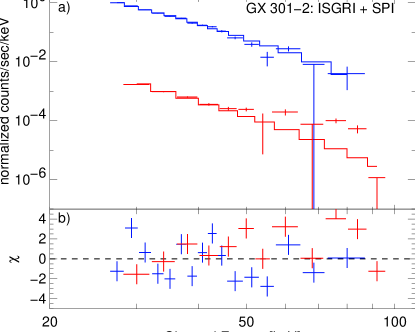
At higher energies, the HEXTE and the INTEGRAL instruments do not agree very well, as shown in Fig. 6. While the HEXTE clearly shows the presence of a cyclotron feature at 35 keV, there is only an indication for a feature at the same energy in the ISGRI data. Due to remaining calibration issues we are not able at this moment to confirm the cyclotron scattering feature with the ISGRI data. To clearly detect the CRSF in SPI data, significantly more data are required.
| Integral | Integral | Integral | |
|---|---|---|---|
| + RXTE | |||
| FDCO | cutoffpl | PC | |
| — | — | 28.9 | |
| — | — | 238 | |
| 20 fix | — | 19.7 | |
| 21.6 | 20.5 | 5.7 | |
| 3.7 | 3.1 | 0.4 | |
| — | — | 33.7 | |
| — | — | 7.5 | |
| — | — | 0.28 |
References
- Kaper et al. (1995) Kaper L., Lamers H.J.G.L.M., Ruymaekers E., et al., 1995, Astron. Astrophys. 300, 446
- Koh et al. (1997) Koh D.T., Bildsten L., Chakrabarty D., et al., 1997, Astrophys. J. 479, 933
- Kreykenbohm et al. (2001) Kreykenbohm I., Coburn W., Wilms J., et al., 2001, In: Jansen F., TBD (eds.) Proc. ’New Visions of the X-ray Universe in the XMM-Newton and Chandra Era’. ESA SP-488, ESTEC, The Netherlands
- Kreykenbohm et al. (1999) Kreykenbohm I., Kretschmar P., Wilms J., et al., 1999, Astron. Astrophys. 341, 141
- Kreykenbohm et al. (2004) Kreykenbohm I., Wilms J., Coburn W., et al., 2004, Astron. Astrophys. submitted
- Leahy (1991) Leahy D.A., 1991, Mon. Not. R. Astron. Soc. 250, 310
- Leahy (2002) Leahy D.A., 2002, Astron. Astrophys. 391, 219
- Parkes et al. (1980) Parkes G.E., Mason K.O., Murdin P.G., Culhane J.L., 1980, Mon. Not. R. Astron. Soc. 191, 547
- Pravdo et al. (1995) Pravdo S.H., Day C.S.R., Angelini L., et al., 1995, Astrophys. J. 454, 872
- Rothschild & Soong (1987) Rothschild R.E., Soong Y., 1987, Astrophys. J. 315, 154
- Tanaka (1986) Tanaka Y., 1986, In: Mihalas D., Winkler K.H.A. (eds.) Radiation Hydrodynamics in Stars and Compact Objects. IAU Coll. 89, Springer, Heidelberg, p. 198
- White et al. (1983) White N.E., Swank J.H., Holt S.S., 1983, Astrophys. J. 270, 711