Abstract
The results of bar-driven mass inflow are directly observable in high-resolution HST observations of their circumnuclear regions. These observations reveal a wealth of structures dominated by dust lanes, often with a spiral-like morphology, and recent star formation. Recent work has shown that some of these structures are correlated with the presence or absence of a bar. I extend this work with an investigation of circumnuclear morphology as a function of bar strength for a sample of 48 galaxies with both measured bar strengths and “structure maps” computed from HST images. The structure maps for these galaxies, which have projected spatial resolutions of 2 – 15 pc, show that the fraction of galaxies with grand-design (GD) circumnuclear dust spirals increases significantly with bar strength, while tightly wound dust spirals are only present in the most axisymmetric galaxies. In the subset of galaxies classified SB(s), SB(rs), or SB(r), GD structure is only found at the centers of SB(s) or SB(rs) galaxies, and not SB(r). Bar strength measurements of 45 SB(s), SB(rs), and SB(r) galaxies show that SB(s) galaxies have the strongest bars, while SB(r) galaxies have the weakest bars. As SB(s) galaxies are also observed to most commonly possess dust lanes along their leading edges, this is further support of a connection between GD structure and bar-driven inflow on larger scales. There is also a modest increase in the fraction of loosely wound dust spirals at later morphological types, and a corresponding decrease in the fraction of chaotic structures. This trend may reflect an increase in the fraction of galaxies with circumnuclear, gaseous disks. The trend appears to reverse at type Scd, where the fraction of galaxies with chaotic circumnuclear dust structure increases dramatically, although these data are of poorer quality.
keywords:
Barred galaxies, galaxy classification, circumnuclear structure[Bars from the Inside Out: An HST Study of their Dusty Circumnuclear Regions] Bars from the Inside Out: An HST Study of their Dusty Circumnuclear Regions
1 Introduction
Bars are the most effective means of driving gas toward the centers of isolated galaxies, inflow which is often invoked to explain circumnuclear star formation and secular evolution (e.g. Kormendy & Kennicutt 2004). Observations of many barred galaxies show evidence for dust lanes along the leading edges of the bar and these dust lanes likely trace the shocks and inflow driven by gravitational torques. The structure of circumnuclear dust within the semiminor axis of the bar can provide important information about the effectiveness of bar-driven mass transport.
It is now possible to quantitatively study the connection between bars and their circumnuclear region due to a combination of three factors: near-infrared surface photometry of a large number of nearby galaxies, a relatively straightforward measure of bar strength from near-infrared images (Buta & Block 2001) through application of the gravitational torque method of Combes & Sanders (1981), and HST images of many of these galaxies. In this contribution I begin with a brief overview of the classification of circumnuclear dust structure. I then apply this system to a large sample of nearby galaxies and investigate correlations between bar strength and circumnuclear structure.
2 Circumnuclear Structure in Galaxies
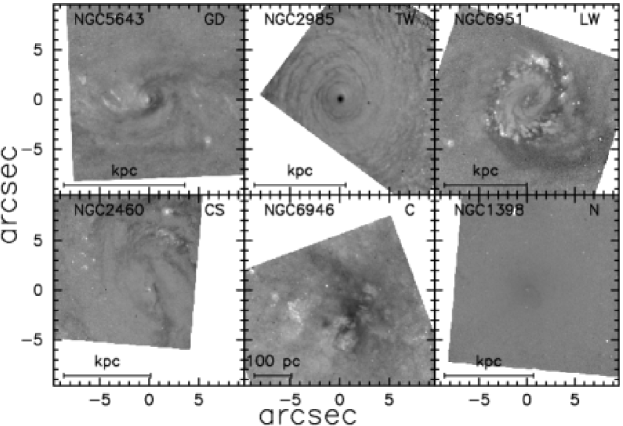
Martini et al. (2003a) conducted an imaging survey of 123 nearby galaxies with the NICMOS and WFPC2 cameras on HST to study circumnuclear dust. These data were used to develop a purely empirical classification system based on common features in the dust distribution and without regard to either the larger scale or nuclear properties of the galaxy. This system is thus complementary to the subject of this conference as it is a dust classification scheme, rather than a dust-penetrated classification scheme. The classification system has six categories:
-
Grand design (GD): Two dominant and coherent dust spirals
-
Tightly wound (TW): Coherent and large pitch angle dust spirals
-
Loosely wound (LW): Coherent and small pitch angle dust spirals
-
Chaotic spiral (CS): Multiple, fragmented dust lanes implying the same sense of rotation.
-
Chaotic (C): Dust structure without a well-defined morphology
-
No Structure (N): No evidence for nuclear dust structure
An example of each of these classes is shown in Figure 1.
The initial sample was culled of all galaxies with km s-1 and inclinations and then each unbarred galaxy was matched with a barred galaxy of approximately the same morphological () type, blue luminosity, heliocentric velocity, inclination, and angular size. This resulted in an extremely well-matched set of 19 barred and 19 unbarred galaxies. The distribution of these 38 galaxies into the six circumnuclear dust classes is shown in Figure 2. This figure clearly demonstrates two connections between bars and their circumnuclear region: GD structure is only found in barred galaxies, while TW structure avoids barred galaxies (Martini et al. 2003b). In addition, GD structure often (but not always) connects to the dust lanes along the leading edges of the bar at larger scales.
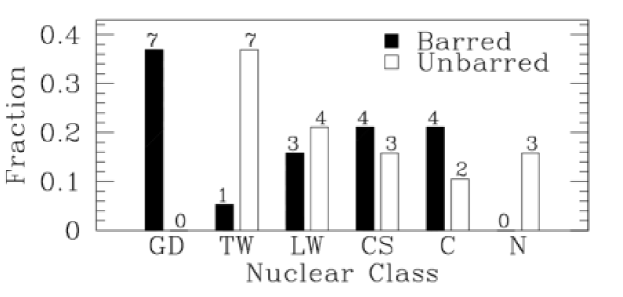
These correlations also validate the classification system itself, as they indicate that the classification bins are connected to physically relevant quantities and are not simply lost in the dust. However, these results were limited by the absence of bar strength measurements for most of the sample. Although Martini et al. (2003a) collected data on whether or not a galaxy was barred from the literature, these data varied substantially in quality and were deemed too heterogeneous to investigate correlations between the circumnuclear morphology and bar strength. In the next section, I apply this classification system to HST observations of a large sample of galaxies with measured bar strengths.
3 Bar Strength and Circumnuclear Structure
The new sample described here was compiled from all galaxies with published bar strengths (Buta & Block 2001; Laurikainen & Salo 2002; Block et al. 2004), visible-wavelength images with HST, and inclinations . Galaxies with low signal-to-noise (S/N), unfavorable placement on the WFPC2 detectors, or of type Scd () or later were barred from inclusion, although Scd galaxies are discussed separately below. The final sample contains 48 galaxies of type S0 to Sc.
I used the structure map technique developed by Pogge & Martini (2002) to identify circumnuclear morphology. For this application, structure maps are superior to color maps because they can be applied to the entire (larger) field of view of the WFPC2 camera and many galaxies only have WFPC2 images. Mathematically, structure maps are:
| (1) |
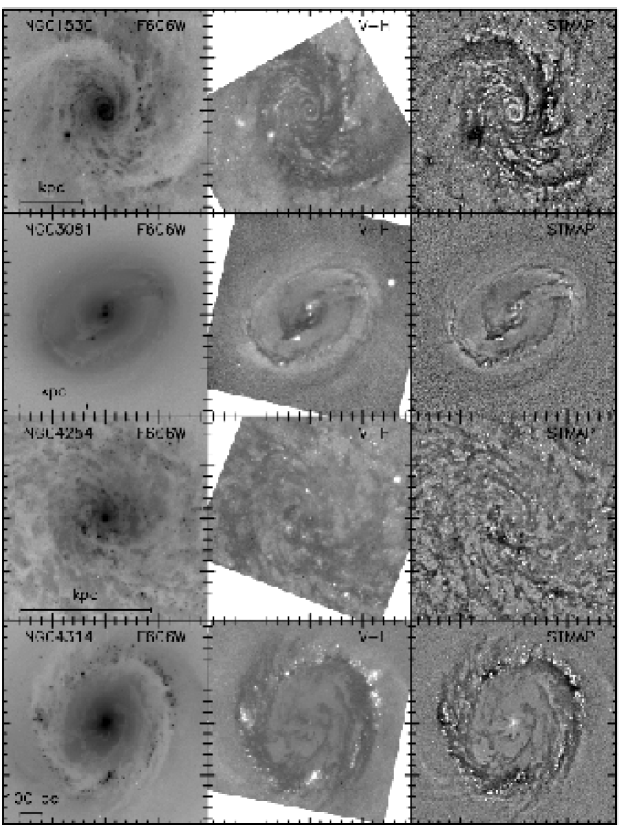
where is the structure map, is the original image, is the PSF, the transpose of the PSF, and is the convolution operator. Structure maps effectively emphasize structures on the scale of the PSF and deemphasize larger-scale spatial variations. In all of the structure maps shown here, dusty regions are dark and emission regions, such as star formation knots, are bright. Figure 3 shows images, color maps, and structure maps of four representative galaxies.
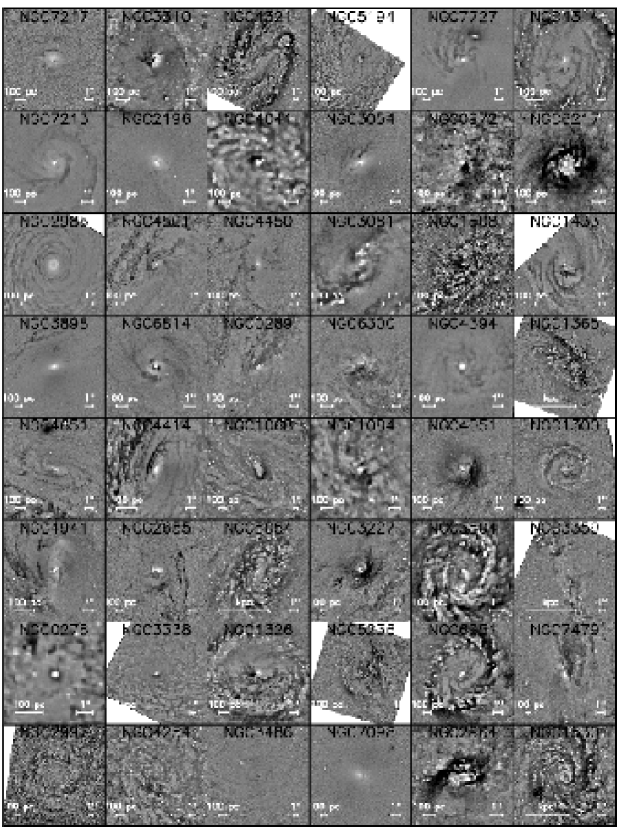
The galaxies were classified with the same system described in the previous section. The only modification is that instead of the fixed angular size of employed by Martini et al. (2003a), I have chosen to classify the sample within a fixed 5% fraction of each galaxy’s angular diameter . This fractional size corresponds to a projected physical size range of kpc, while the projected physical size of the PSF is pc. Figure 4 presents structure maps of the central 5% of the 48 galaxies. There are fourteen galaxies common to this sample and Martini et al. (2003a) and as a check they were reclassified without reference to the prior classification. Nine received the same classification, three switched between the similar classes LW and CS, and only two (14%) changed significantly: NGC 6300 (CGD) and NGC 4314 (LWGD).
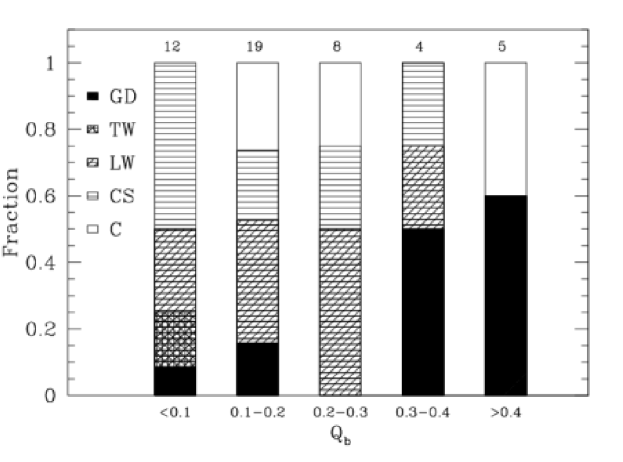
Figure 5 shows the distribution of circumnuclear structure classes as a function of . The N class was not employed here because it was only populated by one galaxy (NGC 1398). Only four of 31 galaxies (13%) with have GD structure, while it is present in five of nine (56%) galaxies with . More strongly barred galaxies are therefore more likely to have GD structure. The one GD galaxy with is NGC 6814, which was also classified GD in Martini et al. (2003a). This galaxy is listed as unbarred in the RC3, although it is classified as barred in the near-infrared.
There are also no galaxies with TW structure and . Large pitch angle dust spirals are therefore not found in galaxies with a significant nonaxisymmetric component. While only two galaxies were classified as TW, the probability that both would have is 4%. This result reinforces the suggestion of Martini et al. (2003b) that TW structure is only present in unbarred galaxies, and also supports recent simulation results (Maciejewski 2004).
Connection to larger-scale spirals: SB(s) and SB(r) galaxies
GD structure is preferentially found in galaxies with large and in many cases appears to be the continuation of the dust lanes along the leading edges of large scale bars, dust lanes that models show are formed by strong bars (Athanassoula 1992). Another historical measure of bar strength is whether the large-scale spiral arms originate at the ends of a bar SB(s), from an inner ring at the radius of the bar SB(r), or are intermediate SB(rs). Observations show that dust lanes along the bar are a characteristic of SB(s) galaxies, rather than SB(r) galaxies (e.g. Sandage & Bedke 1994). The presence of dust lanes suggests SB(s) bars should be strong, although hydrodynamic simulations find SB(s) spirals form with weak, fast bars and SB(r) spirals with strong, slow bars (Sanders & Tubbs 1980).
I have investigated the frequency of GD structure in all galaxies classified as SB in the RC3 (11 galaxies). This sample shows a correlation between GD structure and the connection between the bar and the large-scale spiral arms: Neither of the two SB(r) galaxies in this sample have GD structure, although it is present in SB(rs) galaxies and SB(s) galaxies. To test the connection between these classes and for a larger sample, I have computed the mean for all 45 galaxies classified as type SB(r): 0.28 (15), SB(rs): 0.35 (12), and SB(s) 0.43 (18). On average SB(s) is thus the most strongly barred type and SB(r) the weakest. However, the SB(s) sample does include more galaxies with late type and large . If only galaxies with are included (the range of the SB(r) sample), the mean value of for the SB(s) class decreases to 0.35 (11 galaxies). It would be valuable to revisit the SB(r)/SB(s) classification with near-infrared images.
Connection to global properties
I have also used this sample to investigate if circumnuclear structure depends on type, luminosity, or distance. The sample was divided into early (; 10 galaxies), intermediate (; 16), and late (; 22) type bins. There is a gradual increase in the fraction of LW structure () and an approximately corresponding decline in the fraction of C structure (). No change is observed in the fractional distribution of the remaining classes. The increase in the LW fraction at the expense of the C fraction suggests an increase in the fraction of galaxies that have circumnuclear gaseous disks, as a circumnuclear disk is required for spiral dust lanes to form (types GD, TW, LW, CS). There are no obvious trends with distance or luminosity, although this is not surprising because these galaxies span a relatively narrow range in luminosity and distance. This does indicate that the approximately factor of five range in the projected physical size of the kernel does not affect these results.
Very late-type galaxies
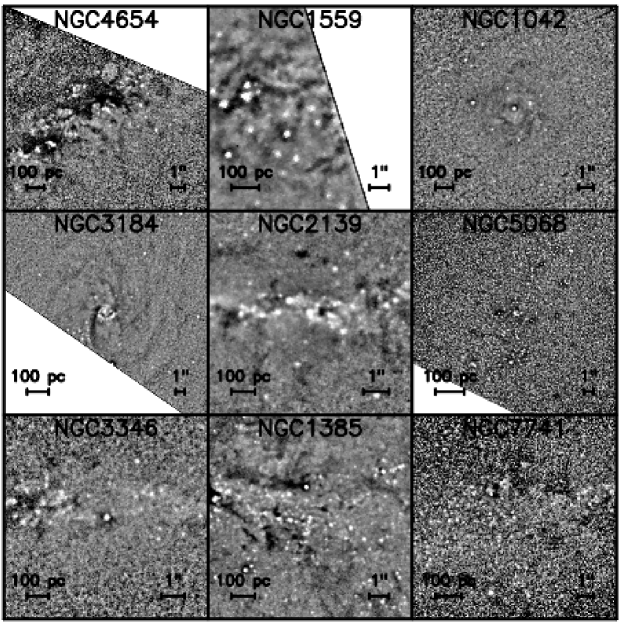
Figure 6 displays the nine Scd galaxies with measured in the HST archive, although only two meet the standards of the main sample. These two galaxies are both of type C, as are all but two of the other (lower S/N) galaxies. This may indicate that there is a dramatic increase in the fraction of galaxies with chaotic structure at very late type, or it may only reflect the importance of high S/N for accurate classification of circumnuclear dust structure.
4 Discussion and Summary
I have computed structure maps from HST data for 48 galaxies with measured bars strengths . These data clearly shown that the fraction of galaxies with GD structure increases sharply for stronger bars, while TW structure is only found in the most axisymmetric galaxies. GD structure is more common in galaxies classified as type SB(s), which are commonly observed to have dust lanes along the leading edges of their bars. Measurement of the mean for SB(s) and SB(r) galaxies shows that SB(s) galaxies generally have stronger bars. GD structure, SB(s) structure, and dust lanes along bars are therefore all correlated with bar strength. The fraction of galaxies with nuclear dust spirals increases at later type, perhaps indicating an increase in the fraction of galaxies with circumnuclear gaseous disks. There is some evidence that this trend reverses at type Scd with an increase in the fraction of C structure, although the available data for these galaxies are significantly poorer quality.
Acknowledgements.
I was supported during the course of this work by a Clay Fellowship at the Harvard-Smithsonian Center for Astrophysics. I acknowledge the support of the American Astronomical Society and the National Science Foundation in the form of an International Travel Grant, which enabled me to attend this conference. Support for this work was also provided by NASA through grant number AR-9547 from the Space Telescope Science Institute, which is operated by the Association of Universities for Research in Astronomy, Inc., under NASA contract NAS5-26555.1
References
- [1] Athanassoula, E. 1992, MNRAS, 259, 345
- [2] Block, D.L. et al. 2004, AJ, press, (astro-ph/0405227)
- [3] Buta, R. & Block, D.L. 2001, ApJ, 550, 243
- [4] Buta, R., Laurikainen, E., & Salo, H. 2004, AJ, 127, 279
- [5] Combes, F. & Sanders, R.H. 1981, A&A, 96, 164
- [6] Kormendy, J. & Kennicutt, R.C. 2004, ARA&A, in press
- [7] Laurikainen, E., & Salo, H. 2002, MNRAS, 337, 1118
-
[8]
Maciejewski, W. 2004, in Carnegie Observatories Astrophysics Series, Vol. 1:
Coevolution of Black Holes and Galaxies, ed. L. C. Ho (Pasadena: Carnegie
Observatories,
http://www.ociw.edu/ociw/symposia/series/symposium1/proceedings.html) - [9] Martini, P., Regan, M.W., Mulchaey, J.S., & Pogge, R.W. 2003, ApJS, 146, 353
- [10] Martini, P., Regan, M.W., Mulchaey, J.S., & Pogge, R.W. 2003, ApJ, 589, 774
- [11] Pogge, R.W. & Martini, P. 2002, ApJ, 569, 624
- [Sandage & Bedke (1994)] Sandage, A., & Bedke, J. 1994, The Carnegie Atlas of Galaxies (Publ. 638; Washington, DC: Carnegie Inst. Washington)
- [12] Sanders, R.H. & Tubbs, A.D. 1980, ApJ, 235, 803