22institutetext: Dipartimento di Astronomia, Università di Trieste, Via G.B. Tiepolo 11, 34131 Trieste, Italy
The Age–Activity–Rotation Relationship in Solar–Type Stars. ††thanks: Observations collected at the ESO VLT. Some data presented herein were obtained at the W. M. Keck Observatory, which is operated as a scientific partnership among the California Institute of Technology, the University of California, and the National Aeronautics and Space Administration. The Observatory was made possible by the generous financial support of the W. M. Keck Foundation.
Measured from high–resolution spectra, we present Ca K line chromospheric fluxes in 35 G dwarf stars of 5 open clusters to determine the age–activity–rotation relationship from the young Hyades and Praesepe (0.6 Gyr) to the old M 67 ( 4.5 Gyr) through the two intermediate age clusters IC 4651 and NGC 3680 ( 1.7 Gyr). The full amplitude of the activity index within a cluster is slightly above 60 % for every cluster but one, NGC 3680, in which only two stars were observed. As a comparison, the same Solar Ca index varies by during a solar cycle. Four of our clusters (Hyades and Praesepe, IC 4651 and NGC 3680) are couple of twins as far as age is concerned; the Hyades have the same chromospheric–activity level than Praesepe, at odds with early claims based on X–ray observations. Both stars in NGC 3680 are indistinguishable, as far as chromospheric activity is concerned, from those in the coeval IC 4651. This is a nice validation of the existence of an age–activity relationship. On the other hand, the two intermediate age clusters have the same activity level of the much older M 67 and of the Sun. Our data therefore shows that a dramatic decrease in chromospheric activity takes place among solar stars between the Hyades and the IC4651 age, in about 1 Gyr. Afterwards, activity remains virtually constant for more than 3 Gyr. We have also measured for all of our stars and the average rotational velocity shows the same trend as the chromospheric–activity index. We briefly investigate the impact of this result on the age determinations of field G dwarfs in the solar neighborhood; the two main conclusions are that a consistent group of ’young’ stars (i.e. as active as Hyades stars) is present, and that it is virtually impossible to give accurate chromospheric ages for stars older than 2 Gyr. The observed abrupt decline in activity explains very well the Vaughan-Preston gap.
Key Words.:
Stars: late–type – Stars: activity – Stars: chromosphere – Stars: rotation1 Introduction
Chromospheric activity is powered by rotation in the presence of a deep convective envelope. Because of rotation braking by a magnetised stellar wind, rotational velocity decreases with age, as well as activity, unless the angular momentum is sustained by tidal interaction, as in the case of short–period binaries. This simple picture is at the basis of the so called age–activity–rotation relationship in solar–type stars and forms the paradigm of stellar activity in the last 30 years. The literature on the argument is enormous and the reader may refer to a number of works, among which we mention the Parker’s review on the solar magnetic fields (Parker, 1970).
The present study aims at improving this picture by accurately ascertaining the form of the activity–age law on the basis of a new dataset. The decaying law of chromospheric activity is a precious tool in determining ages of field main sequence stars and chromospheric ages have been used to undertake detailed studies of the star formation rate and chemical enrichment of the Galaxy (Rocha Pinto et al., 2000 II ; Rocha Pinto et al., 2000 I ).
The flux emission in the core of the K line of Ca is the most effective tracer to probe the chromospheric activity in solar–type stars (see e.g. Blanco et al., 1974; Linsky & Ayres, 1978). Indeed, we intend to use in this study the equivalent width of the line emission core, corrected for the underlying stellar photospheric contribution and transformed into flux at the stellar surface (), as index of the level of chromospheric activity (Pasquini et al., 1988).
Among similar indices the most used and widely known is the Mount Wilson , which is the flux in the Mount Wilson photometer passband normalized to the stellar effective temperature (Noyes et al., 1984). The apex indicates that the quantity is corrected for the the photospheric–flux contribution. This convention will be adopted throughout this paper. While the Mount Wilson’s index is a contrast index, our is an absolute flux. If we indicate the chromospheric flux of the H and K line cores at the stellar surface (erg cm-2sec-1) as , and the bolometric one as , then is the ratio .
While chromospheric activity has been widely studied in field stars (see e.g. Henry et al., 1996; Wilson, 1963; Pasquini et al., 1990; Pasquini, 1992), relatively little work has been done on clusters, which are the perfect calibrators of the age–activity–rotation relationship: they are in fact homogeneous samples of stars with well determined ages.
For the reasons explained in van den Bergh & McClure, (1980), old open clusters are rare and tend to be distant. This is why the original Skumanich, (1972) law was based only on 1 point older than the Hyades, which was the Sun. Only with the advent of 4–m telescopes and high–sensitivity instruments has it been possible to acquire Ca spectra for subgiants in M 67 (Dupree et al., 1999), which is as distant as 850 pc (see e.g. Carraro et al., 1996). Nowadays 8–m class telescopes are sufficiently sensitive to allow the study of Ca emission even in the dwarfs of distant clusters.
Barry et al., (1987) made the most consistent attempt to cover the lack of old–intermediate age clusters data. They built a 2–Å resolution system and used it to observe several intermediate and old clusters. This very interesting attempt, on the other hand, needs to be looked with some caution, since, for instance, the typical G star emission core is much larger than 2 Å. Therefore a 2–Å resolution is sensitive to other factors, such as zero point corrections and photospheric profile in addition to activity (see also Soderblom et al., 1991, for a discussion on Barry et al.’s data). A narrower, pure chromospheric–activity index based on high–resolution spectroscopy, such as the quoted , is of course much more reliable. This is the main ground of the present work.
2 Observations and data sample
Our study is based on spectra of 35 stars in 5 open clusters and on the solar data from White & Livingston, (1981). White and Livingston made a very detailed study of the Ca solar K line covering the cycle 21 from the first minimum to the maximum. Because of differences in data analysis and reduction, their 1–Å indices have to be multiplied by 1.11 to be homogeneous with ours.
The Praesepe, NGC 3680, IC 4651 and M 67 observations were obtained with the UVES spectrograph at the VLT Kueyen telescope. The blue slit was set at 0.7 arc seconds giving a resolving power of R 60000 (Dekker et al., 2000). For the faintest stars, up to 3 consecutive 90–minutes exposures were co added, in order to reach enough signal at the bottom of the deep Ca K line which is typically less than 10 of the continuum in non active stars. The signal to noise ratio per pixel at the bottom of the K line ranges from about 10 for the worst spectra in M 67 to about 30 for most of the spectra in Praesepe.
The red slit was set to 0.4 arc seconds, to obtain a resolution of R=100000
The data were reduced using the UVES pipeline (Ballester et al., 2000), radial velocity corrected and finally co–added.
The Hyades spectra were obtained within the program of search for extra–solar planets among the solar–type stars of this cluster (Cochran et al., 2002; Paulson et al., 2002) with HIRES at the Keck Observatory. They have a resolution similar to the blue UVES ones (R=60000), and a signal to noise ratio at the bottom of the K line ranging from about 20 to about 30. The original Hyades’ sample comprises a large range of spectral types, and was selected to include only stars with lower than 15 km/sec. We have selected for the present study only the dwarfs with BV colours similar to the solar one. According to Strassmeier et al., (2000) (see the g panel in their Figure 4), late–type stars which rotate faster than 15 km/sec are rare exceptions (unless we are dealing with clusters much younger than the Hyades, see Bouvier, 1997), therefore we do not expect to have a strong bias towards slow rotators.
All the Ca data have been normalized to the 3950.5 Å pseudocontinuum (Catalano, 1978).
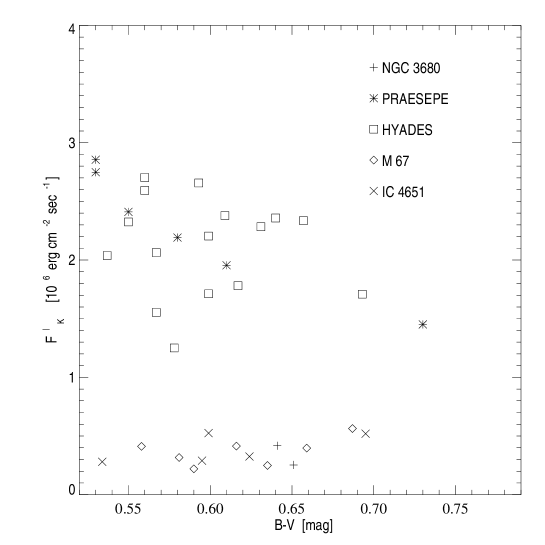
The clusters span a wide range of ages, from the young Hyades and Praesepe (0.6 Gyr) to the old M 67 (4.8 Gyr). Together with the Sun, they constitute three pairs of objects at three different ages: Hyades and Praesepe, IC 4651 and NGC 3680 (1.6 and 1.8 Gyr), and M 67 and the Sun (4.8 and 4.48 Gyr). This allows to have a first check on the consistency of the age–activity–rotation relationship: if each pair has the same chromospheric–activity level, we will have a strong confirmation that chromospheric activity is an age driven parameter.
In addition, the comparison between Hyades and Praesepe is extremely interesting, after the finding by Randich & Schmitt, (1995) that the solar stars belonging to these clusters have different X–ray (coronal) emission, with the Hyades showing substantially higher X–ray luminosities than Praesepe (see Barrado y Navascues et al., 1997, and reference therein).
The ages of M 67, NGC 3680 and IC 4651 are taken from Carraro & Chiosi, (1994). Hyades and Praesepe, with some differences between various authors, are often thought to be coeval with ages of about 0.6 Gyr (see e.g. Perryman et al., 1998; Mermilliod, 1981; Allen, 1973). For the solar age we have used Guenther’s work (1989), based on the age of the oldest meteorites.
All the stars observed with the VLT were chosen to be on the main sequence, high–probability members of the clusters and not known to be binaries at the moment of the observation. The choice was done using as references Nordström et al., (1996) for NGC 3680, Meibom et al., (2002) for IC4651 and several sources for M 67, including Latham et al., (1992) for the binary determination in this cluster. Our stars have colours comprised within 0.51 (BV) 0.73, closely encompassing the solar colour which, with some variations between different authors, is evaluated around BV=0.63 (see e.g. Straizis & Valiuga, 1994). We also note that the paucity of stars observed in NGC 3680 is imposed by the fact that, as shown by Nordström et al., (1997), this cluster has very few single G stars members left, most of its low mass members being dispersed in its lifetime.
As far as Praesepe is concerned, out of the 7 stars observed we chose 3 stars detected in X–ray by Randich & Schmitt, (1995) and 4 undetected, in order to check whether the chromospheric activity was different between the two groups, as expected if chromospheric and coronal activity were strongly correlated.
All the observed stars are summarized in Table 1. Star names are taken from Eggen, (1969) for NGC 3680, Anthony Twarog et al., (1988) and Eggen, (1971) for IC 4651, Sanders, (1977) for M 67, Klein Wassink, (1927) for Praesepe and van Bueren, (1952) for the Hyades stars. The photometry is taken from the reference papers for IC 4651, from Nordström et al., (1997) for NGC 3680, from Hipparcos Catalogue (ESA, 1997) for Hyades, from Jones & Stauffer, (1991) for Praesepe, with the exception of KW 368 which is taken from Jones & Cudworth, (1983), and from Montgomery et al., (1993) for M 67. For Hyades no correction at all for interstellar (IS) extinction is applied (Taylor & Joner, 2002), and NGC 3680 colours are given already dereddened by Nordström et al., (1997). BV colours of Praespe, M 67 and IC 4651 had to be corrected for colour excess. We used E(BV)=0.05 for M 67 (also taken from Montgomery et al., 1993), E(BV)=0.086 for IC 4651 (Anthony Twarog & Twarog, 1987) and E(BV)=0.02 for Praesepe (Taylor & Joner, 2002). The uncertainties in reddening are not at all critical for the analysis performed.
The photometric data retrieved from the literature are shown in the second and third columns of Table 1(V magnitude and BV colour index, respectively). The different chromospheric–activity indices are reported in Table 1 from the fourth to the sixth column and explained in the caption.
The quantity shown in the seventh Column is the Full Width Half Maximum (FWHM) of the cross correlation profile of the spectra. The cross correlation profiles were obtained as described in Melo et al., (2001): we used as template a box–shaped mask, suitable for solar–type stars, which was kindly provided by Claudio Melo. We processed the red part of the red arm UVES–spectra, all rebinned at the same step (0.0174087 Å). The 1 uncertainties of the FWHMs are of about .
The rotational velocities determined by us are given in the last column . They are obtained from the FWHMs via the calibrations of Section 3.2.
It is worth noticing that what really matters for the present purpose is the evolution of the angular momentum of the stars, we are therefore mostly interested in the differential values.
| STAR | V | (BV)0 | 1–Å index | 1–Å index | FWHM | ||
| non ISM corr | ISM corr | ISM corr | |||||
| [mag] | [mag] | Å | Å | 106 [ergcmsec-1] | [pixels] | [km/sec] | |
| PRAESEPE | |||||||
| KW 49 | 10.65 | 0.59 | 0.219 | 0.219 | 2.10 | 14.95 | 8.57 |
| KW 100 | 10.57 | 0.51 | 0.238 | 0.238 | 3.03 | 20.27 | 13.06 |
| KW 326 | 11.20 | 0.56 | 0.220 | 0.220 | 2.35 | 11.54 | 5.15 |
| KW 368 | 11.30 | 0.71 | 0.258 | 0.258 | 1.59 | 10.91 | 4.39 |
| KW 392 | 10.78 | 0.51 | 0.231 | 0.231 | 2.92 | 12.09 | 5.77 |
| KW 418 | 10.51 | 0.53 | 0.219 | 0.219 | 2.57 | 13.12 | 6.84 |
| HYADES | |||||||
| van Bueren 1 | 7.38 | 0.567 | 0.165 | 0.165 | 1.55 | 12.46 | 5.5 |
| van Bueren 2 | 7.78 | 0.617 | 0.208 | 0.208 | 1.78 | 12.65 | 5.5 |
| van Bueren 10 | 7.85 | 0.593 | 0.266 | 0.266 | 2.66 | 13.04 | 6.2 |
| van Bueren 15 | 8.05 | 0.657 | 0.293 | 0.293 | 2.34 | 12.60 | 5.4 |
| van Bueren 17 | 8.45 | 0.693 | 0.257 | 0.257 | 1.71 | 12.10 | 4.5 |
| van Bueren 18 | 8.05 | 0.640 | 0.279 | 0.279 | 2.36 | 12.46 | 5.4 |
| van Bueren 31 | 7.46 | 0.560 | 0.246 | 0.246 | 2.70 | 16.39 | 10.0 |
| van Bueren 49 | 8.22 | 0.599 | 0.192 | 0.192 | 1.71 | 11.28 | 2.8 |
| van Bueren 52 | 7.79 | 0.599 | 0.233 | 0.233 | 2.20 | 13.12 | 6.5 |
| van Bueren 65 | 7.41 | 0.537 | 0.187 | 0.187 | 2.04 | 15.42 | 8.8 |
| van Bueren 66 | 7.49 | 0.560 | 0.238 | 0.238 | 2.59 | 14.88 | 8.6 |
| van Bueren 73 | 7.83 | 0.609 | 0.255 | 0.255 | 2.38 | 13.35 | 6.8 |
| van Bueren 88 | 7.78 | 0.550 | 0.213 | 0.213 | 2.32 | 11.68 | 1.0 |
| van Bueren 97 | 7.90 | 0.631 | 0.264 | 0.264 | 2.28 | 12.70 | 5.4 |
| van Bueren 118 | 7.72 | 0.578 | 0.146 | 0.146 | 1.25 | 12.55 | 5.3 |
| IC 4651 | |||||||
| AMC 1109 | 14.534 | 0.599 | 0.093 | 0.102 | 0.63 | 10.20 | 3.39 |
| AMC 2207 | 14.527 | 0.595 | 0.073 | 0.085 | 0.44 | 10.03 | 3.11 |
| AMC 4220 | 14.955 | 0.695 | 0.113 | 0.133 | 0.68 | 9.96 | 2.99 |
| AMC 4226 | 14.645 | 0.624 | 0.079 | 0.093 | 0.48 | 9.78 | 2.67 |
| Eggen 45 | 14.27 | 0.53 | 0.068 | 0.074 | 0.37 | 10.26 | 3.48 |
| NGC 3680 | |||||||
| Eggen 60 | 14.290 | 0.641 | 0.090 | 0.095 | 0.47 | 9.88 | 2.85 |
| Eggen 70 | 14.589 | 0.651 | 0.075 | 0.084 | 0.34 | 10.49 | 3.82 |
| M 67 | |||||||
| Sanders 746 | 14.380 | 0.659 | 0.091 | 0.108 | 0.56 | 9.45 | 1.96 |
| Sanders 1012 | 14.516 | 0.687 | 0.116 | 0.133 | 0.71 | 9.66 | 2.43 |
| Sanders 1048 | 14.411 | 0.635 | 0.073 | 0.085 | 0.37 | 9.62 | 2.35 |
| Sanders 1092 | 13.308 | 0.581 | 0.074 | 0.088 | 0.50 | 10.99 | 4.49 |
| Sanders 1255 | 14.486 | 0.616 | 0.086 | 0.105 | 0.63 | 9.80 | 2.71 |
| Sanders 1283 | 14.115 | 0.590 | 0.067 | 0.082 | 0.41 | 10.25 | 3.46 |
| Sanders 1287 | 14.030 | 0.558 | 0.079 | 0.090 | 0.56 | 10.39 | 3.67 |
3 Analysis
3.1 Ca fluxes
The analysis is based on the measurement of flux in the emission core of the Ca K line. This line is the most sensitive indicator of chromospheric activity, and it has been widely studied in a number of different environments, including the Sun and solar stars (Linsky & Avrett, 1970; Linsky et al., 1979; Pasquini et al., 1988; Pasquini, 1992; White & Livingston, 1981).
In general, the most sensitive area is that comprised between the line K1 minima, but those are hardly seen in low activity stars or in intermediate S/N ratio spectra.
A very useful index of the level of chromospheric activity is the area of the 1–Å wide band centered in the line core (hereafter referred to as 1–Å index). This 1–Å band corresponds roughly to the separation between the K1 minima for an active star (as those in Hyades or Praesepe), and it is about 30 larger than the K1 minima separation for a star as active as the Sun (White & Livingston, 1981; Pasquini, 1992). The 1–Å index was measured in the spectra either uncorrected or corrected for IS absorption. The results are shown in the fourth and fifth column of Table 1 respectively. In addition, we recall that the is a measurement of a contrast between the chromospheric emission and the underlying photospheric flux. Several calibrations can be used to eliminate this offset and to quantify different bandwidths (Linsky et al., 1979); this is widely discussed (e.g. in Pasquini et al., 1988), and will not be repeated here.
In addition, although our clusters are among the closest and less reddened, the Ca lines could be contaminated by the IS Ca , a possibility that we have taken into account as explained later in this Section.
We summarize the different steps required to get the final fluxes from the observed spectra.
-
1.
Spectra normalization and rectification
-
2.
Subtraction of the IS line
-
3.
Index measurement
-
4.
Subtraction of the photospheric contribution
-
5.
Calibration in Fluxes
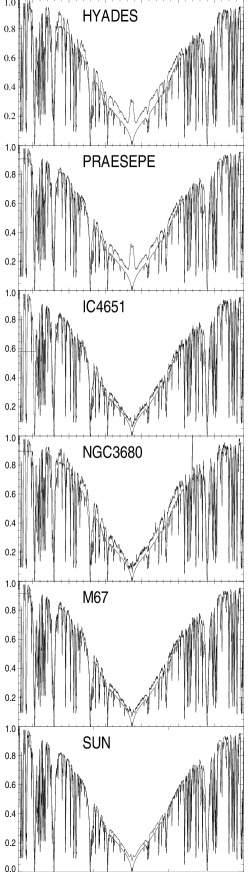
The observed spectra have been normalized to the 3950.5 Å pseudocontinuum, as done in Catalano, (1978) and then in Pasquini et al., (1988). Since the spectra are the result of a merging of different echelle orders, we must check that merging is properly made. We did it in two ways: by observing early–type stars (i.e. stars with no Ca K stellar line), and by comparing the target spectra with a synthetic solar spectrum (courtesy of P. Bonifacio). This comparison of observed with photospheric–line profiles has been largely used by us, not only to verify that the rectification of the spectra was properly done, but also to check that other effects, such as background light, were correctly taken into account. The K line is very suitable for this purpose, because it is very deep, and therefore sensitive to small mistakes in setting the zero flux level. In Figure 1 we show the average spectra of all the cluster stars and the solar one, all plotted over the synthetic solar Ca K stellar line. The solar spectrum is taken from the UVES archive 111http:www.eso.orgobservingdfoqualityUVESpipeline. We checked that the observed photospheric–line profiles successfully overlap after normalization. Of course this is only possible because all of the stars have similar colour to that of the Sun. We have also checked the consistency of each observed K line profile with the synthetic solar K line profile. The spectra of the single stars are shown in Figures 2 and 3.
 |
| [Å] |
| HYADES |
 |
| [Å] |
| PRAESEPE | |
 |
|
| IC 4651 | |
 |
|
 |
|
| NGC 3680 | |
 |
|
| M 67 | |
 |
|
 |
|
| [Å] |
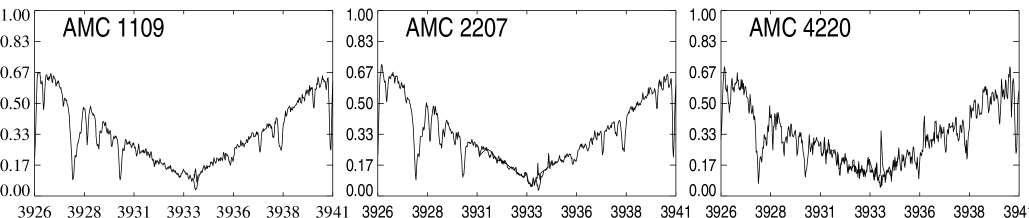
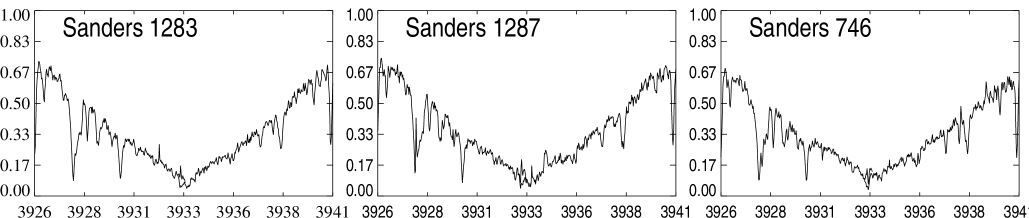
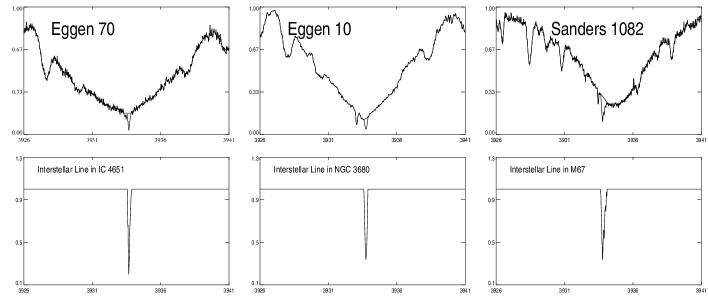
For all clusters only one component of the IS Ca K line falls in the stellar-spectra region where the 1–Å index is measured. In order to evaluate its contribution, we have observed for each of the 3 reddened clusters a reference star with an easily recognisable IS component. These stars show no narrow stellar line inside the Ca absorption feature either because they are fast rotators (as in the case of Sanders 1082 in M 67, an Algool–type binary, and Eggen 70 in IC 4651) or because they are hot enough (as in the case of Eggen 10 in NGC 3680) to present a pronounced broad deep core. In Figure 4, upper panels, the spectra of the quoted reference stars are shown. For each of them, the spectrum without the IS contribution is plotted over the original one. The latter has been divided by the former, and the result is the IS contribution, which is shown in the bottom panel of Figure 4.
Eggen 10 is quite hot, but this is not the case for Sanders 1082 and Eggen 70. If they were slightly active, their emission would partially fill in the absorption IS line. In this case, the IS negative contribution would be underestimated by the removal procedure. We are, however, confident that our estimate is quite robust, because Sanders 1082 and Eggen 70 are rather fast rotators, therefore if their chromospheric emission were relevant, they would be as broad as the photospheric lines and the emission wings would be visible outside the IS contribution.
Each K line spectrum of our target stars has been divided by the appropriate IS spectrum, and the 1–Å indices measured again. The results are given in the fourth column of Table 1. In Figure 5 we plot the vs. BV before and after the IS–line contribution has been subtracted (respectively left and right panels). Clearly the effect of this subtraction, although noticeable, does not affect dramatically the relative emission between the different clusters, which is not surprising, given the low reddening of the clusters.
Chromospheric fluxes decrease for cooler stars (see e.g. Soderblom et al., 1991). In Figure 5 such a trend is not present, with the possible exception of Praesepe stars. By comparing our plot with that of Soderblom et al., (1991, see Figure 6 therein), we do not expect our results to be significantly affected by the different colour distribution of the targets in the different clusters.
We have subtracted to the 1–Å indices the photospheric contribution, calculated on the synthetic photospheric–solar model. The quantity subtracted amounts to 0.049 Å. Note that, even though this subtraction is the same for all of the stars, once the 1–Å indices have been transformed into fluxes in the way explained later in this Section, the photospheric contribution becomes colour dependent, because the transformation into flux is colour dependent. The photospheric contribution we subtracted does not differ more than 20% from other approximations, e.g. the one used by Noyes et al., (1984), and Duncan et al., (1984). The choice of another approximation does not significantly change the result, even though it might affect the spread within each cluster.
 |
 |
We have derived the chromospheric fluxes at the stellar surface transforming the IS corrected, photospheric subtracted equivalent widths into flux densities at the stellar surface (erg sec cm-2). This was made in three steps. We first computed the VR colours from the BV ones. We used the calibration in Pasquini, (1985):
| (1) |
We have then used the calibration in Pasquini et al., (1988) between the VR colour and the flux at the stellar surface of the pseudo–continuum radiation at 3950.5 Å:
| (2) |
We have finally multiplied the equivalent widths for , obtaining the fluxes in the sixth Column of Table 1.
We need to estimate the absolute and relative accuracy of the indices and of the fluxes. Actually, the relative uncertainties are here the most relevant, since we will ultimately compare the ratio of the fluxes between the different clusters. The absolute value, although interesting, is just a normalised value for the purpose of the age–activity law.
The Signal to Noise per pixel is not the limiting factor of the accuracy, even though it is only of 10 in the spectra of the faintest stars, because we integrated on 1 Å, namely 48 pixels and 37 for HIRES spectra). For the intermediate age clusters and M 67, the dominant sources of error in the measurements could come from an incorrect treatment of the inter–order (and scattered) light or from rectification problems. As we have mentioned before, we think we are rather free from these problems, because of the satisfactory match between the solar synthetic and stellar observed profiles of the K line wings (i.e. the region between 3920 and 3950 Å, outside the line core). We have first divided the photospheric spectra of all the stars of each cluster for their average spectrum, finding peak to peak differences of less than 7% in their profile ratios. We have then repeated the same comparison with the solar synthetic spectrum; and the differences between the stellar spectra and the solar model are greater. They arrive up to 20 % for Hyades and Preasepe stars, while they are of up to about 10% for the other clusters. Hyades and Praesepe stars show exactly the same behaviour, despite the spectra were obtained with two different spectrographs. The stellar spectra have always higher profiles than the solar model and that is true even for the Sun itself (cfr. Figure 1). This can be due to a low level of residual scattered light in the spectrograph, but the main reason is that the solar model we used does not include any chromospheric effect, which will tend to heat the higher layers of the photosphere and therefore to raise the photospheric profiles as well. This effect is well known at least in the Sun, where the differences between the quiet and plage regions arise also in the photospheric wings of the K line (La Bonte, 1986, see Figure 1 therein).
Since the IS correction could be rather tricky, we have tried several different fits of the IS–line wings finding substantially only minor variations and we estimate the error from a wrong computation of the IS line as negligible. It is important to see also that this error is the same in both, absolute and relative terms and that the whole IS correction accounts for at most 20 of the chromospheric flux measured.
The errors in come from three main sources:
-
-
the uncertainty in the equivalent width measurement, which on its turn has, as mentioned, many other causes;
-
-
uncertainty in the V-R vs. B-V calibration;
-
-
the uncertainty in the B-V colours.
The absolute flux determination has an error of 30, due to the uncertainties in the vs. calibration. However this affects mainly the zero point of our measurements, and only to a much smaller extent the relative comparison.
The two other sources of error give a contribution to the relative uncertainty that can be calculated on the basis of Equations 1 and 2. They are, respectively:
and
The typical relative maximum error in the equivalent width measurement of the single spectrum is within 10%. For an error in the colour , which we adopt as value of the maximum error in the colour, the corresponding relative error in the flux is, depending on B-V, between the 12 and the 18%. If we add quadratically the two contributions, we finally obtain a maximum error in the single star measurement ranging from the 15 to the 20%, if only relative values are concerned.
3.2 Determination of the
As stated in Section 2, we have measured the FWHM of the cross correlation profile for all the spectra of our sample, and the data are shown in the seventh column of Table 1.
Line broadening, as extensively discussed e.g. in Gray, (1992), is caused by several effects – such as thermal motions, micro– and macro–turbulence, Stark effect, Zeeman effect, natural broadening, instrumental response and rotational velocity. We make two assumptions. The first is that the sum of these effects produces a gaussian shape, which is a reasonable assumption for solar–type stars (see e.g. Pasquini et al., 1988). The second is that the difference in broadening among the stars of our sample is due only to rotation, or that the quoted effects contribute equally to the line broadening for all the stars, which is well justified given the similarity in the spectral type of the targets. We can now write:
where is the the cross correlation profile, provided that it is a gaussian. For the reasons explained above, is expected not to change significantly from star to star, within our sample. Since and are proportional respectively to the FWHM of the cross correlation profile and to , we expect to be:
| (3) |
where and , like , are constants. Using measurements from the literature we can calibrate A and B in the previous relationship, and then calculate for all the stars. We have done this using the data of Table 2, in particular the measurements in the third Column and the FWHMs in the fourth Column.
Most of the spectra of the calibrators have been obtained in a parallel project on IC 4651 (Pasquini et al., 2003). The spectrum of the Sun is from the UVES archive, and is the same plotted in the bottom panel of Figure 1. For Eggen 60 we used the FWHM of Table 1, since it is one of the targets. All the spectra used for the calibration are taken with the same instrument (UVES) at the same resolution (R=100000) of our observations and the same spectral range is used to get the cross correlation profiles. The are taken from Meibom et al., (2002) for the stars in IC 4651 and from Nordström et al., (1996) for Eggen 60. For the Sun we adopted 2 Km/sec.
We decided not to use for the calibration Eggen 70 in NGC 3680, even though for this star is available. The reason is that the 1 error given for is three times larger than itself, that is 1 km/sec.
The calibration is a fit to the data of the Equation 3. The root mean square of the residuals of the data around the fitting curve is 0.26 km/sec, no star deviates more than of its , and 5 out of 8 calibration stars deviate less than .
We have used it to compute the values given in the eighth column of Table 1. We remind the eventual users that we used the spectral range 588–680 nm, a spectral resolution of R=100000, and a rebinning step of 0.0174 Å
We note that the small residuals from our –fit possibly overestimates its real accuracy. The reason is that our calibration is a secondary calibration, because also the calibrating measurements are based on the FWHM of the cross correlation profiles. The errors may be quite larger in particular below Km/sec, where other causes of line broadening become more important. We underline that we are mainly interested in differential values of , that are as reliable as the root mean square of our calibration indicates.
Only for Hyades stars we could not use this calibration, since their spectra were taken with another spectrograph (HIRES) at a different resolution. Anyway, all of the for our Hyades targets are measured in Paulson et al., (2003). In this work, the rotational velocities are determined by comparing five synthetic Fe lines with the observed ones, therefore temperature is taken into account. In Figure 7 we plotted the diagram vs. FWHM. As for the calibration of UVES spectra, we computed a fit of an equation of the type of Equation 3 to the data points. The result is that only one star deviates from the fit more than 5 % of its , and the median deviation is of the 2%. This proves that, for targets comprised in the short BV colour range 0.51-0.73, the FWHM is virtually completely determined by . The presence of an outlier, namely van Bueren 88, confirms that more care has to be exercised in dealing with slow rotators. We will not use the outlier value of in the analysis of the angular momentum evolution. On the other hand, the overall quality of the data is evident when comparing Paulson et al.’s values with equatorial velocities from rotational periods.
Radick et al., (1987) provide precise period determination of 5 of our targets. They used narrow band by photometry to obtain light curves of 24 Hyades members. From the light curves it is possible to obtain the rotational period of the stars because rotational modulation of photospheric features (spots) induces photometric variations. We transformed the periods into rotational velocities, and found the data in Table 3. We had to estimate the stellar radii, which were computed using Teff and computed bolometric luminosity. We transformed the BV colours into Teff and bolometric corrections using Flower, (1996), we then used Hipparcos parallaxes (ESA, 1997) to transform the apparent magnitudes into luminosities.
| STAR | Cluster | [km/sec] | FWHM [pixels] |
|---|---|---|---|
| AT 1228 | IC 4651 | 15.7 | 22.24 |
| Eggen 15 | IC 4651 | 10.0 | 16.65 |
| Eggen 34 | IC 4651 | 25.2 | 37.18 |
| Eggen 45 | IC 4651 | 4.2 | 10.27 |
| Eggen 79 | IC 4651 | 21.8 | 31.42 |
| Eggen 99 | IC 4651 | 28.1 | 40.45 |
| Eggen 60 | NGC 3680 | 1.9 | 9.89 |
| Sun | – | 2.0 | 9.41 |
| van Bueren | Period | inferred |
|---|---|---|
| id. | [days] | [km/sec] |
| 31 | 5.45 | 11.1 |
| 52 | 8.05 | 7.4 |
| 65 | 5.87 | 10.5 |
| 73 | 7.41 | 7.9 |
| 97 | 8.55 | 6.2 |
We overplotted the rotational velocities of Table 3 on the diagram in Figure 7. They are equatorial velocities, i.e. upper limits of the projected rotational velocity , which is the quantity really related to the FWHM of the cross correlation profile. On the other hand, the fact that rotational modulation is observed indicates that the inclination angle of stars cannot be too small. We therefore expect rotational velocities from period determinations to be right where they are: slightly above the projected rotational velocities.


4 Discussion
After showing in the previous sections that we were able to derive chromospheric fluxes and rotational velocities with great accuracy for our cluster stars, we can now proceed to the discussion of the results. We first investigate the spread in the level of chromospheric activity in each cluster, which will tell to which extent a single value can be used for each cluster. By comparing the couple of twin points we can then evaluate if chromospheric activity is a function of age for solar stars. Only after that we will be able to derive an age–activity relationship. Finally, the same is applied to rotational velocities.
4.1 Variability within each cluster
According to the detailed study of White & Livingston, (1981), the level of solar chromospheric activity varies of (from peak to peak) during the 11–years solar cycle. If we consider the data corrected for photospheric contribution, then the variation becomes of . Analog cycles take also place in solar–type stars (see e.g. Hempelmann et al., 1996; Radick et al., 1998; Baliunas et al., 1998). This poses some caution in deriving chromospheric ages from a single spectrum, and causes scatter around the mean chromospheric–activity levels observed in each cluster, i.e. at a given age.
Giampapa et al., (2000) have shown that indeed in the old M 67 considerable variations are observed if a sample large enough is acquired: they find that approximately 30 of the solar–type stars in M 67 exhibit levels of activity that are outside the envelope given by the solar–activity cycle.
| cluster | spread | stars |
|---|---|---|
| PRAESEPE | 59.3% | 6 |
| HYADES | 68.3% | 15 |
| IC 4651 | 60.2% | 5 |
| NGC 3680 | 31.2% | 2 |
| M 67 | 62.4% | 7 |
| SUN | 43.7% |
As shown in Table 4, all clusters but NGC 3680 (in which only two stars are observed) have a peak to peak spread slightly exceeding of the mean chromospheric–activity level. For young clusters such as the Hyades and Praesepe we expect that part of this variation is due to the superposition of long and short–term variability, the last induced by rotation. Another huge cause of chromospheric variability in young stars is flaring activity. For M 67, however, for which we expect the members to behave much like the Sun, the scatter is 1.4 times larger than the variations during a solar cycle. This means that an additional spread of 24 % has to be explained. For M 67, whose mean B-V colour is 0.62, the measurement maximum errors are of about the 18 %. This may indicate that cycles similar to the 11–years solar cycle do not fully account for the dispersion of the data, with interesting implications for the study of the Earth–Sun system. Admittedly, we have observed each star only once (three consecutive times the fainter stars), rather we assume that the stars in our sample have been observed at only one phase of their long–term activity, which is likely different from star to star. This implies, for instance, that possible star to star differences may cause additional noise to our results. We think, however, that our procedure of overlapping the photospheric profiles eliminates most of the observational uncertainties. Before inferring firm conclusions, more data have to be collected.
4.2 Hyades vs. Praesepe, IC 4651 vs. NGC 3680, M 67 vs. Sun
| STAR | |
|---|---|
| [ erg/sec] | |
| PRAESEPE | |
| KW 49 | non det. |
| KW 100 | 6 |
| KW 326 | 3.20 |
| KW 368 | 34 |
| KW 392 | 10 |
| KW 418 | non det. |
| HYADES | |
| van Bueren 1 | 3.7 |
| van Bueren 2 | 15.1 |
| van Bueren 10 | 5.8 |
| van Bueren 15 | 12.9 |
| van Bueren 17 | 11.6 |
| van Bueren 18 | 15.4 |
| van Bueren 31 | 11.6 |
| van Bueren 49 | 7.0 |
| van Bueren 52 | 10.8 |
| van Bueren 65 | 10.7 |
| van Bueren 66 | 17.1 |
| van Bueren 73 | 11.2 |
| van Bueren 88 | – |
| van Bueren 97 | 7.7 |
| van Bueren 118 | 5.3 |

The Hyades and Praesepe clusters are particularly relevant because they have been studied also in the X–ray (Randich & Schmitt, 1995). It is at least reasonable to reckon that the X–ray emission (i.e. coronal activity) and the chromospheric activity are not completely independent, since they are both related to rotation and magnetic field (see e.g. Bruevich et al., 2001, and references therein), but in Randich & Schmitt, (1995) the two coeval clusters were found to have substantially different levels of X–ray emission (Randich & Schmitt, 1995). This early result has been recently revised by Franciosini et al., (2003), who find that Praesepe stars have the same level of X–ray activity of Hyades if the central field is considered.
Our data confirm that Praesepe and Hyades stars span the same ranges of chromospheric–activity levels and values, even though our Praesepe stars have a mean X–ray luminosity significantly lower than the Hyades ones (less than a half).
In Figure 8 the vs. (right panel) and the vs. diagram (left panel) are shown for both clusters. measurements are taken from from Stern et al., (1995) for the Hyades, and Randich & Schmitt, (1995) for Praesepe members, but KW 326, which is given in Franciosini et al., (2003)
In both panels the spread is high and no real relationship is observed. In spite of the aforementioned possible discrepancy between X–ray emission and chromospheric activity, a significant correlation likely exists. The fact that it is not seen in Figure 8 could be due to the activity variability, since the optical and X–ray observations are not simultaneous.
When focusing on the other coeval clusters we notice in Table 1 that the activity and rotation values for IC 4651 and NGC 3680 are, as in the in the case of Praesepe and Hyades, indistinguishable. We have to remind the reader that only two stars were observed in NGC 3680, therefore its average chromospheric–activity and rotation levels cannot be considered accurate. Nevertheless it is very significant that both NGC 3680 stars have values similar to those of IC 4651. This result is particularly important because, as we shall see in the following, these clusters show a novel behaviour with respect of what thought so far.
Finally, given the excellent agreement between the mean M 67 activity values and the Sun, we can conclude that all our coeval points show very consistent average values, therefore the level of chromospheric activity is an age driven parameter.
The for M 67 is slightly larger than the solar one ( 3 km/sec, see Section 3.2); we do not consider this at the moment as a significant discrepancy, but it would be interesting to verify that M 67 cluster stars rotates indeed slightly faster than the Sun.
4.3 The age–activity–rotation relationship.
When the stars of about 1 M⊙ reach the ZAMS, they show a high dispersion in rotational velocity, and therefore in chromospheric–activity levels, as a result of their different Pre Main Sequence histories (see e.g. Bouvier, 1997). But at 600 Myr, i.e. the youngest age we are dealing with in the present study, the magnetic braking mechanism already made the rotational velocity uniform. So, for each of our clusters, rotational velocity and chromospheric activity are expected to be all of the same order of magnitude (see Section 4.1). The evolution of these quantities, as it results from our data, is shown respectively in the two panels of Figure 9. It is very important to bear in mind that in this Figure the bars are not error bars, but they represent the peak to peak spread within the clusters, i.e., the difference between the maximum and the minimum cluster values, and the points are the mean values.
As expected, chromospheric activity and rotation show the same decaying trend. Surprisingly, however, the intermediate age clusters IC 4651 and NGC 3680 have the same level of activity and rotation as the older M 67 and the Sun. We recall that this two data points are based on measurements of 7 stars, two in NGC 3680 and 5 in IC 4651, none of which shows a chromospheric activity above the most active star in M 67, that is to say that the activity distribution of the 7 intermediate age stars and that of the 7 M 67 stars are virtually equal.

This means that an abrupt decay of chromospheric activity occurs between Hyades’ age and 1.5 Gyr, after which a very slow decline follows, if any. Three power law decay laws are plotted over the data points of Figure 9: the two more gentle slopes represent the and laws proposed respectively by Skumanich, (1972) and Soderblom et al., (1991), scaled to best match our data points.
The intermediate age clusters are clearly not consistent with any of the laws so far suggested; they have an activity level lower more than a factor 2. If the exponent of the power law is left as a free parameter, we find that the points are best fitted by the third curve plotted on the vs. age diagram, namely , where is in unit of 10ergcmsec-1, and the age is expressed in Gyr. Note that neither a different zero point, nor different assumptions on the age of the clusters would change our conclusion, since activity keeps constant for a time interval, the one between the intermediate age clusters and M 67, that under no acceptable assumptions can be shorter than 2 Gyr. Similar results are also claimed by Rodrigues et al., (2003).
Figure 9 recalls what observed among field stars: the so called Vaughan–Preston gap, i.e. the lack of nearby stars with a level of chromospheric activity intermediate between Hyades’ and the Sun (Vaughan & Preston, 1980). With our results this gap gets a quite natural explanation: the decline in activity is so abrupt to be almost a discontinuity, and only stars with ages in the range between 0.6–1.5 Gyr may fall in it.
As mentioned above, the previous most systematic attempt to study chromospheric activity in stars belonging to open clusters has been made by Barry et al., (1987), who obtained results quite different from ours. Some major discrepancy may exist in the measurement of the activity index. For instance, in Barry et al., (1987), the ratio between the chromospheric fluxes in the Hyades and in M 67 stars or in the Sun, is only , while for us is larger than 4. We find a similar ratio ( 2.4) if our index includes the photospheric contribution which represent a fraction of the 1–Å index much larger for M 67 than for Hyades stars. In Figure 9 the difference between ours and Barry et al.’s data is apparent. Given the large scatter of fluxes observed in each cluster, we cannot, however, exclude that the discrepancy is due to differences in the sample observed. We tend to consider this possibility unlikely, considering the large number of stars observed. Barry et al. have observed 13 stars in the Hyades and 16 in M 67 and we have observed 15 stars in Hyades and 7 in M 67. These authors measure also a chromospheric–activity index for the intermediate age cluster NGC 752 only 1.4 times lower than the Hyades and 1.5 times bigger than M 67; this would imply a level of chromospheric activity in the middle between the Hyades and the old stars plateau, right in the Vaughan–Preston gap. Carraro & Chiosi, (1994), so far used as age reference, evaluate the age of NGC 752 comparable, but slightly younger than IC 4651 (1.5 vs. 1.6 Gyr).
Before going into speculations about the difference between our and Barry et al.’s results, the NGC 752 chromospheric–activity level should be proven by means of high–resolution spectroscopy in solar analogs.
4.4 The impact of our results on the determination of ages and on the age of galactic population

According to the picture we have drawn in the last Section, stars can be divided in three groups on the basis of their chromospheric–activity levels:
-
-
the youngest stars, with erg cm-2 sec-1
-
-
the stars with between 0.7 and 1.2 erg cm-2 sec-1
-
-
the oldest stars, with erg cm-2 sec-1
Among our target stars, those in Praesepe and Hyades belong the first group, all the others to the third one. Let us call the upper age limit of the first ensemble and the lower age limit of second . We don’t know the exact values of and . We only know that 0.6 Gyr Gyr.
In Figure 10 we plot the histogram for 44 solar–type stars (spectral type between G0 and G5) in the solar neighborhood taken from Pasquini, (1992). The numbers of stars belonging to each group are respectively: 8, 2 and 34. The result confirms what expected: most of the stars have an age older than , much less are younger than , only have ages between and , i.e. those in the Vaughan–Preston gap. In addition, the standard deviation of the values of the 34 less active stars in the sample of Pasquini, (1992) is very similar to that of the 14 targets belonging to the three intermediate age and old clusters IC 4651, NGC 3680 and M 67: 0.12 erg cm-2 sec-1. Unfortunately our results indicate that an accurate age determination based on chromospheric activity may not be obtained for stars older than 1.5 Gyr. Once and are determined precisely, much could be said about the recent Star Formation History in the solar neighborhood, provided that initial conditions do not dominate the fast decline of chromospheric activity occurring between and .
5 Conclusions
We have studied the evolution of chromospheric activity and rotation in solar–type stars by analysing VLT and KECK high–resolution spectra of 35 stars belonging to 5 open clusters and published solar data. As a measure of chromospheric activity we have used , i.e. the equivalent width of the Ca K line emission core corrected for photospheric contribution and transformed into flux at the stellar surface. Our data set can be divided in three age bins: 6 Praesepe stars and 15 Hyades stars at 0.6 Gyr; 5 IC 4651 stars and 2 stars in NGC 3680, at about 1.7 Gyr; and finally 7 M 67 stars and the Sun, at about 4.5 Gyr. We undertook the present research mainly to ascertain a decay law which allows measuring chromospheric ages in field stars. We have found that stars within each age bin show indeed the same mean level of chromospheric activity, confirming that it is possible to search for a chromospheric activity–age relationship. Stars in the youngest bin have chromospheric fluxes ranging between 1.2 and 2.8 106 erg cm-2 sec-1. All the other stars have values ranging between 0.3 and 0.7 106 erg cm-2 sec-1. The most important result is that there is no difference in the distribution of chromospheric–activity levels between the intermediate and the oldest age bin, even though difference of ages of the two bins is as large as 3 Gyr. We obtain a very similar conclusion about the angular momentum evolution, with the only difference that the gap between the youngest bin and the others is less pronounced. A fast decay of chromospheric activity occurs roughly between 0.6 and 1.5 Gyr of Main Sequence lifetime, after which a kind of plateau appears.
No power law so far proposed can fit our data. The best match curve we computed, namely , where is in unit of 10ergcmsec-1, and the age is expressed in Gyr, can reproduce this trend.
Coupling this trend with the observational fact that in each of the clusters observed the star to star activity level vary almost by a factor 2, our results indicate that the determination of chromospheric ages for field stars older than 1.5 Gyr is extremely challenging, or even potentially misleading in particular if only one or a few activity measurements are available.
Acknowledgements.
We are greatly indebted to Bill Cochran, Artie Hatzes and Diane Paulson, for making available the HIRES spectra of Hyades’ stars, to Piercarlo Bonifacio, for computing the synthetic Ca solar spectrum, and to Claudio Melo, for sharing the code and the digital mask for the computation of the cross correlation profiles. This paper took advantage of the useful comments of Diane Paulson and of the impressive work of the referee, Dr. Messina. We also thank Nick Pettefar for the careful reading of the manuscript.References
- Allen, (1973) Allen, C.W., 1973, Astrophysical Quantities (The Athlon Press)
- Anthony Twarog & Twarog, (1987) Anthony Twarog, B., & Twarog, B. A. 1987, AJ 94, 1222
- Anthony Twarog et al., (1988) Anthony Twarog, B., Mukherjee, K., Caldwell, N., & Twarog, B. A. 1988, AJ 95, 1453
- Ballester et al., (2000) Ballester, P., Modigliani, A., Boitquin, O., Cristiani, S., Hanuschik, R., Kaufer, A., Wolf, S., 2000 ESO Mess. 101, 31
- Baliunas et al., (1998) Baliunas, S.L., Donahue, R.A., Soon, W., & Henry, G.H. 1998, ASP Conference Series 154, 153
- Barrado y Navascues et al., (1997) Barrado y Navascues, D., Stauffer, J.R., & Randich, S. 1997, MmSAI 68, 985
- Barry et al., (1987) Barry, D.C., Cromwell, R. H., & Hege, E. K. 1987, ApJ 315, 264
- Benz & Mayor, (1981) Benz, W., & Mayor, M. 1981, A&A 93, 235
- Blanco et al., (1974) Blanco, Catalano, Marilli, & Rodonó 1974, A&A 33, 257
- Bouvier, (1997) Bouvier, J. 1997, Mem.S.A.It. 68, 881
- Bruevich et al., (2001) Bruevich, A.E., Katsova, M.M., & Sokolov, D.D. 2001, Astronomy Reports 45, 718
- Carraro & Chiosi, (1994) Carraro, G., & Chiosi, C. 1994, A&A 287, 761
- Carraro et al., (1996) Carraro, G., Girardi, L., Bressan, A., & Chiosi, C. 1996, A&A 305, 849
- Catalano, (1978) Catalano, S. 1978, A&A 80, 317
- Cochran et al., (2002) Cochran, William D.; Hatzes, A. P.; Paulson, Diane B. 2002, AJ 124, 565
- Dekker et al., (2000) Dekker, H., D’Odorico, S., Kaufer, A., Delabre, B., & Kotzlowski, H. 2000, SPIE 4008, 534
- Duncan et al., (1984) Duncan, D.K., Baliunas, S.L., Noyes, R.W., Vaughan, A.H., Frazer, J., & Lanning, H.H. 1984, PASP 96, 707
- Dupree et al., (1999) Dupree, A.K., Whitney, B.A., & Pasquini, L. 1999, ApJ 520, 751
- Eggen, (1969) Eggen, O.J. 1969, ApJ 155, 439
- Eggen, (1971) Eggen, O.J. 1971, ApJ 166, 87
- ESA, (1997) ESA, 1997, The Hipparcos and Tycho Catalogues, ESA SP–1200
- Flower, (1996) Flower, P.J. 1996, ApJ 469, 355
- Franciosini et al., (2003) Franciosini, E., Randich, S., & Pallavicini, R. 2003, A&A 405, 551
- Giampapa et al., (2000) Giampapa, M. S., Radick, R. R., Hall, J. C., & Baliunas, S. L. 2000, American Astronomical Society, SPD meeting 32, 02/12/2000
- Gray, (1992) Gray, D.F. 1992, The observation and analysis of stellar photospheres (Cambridge Astrophphysics Series)
- Guenther, (1989) Guenther, D.B. 1989, ApJ 339, 1156
- Hempelmann et al., (1996) Hempelmann, A., Scmhmitt, J.H.M.M., & Stẹpien, K. 1996, A&A 305, 284
- Henry et al., (1996) Henry, T.J., Soderblom, D.R., Donahue, R.A., & Baliunas, S.L. 1996, AJ 11, 439
- Jones & Cudworth, (1983) Jones, B.F., & Cudworth, K. 1983, AJ 88, 215
- Jones & Stauffer, (1991) Jones, B.F., & Stauffer, J.R. 1991, AJ 102, 1080
- Klein Wassink, (1927) Klein Wassink, W.J. 1927, Publ. Kapteyn Astron. Lab. Groningen 41, 1
- La Bonte, (1986) La Bonte, B.J. 1986, ApJSS 62, 229
- Latham et al., (1992) Latham, D. W., Mathieu, R. D., Milone, A. A. E., & Davis, R. J. 1992, IAUS 151, 471
- Linsky & Ayres, (1978) Linsky, J. L., & Ayres, T. R. 1978, ApJ 220, 619
- Linsky & Avrett, (1970) Linsky, J.L., & Avrett, E.H. 1970, PASP 82, 169
- Linsky et al., (1979) Linsky, J.L., McClintock, W., Robertson, R.M., & Worden, S.P. 1979, ApJS 41, 47
- Meibom et al., (2002) Meibom, S., Andersen, J., & Nordström, B. 2002, A&A 386, 187
- Melo et al., (2001) Melo, C., Pasquini, L., & De Medeiros, J.R. 2001, A&A 375, 851
- Mermilliod, (1981) Mermilliod, J.C. 1981, A&A 97, 235
- Montgomery et al., (1993) Montgomery, K.A., Marschall, L.A., & Janes, K.A. 1993, AJ 106, 181
- Nordström et al., (1996) Nordström, B., Andersen, J., & Andersen, M.I. 1996, A&AS 118, 407
- Nordström et al., (1997) Nordström, B., Andersen, J., & Andersen, M.I. 1997, A&A 322, 460
- Noyes et al., (1984) Noyes, R.W., Hartmann, S., Baliunas, S.L., Duncan, D.K., & Vaughan, A.H. 1984, ApJ 279, 763
- Parker, (1970) Parker, E.N. 1970, ARA&A 8, 1
- Pasquini, (1985) Pasquini, L. 1985, PHD thesis.
- Pasquini et al., (1988) Pasquini, L., Pallavicini, R., & Pakull, M. 1988, A&A 191, 253
- Pasquini et al., (1990) Pasquini, L., Brocato, E., & Pallavicini, R. 1990, A&A 234, 277
- Pasquini, (1992) Pasquini, L. 1992, A&A 266, 347
- Pasquini et al., (2003) Pasquini, L., Randich, S., Zoccali, M., Hill, V., Charbonnel., C., Nordström, B. 2003, Detailed Chemical composistion of the open Cluster IC 4651: Metals, elements and Li, in preparation.
- Paulson et al., (2002) Paulson, D. B., Saar, S. H., Cochran, W. D., & Hatzes, A. 2002, ApJ 124, 572
- Paulson et al., (2003) Paulson, D. B., Snenden, C., & Cochran, W. D. 2003, AJ 125, 3185
- Perryman et al., (1998) Perryman, M.A.C., et al., 1998, A&A 331, 81
- Radick et al., (1987) Radick, R. R., Thompson, D.T., Lockwood, G.W., Duncan, D.K., & Baggett, W.E. 1987, ApJ 321, 459
- Radick et al., (1998) Radick, R. R., Lockwood, G.W., Stiff, B.A., & Baliunas, S.L. 1998, ApJSS 118, 239
- Randich & Schmitt, (1995) Randich, S., & Scmhmitt, J.H.M.M. 1995, A&A 298, 115
- (56) Rocha Pinto, H.J., Scalo, J., Maciel, W.J., & Flynn, C. 2000, A&A 358, 850 (I)
- (57) Rocha Pinto, H.J., Scalo, J., Maciel, W.J., & Flynn, C. 2000, A&A 358, 869 (II)
- Rodrigues et al., (2003) Rodrigues, G. R. K., Lyra, W., & Porto de Mello, G. F. 2003, Boletim da Sociedade Astronomica Brasileira, 23, 131
- Sanders, (1977) Sanders, W.L. 1977, A&AS 27, 89
- Skumanich, (1972) Skumanich, A. 1972, ApJ 171, 565
- Soderblom et al., (1991) Soderblom, D.R., Duncan, D.K., & Johnson, D.R.H. 1991, ApJ 375, 722
- Stern et al., (1995) Stern, R.A., Schmitt, J.H.M.M., & Kahabka, P.T. 1995, ApJ 448, 683
- Straizis & Valiuga, (1994) Straizis, V., & Valiuga, G. 1994, BaltA 3, 282
- Strassmeier et al., (2000) Strassmeier, K.G., Washuettl, A., Granzer, T., Scheck, M., & Weber, M. 2000, A&AS, 142, 275
- Taylor & Joner, (2002) Taylor, B. J.& Joner, M. D. 2002, AAS 200, 902
- van Bueren, (1952) van Bueren, H.G. 1952, Bull. Astron. Inst. Netherlands, 11, 385
- van den Bergh & McClure, (1980) van den Bergh, S., McClure, R.D. 1980, A&A 88, 360
- Vaughan & Preston, (1980) Vaughan, A.H., & Preston, G.W. 1980, PASP 92, 385
- White & Livingston, (1981) White, O.R., & Livingston, W. C. 1981, ApJ 249, 798
- Wilson, (1963) Wilson, O.C. 1963, ApJ 138, 832