A thin ring model for the OH megamaser in IIIZw35
Abstract
We present a model for the OH megamaser emission in the starburst galaxy IIIZw35. The observed diffuse and compact OH maser components in this source are explained by a single phase of unsaturated clumpy gas distributed in a thin ring structure and amplifying background continuum. We emphasize the importance of clumpiness in the OH masing medium, an effect that has not been fully appreciated previously.
The model explains why multiple bright spots are seen only at the ring tangents while smoother emission is found elsewhere. Both the observed velocity gradients and the line to continuum ratios around the ring enquire a geometry where most of the seed photons come from a continuum emission which lies outside the OH ring. To explain both the OH and continuum brightness, free-free absorbing gas is required along the ring axis to partially absorb the far side of the ring. It is proposed that the required geometry arises from an inwardly propagating ring of starburst activity.
keywords:
starburst, maserguessConjecture {article}
1 Introduction
Extragalactic OH megamasers usually present both extended diffuse emission and very compact and strong features. One of the clearest cases of an OH megamaser showing both compact and diffuse masers is IIIZw35. Two groups of compact masers were detected in VLBI (Trotter et al. 1998; Diamond et al. 1989) recovering nearly half of the total emission seen at MERLIN scales (Montgomery and Cohen 1992). Aiming to determine the location of the missing diffuse component MERLIN+EVN observations were conducted on this source (Pihlström et al. 2001). These observations revealed the best example of a rotating OH maser ring that has yet been found.
It has been claimed that the two-phase characteristic of the maser features observed toward IIIZw35 is due to two coexisting phases of the OH gas (Diamond et al. 1989), one producing the smooth emission and the other responsible for the very strong and compact features. According to this hypothesis, and making the usual assumption that the diffuse component maser is operating in the unsaturated regime, the Line to Continuum Ratio (LCR) of each phase is exponentially related to the path length through the amplifying gas. In the particular case of the smooth component in IIIZw35, the LCR in the east/west and north/south regions has been observed to be around 10 and 1000 respectively. Additionally, the ratio of the path lengths between these regions is estimated to be approximately 8 therefore, the ratio of their LCRs should be in the order of . Instead in order to match the observations, a clumpy medium is proposed so the column density of amplifying gas is proportional to the number of overlapped clumps along the line of sight. This number is the result of a random process that yields a mean which is linearly related to the projected path length through the gas.
2 Description of the model
2.1 Geometry
We propose that the conditions for the OH gas to produce maser amplification are satisfied within a thin ring structure with inner and outer radii Ri and Ro. Surrounding the OH, there is another concentric thin ring of radius Rc where most of the continuum emission is produced. In addition, free-free absorption cones along the axis are assumed to account for the east-west asymmetry in the brightness distribution. This situation is depicted in Figure 1 and the observed geometrical parameters are summarized in Table 1.
| Parameter | Value | Reference |
|---|---|---|
| R | 3 Pc | Diamond et al. 1998; Trotter et al. 1989 |
| H | 6 Pc | Diamond et al. 1998; Trotter et al. 1989 |
| Ri | 22 Pc | Trotter et al. 1989 |
| Ro | 25 Pc | Pihlström et al. 2001 |
| Rc | 50 Pc | Pihlström et al. 2001 |
| 60 Deg | Pihlström et al. 2001 |
The fact that the northern and southern compact masers seem to be elongated toward the east (Diamond et al. 1998; Trotter et al. 1989) is explained in our model by the larger amount of continuum behind the OH in these regions. Accordingly, the apparent east-west extention of the feature corresponds to half of the ring width H whereas the north-south extention matches the difference between the outer and inner radii R. The angle between the axis of symmetry of the disk and the direction of the observer is estimated from the aspect ratio of the projected ring (Pihlström et al. 2001).
2.2 Clumpy medium analysis
The clumpiness of the medium is defined by the parameter which defines the average number of clumps per cloud velocity width found in the radial direction within the ring. The average number of clumps in the direction of the observer is given by where is the projected path length through the OH gas. For any given line of sight, the number of observed spatial overlappings per velocity range is drawn from a Poisson random process of parameter with Probability Mass Function . If all the clumps have the same optical depth , then the expected amplification along the line is given by the sum:
| (1) |
which in the limit of converges to (See Conway et al. in this volume). This result is inappropriate in our context since the maximum number of aligned clumps is upper bounded either by geometrical or statistical constrains. For these reasons, the mean does not constitute a good estimator for the observations. A better choice could be to use the median instead. A simplified approximation is to define an expected maximum in order to truncate the sum in (1). Given a set of independent realizations of the process, corresponding to independent lines of sight within the beam, and requiring at least one occurrence of overlaps to be observed, the expression for the maximum becomes:
| (2) |
Where is the Inverse Poisson Cumulative Distribution of parameter , and is given by the ratio of the areas of the EVN+MERLIN to the VLBI synthesized beams when the clumps are assumed to be just resolved at the latter resolution. For the proposed geometry we define the following quantities and their observed values:
Where and are the maximum number of cloud overlaps in regions 1 and 2 given by (2) and with being the ratio of the averaged path lengths within both regions. Each of these equations define a locus in the plane where the observed values are matched. The intersection of those loci corresponds to the possible combinations of and satisfying all three conditions simultaneously. Solving numerically, the solution is found to be and which corresponds with a mean free path between clumps pc.
3 Simulations
Using the parameters obtained in the previous section as input for Monte Carlo simulations, artificial spectra and brightness distributions were produced. Random generators were set up to reproduce the spatial distribution of the individual clumps and the pseudo-turbulent velocity field. The resulting XYZ cube was transformed into a XYV cube using the cascade model shown in Figure 3. The results are summarized in Figures 4 and 5.

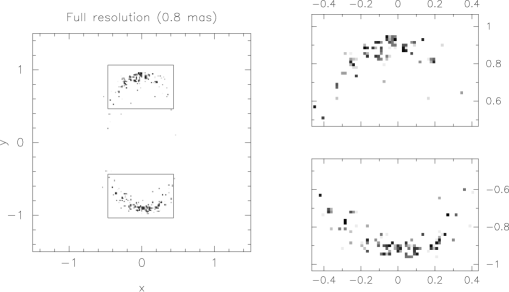
4 Conclusions
The proposed geometry has managed to reproduce the observed brightness distribution and spectrum of the OH maser emission. The analytical approach in section 2 has been useful in fine tuning the Monte Carlo simulations. However, some aspects of the observed velocity field need to be studied. Work is still in progress connecting the obtained results with the physics of masers and the developing of a consistent formalism for the analysis of clumpy media.
References
- [1999] Diamond P.J., Lonsdale C.J., Lonsdale C.J. & Smith H.E., 1999, ApJ, 511, 178
- [2003] Klöckner H.R., Baan W.A., & Garrett M.A., 2003, Nature, 421, 821
- [1992] Martin H.M., Sanders D.B. & Hills R.E., 1984, MNRAS, 208, 35
- [1992] Montgomery A.S. & Cohen R.J., 1992, MNRAS, 254, 23
- [2003] Rovilos E., Diamond P.J., Lonsdale C.J., C.J. Lonsdale & Smith H.E., 2003, MNRAS, 342, 373
- [2001] Pihlström Y.M., Conway J.E., Booth R.S, Diamond P.J., & Polatidis A.G., 2001, A&A, 377, 413
- [1997] Trotter A.S., Moran J.M., Greenhill L.J., Zheng X. & Gwinn C.R., 1997, ApJ, 485, L79