Chandra X-ray Observations of Galaxy Cluster A168
Abstract
We present Chandra X-ray observations of galaxy cluster A168 (). Two X-ray peaks with a projected distance of 676 kpc are found to be located close to two dominant galaxies, respectively. Both peaks are significantly offset from the peak of the number density distribution of galaxies. This suggests that A168 consists of two subclusters, a northern subcluster (A168N) and a southern subcluster (A168S). Further X-ray imaging analysis reveals that (1) the X-ray isophotes surrounding the two X-ray peaks are heavily distorted, (2) an elongated and continuous filament connects the two X-ray peaks. These suggest that strong interactions have occurred between the two subclusters. Spectral analysis shows that A168 has a mean temperature of keV and a mean metallicity of . The metallicity is roughly a constant across the cluster but the temperature shows some systematic variations. Most X-ray, optical and radio properties of A168 are consistent with it being an off-axis merger several Gyrs after a core passage, although detailed numerical simulations are required to see whether the observed properties, in particular the significant offset between the optical and X-ray centers, can be reproduced in such a scenario.
1 INTRODUCTION
Merging of galaxy clusters is key to our understanding of the formation and evolution of not only the clusters themselves (Fabian et al., 2000; Sun et al., 2002; Fabian et al., 2003), but also their member galaxies in the dense and violent cluster environment (Mihos, 2004). Such merging processes can dissipate a vast amount of kinetic energy ( erg) via different physical processes, such as heating the gas, generating intense radio and X-ray radiations (Markevitch & Vikhlinin, 2001), and producing relativistic particles and magnetic fields (Vikhlinin, Markevitch, & Murray, 2001; Gabici & Blasi, 2003). X-ray is a unique band for studying clusters of galaxies, especially during mergers, because X-ray studies directly probe the hot intracluster medium and hence the dynamical properties of clusters of galaxies (Markevitch et al., 2002; Roettiger, Loken, & Burns, 1997; Roettiger, Stone, & Burns, 1999; Bekki, 1999; Ricker & Sarazin, 2001). X-ray is hence a powerful tool for studying the formation and evolution of galaxy clusters.
In the present paper, we report the analysis of Chandra observations of A168 which is located at J2000.0 (Yang et al., 2004, Paper I hereafter) with type of IIIII (Bautz & Morgan, 1970). Two decades ago, A168 was observed by Einstein IPC, and two X-ray peaks were reported (Tomita et al., 1996). Ulmer, Wirth, & Kowalski (1992) reported an unusual offset between the optical center and the X-ray center as observed by Einstein. They suggested that A168 was formed by the collision of two approximately equal size subclusters. Based on optical observations, In Paper I we found that the elongated shape of the X-ray emission is consistent with the spatial distribution of member galaxies. We also suggested that A168 possibly consist of two subclusters, a northern subcluster (A168N) and a southern subcluster (A168S), based on evidence from the velocity information and the luminosity function of galaxies in the cluster. In this paper, we will use Chandra observations to study A168. The Chandra data allows us to study this cluster in un-precedented details and for the first time enables us to separate clearly the emission from point sources and the diffuse hot gas. Throughout this paper, we assume a cosmology with a matter density parameter , a cosmological constant , and a Hubble constant . In this cosmology, the cluster has a luminosity distance and one arcsecond corresponds to . All error ranges in this paper are quoted at the 90% confidence level.
2 OBSERVATIONS AND DATA REDUCTION
A168 was observed twice by Chandra with the Advanced CCD Imaging Spectrometer (ACIS-I). The first observation, called A168_OFFSET1 (OF1), started on 2002 January 5. OF1 was centered on (J2000.0) with an exposure time of 41.12 ks. The second observation (A168_OFFSET2, hereafter OF2), centered on , was performed on November 1 in the same year with an exposure time of 38.11 ks. Both observations were telemetered in the VFAINT mode. Following the standard steps we processed the raw data with Chandra Interactive Analysis of Observations (CIAO, v3.0) and Calibration Database (CALDB, v2.23)111CIAO and CALDB can be found at website of http://cxc.harvard.edu..
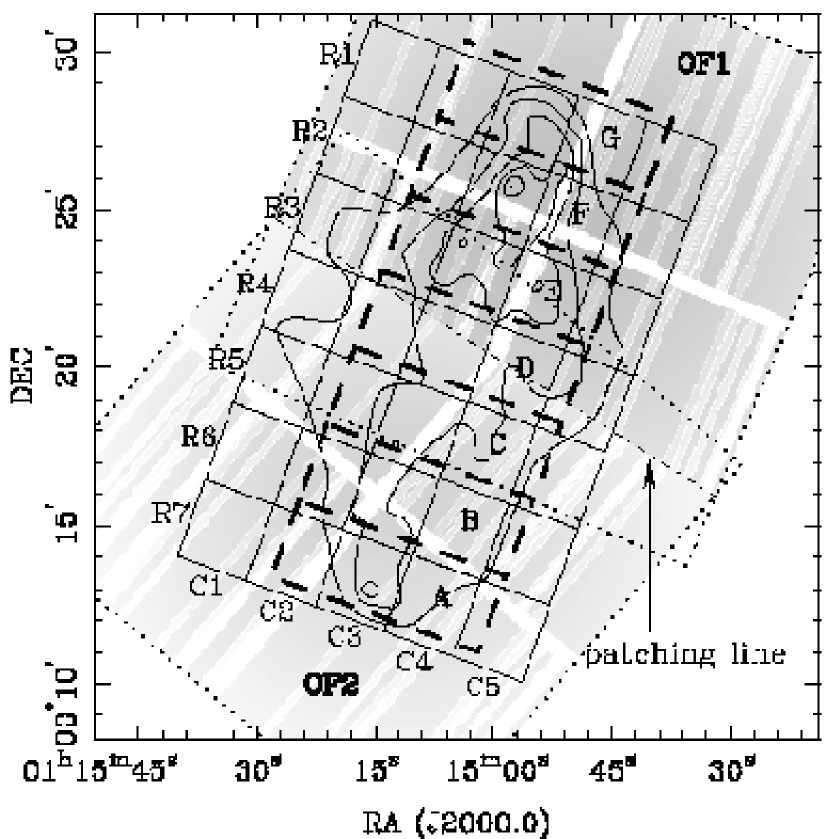
The data reduction for the Chandra observations of A168 offers some challenges. First, A168 is a faint and extended source with an angular size of at least 12, occupying almost the whole CCD. It is hard to find a clean area to determine the background reliably. Accordingly, we have to take the blank-sky (Markevitch, Vikhlinin, & Mazzotta, 2001; Markevitch et al., 2003), as the background in the spectral analysis. We also corrected for the degradation of the low energy quantum efficiency which is particularly pronounced at energies below 1 keV. Second, there is an overlap region between OF1 and OF2. It is easy to analyze the spectra in this region by extracting the spectra separately and fitting them simultaneously. However, we found from experimenting that it is not straightforward to add the images of the two observations together without creating some artifacts. We finally decided to take a simpler approach by considering only one observation in the overlap region. We then correct the exposure map for the two pointings and combine them to obtain the final image (see Figure 1). Third, because A168 is faint and extended in the X-ray, the photon noise is high at the full resolution of Chandra. Therefore we binned the image in ( by ) pixels. The binned image is then cropped to a smaller area with an effective size of pixels.
3 RESULTS
3.1 Imaging
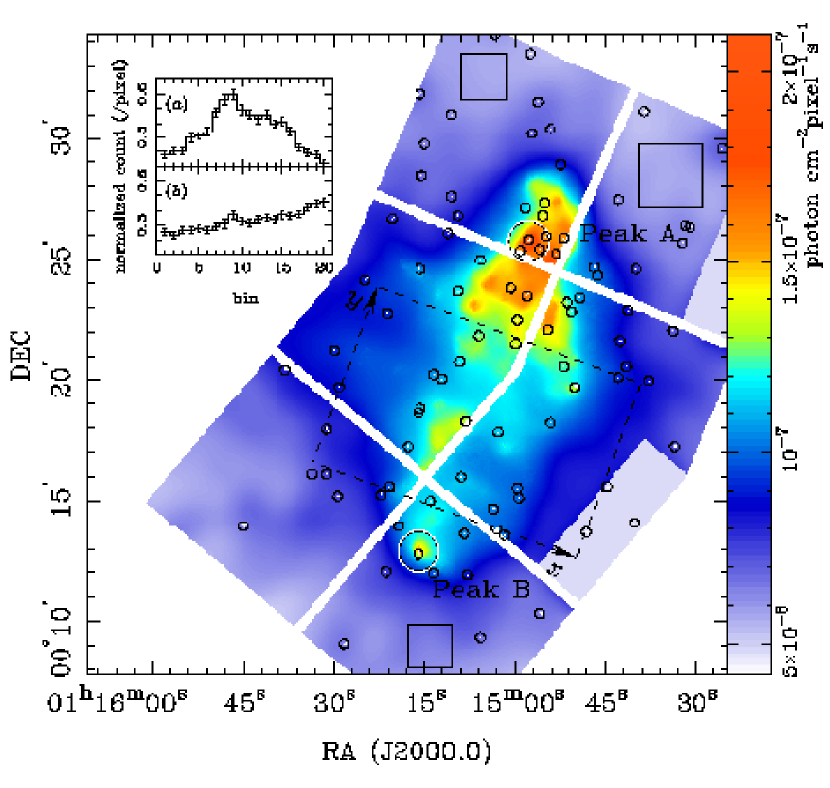
Figure 2 shows the exposure map corrected and adaptively smoothed222We refer the csmooth algorithm to http://cxc.harvard.edu/ciao/ahelp/csmooth.html. image of A168 with point sources excluded. The 7-pixel-width gaps between CCD chips and the CCD boundaries are cut for their high unreliability. The image is smoothed by requiring the signal-to-noise ratio (SNR) to equal 6 with a Gaussian kernel; the SNR is defined as , where is the total count within an aperture (in units of pixel), which is taken to be the scale of the smoothing kernel, is area, i.e., the number of pixels within the aperture, is the mean counts of background, and is the variation of background. and are estimated from the three box regions in Figure 2. The typical smoothing scale of pixels ( 24″). In the most luminous region the scale is pixels. The maximum smoothing scale is taken to be 10 pixel, resulting in low SNRs (-) in regions where the photon counts are close to the background count rate.
Clearly, Figure 2 shows that A168 in X-ray has two X-ray peaks, peak A and peak B. These two X-ray peaks have an angular separation of , corresponding to a projected distance of 676 kpc. We also notice that the X-ray emissions around the two X-ray peaks are heavily distorted. Figure 2 also shows an elongated filamentary structure connecting these two peaks with a prominent clump in the middle. To show the significance of the filament, we study the photon counts in the dashed rectangle shown in Figure 2. We divide the -axis into 20 bins, and count the photon events along the -axis for each bin with the background counts subtracted. To allow for the gap between CCDs, we normalize the counts by the total number of pixels in each bin. The result is shown in Figure 2, which suggests that emission from the filament is significant. We repeat the same procedure in the -direction (show in Figure 2), the photon counts indicate that the filament extends continuously from the south to north.
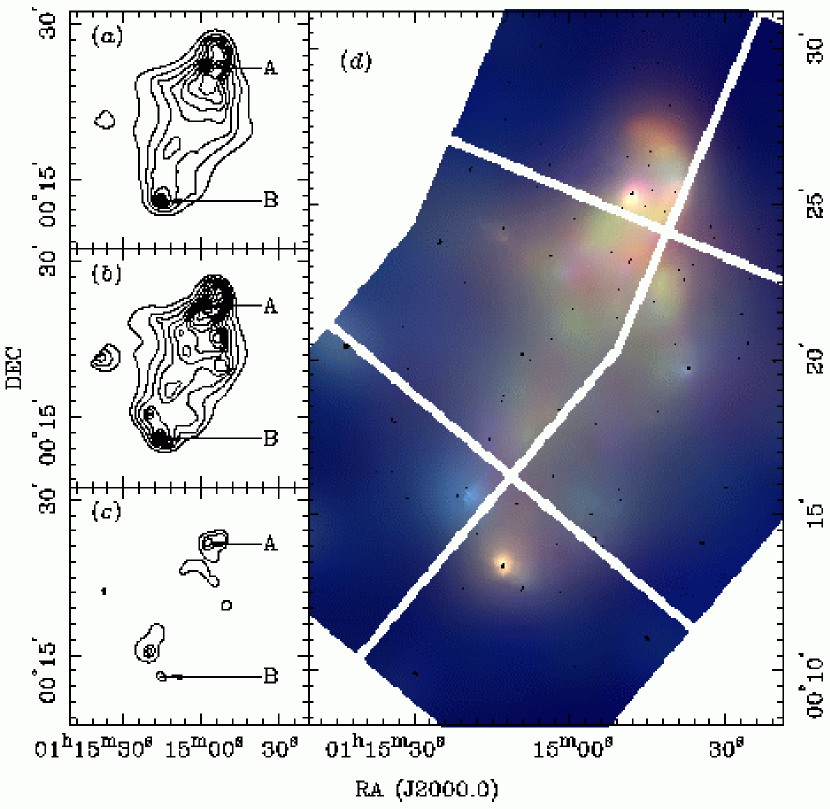
For further analysis, we divide the emission into three energy bands. Figure 3 shows the contours of the soft (0.3-1.5 keV), medium (1.5-2.5 keV) and hard (2.5-10 keV) bands together with a 3-color image combined linearly from these bands. The color image shows some structures which are suggestive of slight temperature variations across A168; we address this question in the next subsection. It is worth noting that there is a small blue clump located to the northeast of peak B (see Figure 3 and the contours of the hard band).
3.2 Spectrum and Temperature Map
The X-ray emission from the hot gas in clusters of galaxies is thought to be from thermal bremsstrahlung, which is usually described by a MEKAL model (Kaastra & Mewe, 1993; Liedahl, Osterheld, & Goldstein, 1995). We therefore perform our spectral analysis using a single temperature WABS(MEKAL) model in the XSPEC package (v11.2.0). The absorption column density is fixed to the Galactic value, (Dickey & Lockman, 1990), as the intrinsic absorption in the cluster is likely to be small. All the following spectra are analyzed in the 0.5-0.8 keV energy range with the point sources removed. The corresponding background spectra of source spectra are extracted separately from the corresponding blank-sky regions on the CCD.
We first investigate the global temperature and metallicity of A168. We define an overall region by the boundary of the thin-solid boxes in Figure 1. From the spectral fitting, the mean temperature and metallicity are found to be keV and , respectively. The mean temperature is in agreement with previous work by David et al. (1993) which gives keV. The total luminosity is ergs/s over the 0.01-80 keV energy range. The temperature and luminosity are consistent with the modest mass of cluster (see Table 3). White, Jones, & Forman (1997) gave a total luminosity of ergs/s in the same energy band but for a cosmology with , and a metallicity of (by assumption). If we convert our results to their cosmology, we find that ergs/s for the diffuse emission and ergs/s for the point sources; the total luminosity is ergs/s, in good agreement with their value. Notice that the point sources contribute about 23% of the total luminosity. Without the resolutions of Chandra, these point sources will be difficult to separate from the diffuse X-ray emission.
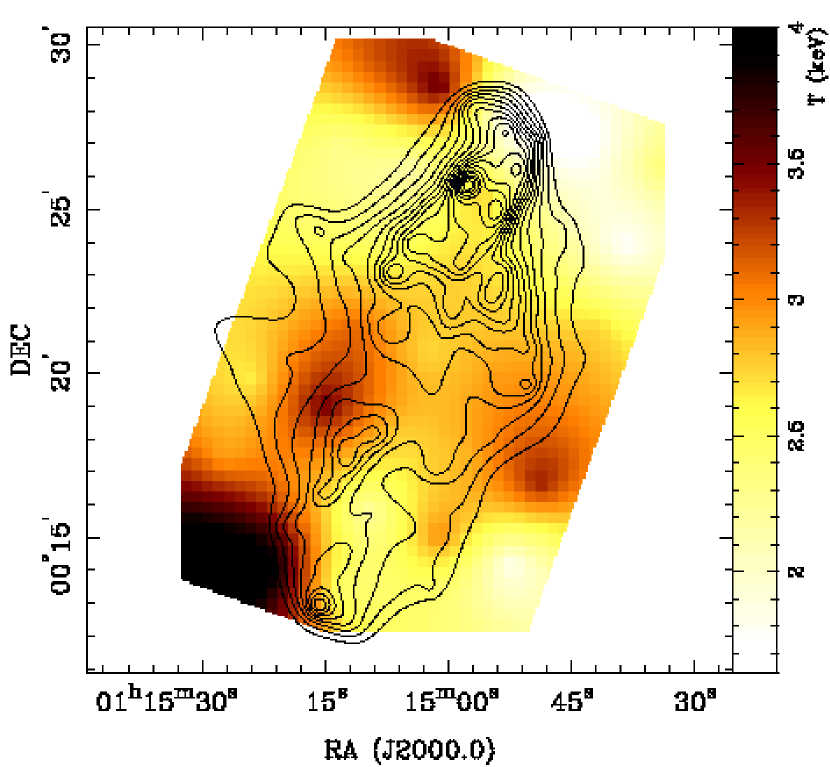
We next define a main body of A168 and divide it into 7 regions that are marked as region A-G from south to north in Figure 1 (thick-dashed boxes). The spectra of the regions are extracted separately. The photon count in each region is about 4000-5000 cts on average. Region C and D has about twice the counts because the spectra are extracted from both observations (OF1 and OF2). The fitting results are listed in Table 1 and plotted in Figure 4. As can be seen, the metallicity is consistent with a constant from south to north. while the fitted temperature appears to vary from south to north with region C having the highest temperature. To further investigate the temperature variation, we increase the region under study and divide it into 35 smaller boxes as shown in Figure 1 (thin-solid boxes). The average count in each box is about 1300 (in the overlap region, the counts may be twice as large), which are too few to constrain both the temperature and metallicity reliably. As the metallicity is consistent with a constant according to the above analysis, we fix it to the mean value, (see the above text or Table 1), and concentrate on the temperature variation. The fitting results are listed in Table 2. A temperature map (shown in Figure 5) is obtained through interpolation using the Kriging method333A function in the Winsurf 7.0 software (Oilver & Webster, 1990). . We performed various tests to check the significance of the temperature variations. It appears that region G has a significant lower temperature than other regions (A-E, see Fig. 4) while other temperature variations have less statistical significance.
4 DISCUSSION
In Sect. 1 we mentioned that A168 is thought to be formed by the collision of two subclusters. This was first suggested from the unusually large offset between its X-ray and optical centers (Ulmer, Wirth, & Kowalski, 1992). In paper I we found evidence for the existence of two subclusters (A168N and A168S) in the optical from the luminosity function and velocity distribution of galaxies in the cluster. As we argue below, Chandra X-ray observations further strengthen the conclusion.
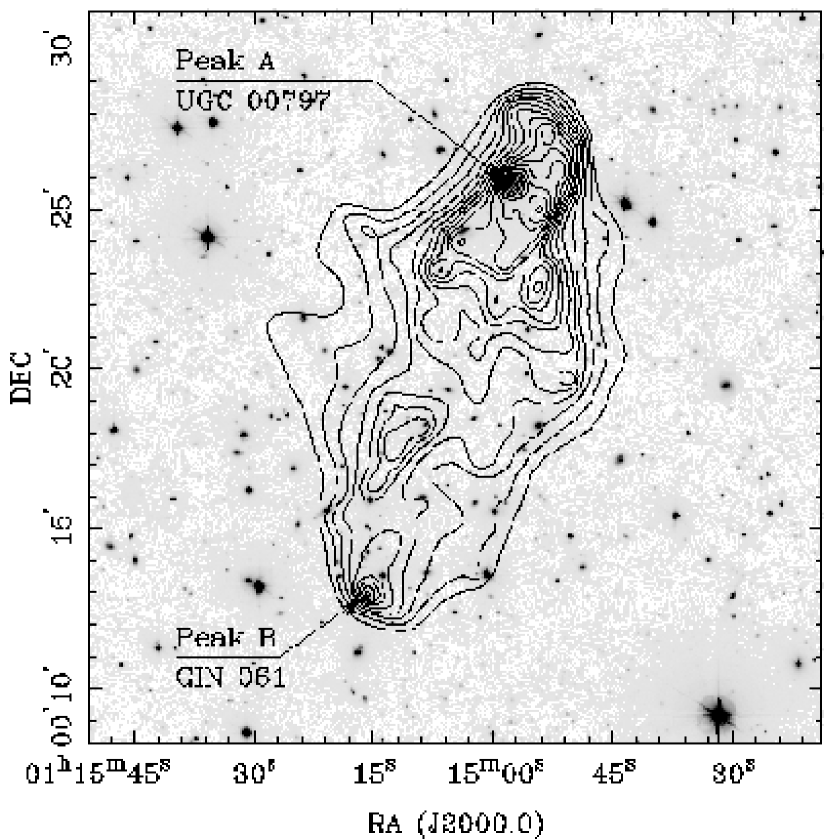
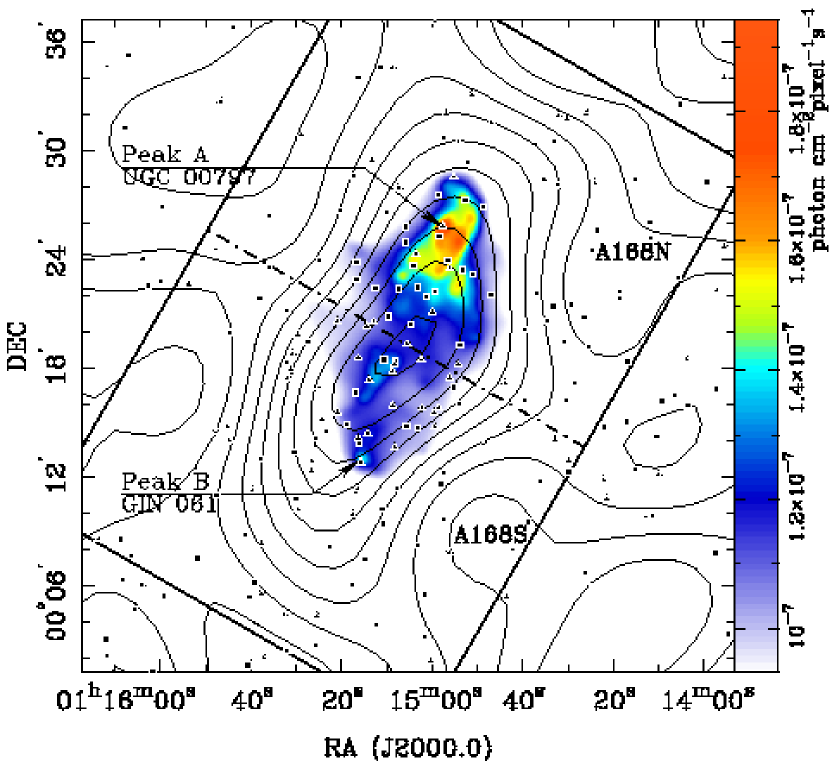
In Figure 6, we show a comparison of the optical and X-ray emissions. Peak A is associated with the cD galaxy UGC 797, the brightest member. Peak B is very close to an elliptical galaxy GIN 061, the second brightest member galaxy. Table 3 collects the relevant properties of these two peaks and their associated galaxies and subclusters. In the SLOAN -band, the two associated galaxies have a luminosity ratio of . However, in the radio, UGC 797 is roughly a factor of ten fainter than GIN 061 at 1.4 GHz (Condon et al., 1998). The absolute magnitude of GIN 061 and its radio properties suggest that it may be a dominant galaxy of its local region.
D/cD galaxies are commonly found in the evolved clusters or groups (Morgan, Kayser, & White, 1975; Albert, White, & Morgan, 1977), and they usually coincide with the X-ray peak in the center of regular relaxed clusters of galaxies (Morgan & Lesh, 1965; Bautz & Morgan, 1970; Jones et al., 1979; Beers & Geller, 1983; Oegerle & Hill, 2001). However, in A168, while both dominant galaxies are clearly associated with X-ray peaks, both show significantly offset from the surface number density peak of the galaxy distribution. This is illustrated in Figure 7, where we superpose the X-ray emission on the contours of the distribution of member galaxies (cf. Paper I). The number density peak of galaxies is located almost in the middle of the two X-ray peaks. The offset between the optical and X-ray centers clearly indicates that A168 is not a relaxed cluster. Notice that the projected distance between the two dominant galaxies is 676 kpc, comparable to the scale of clusters. The large separation implies that these two galaxies must have formed separately in different clusters and hence have distinct evolution histories.
The luminosities of the two X-ray peaks are comparable (see Table 3), with a luminosity ratio of . Between the two X-ray peaks, Chandra observations reveals an elongated and continuous filament connecting the two, suggesting that strong interactions have occurred between the two clumps. The existence of the two peaks (A and B) in both the X-ray and radio, and the X-ray filament connecting the two peaks strongly suggest that A168 consists of two interacting subclusters, A168N and A168S.
Table 3 collects some dynamical properties of A168N and A168S. The mean velocity difference is only , which is small compared with the observed radial velocity dispersions ( ), suggesting that the main bulk motion between these two subclusters is perpendicular to the line of sight. In Paper I we showed that the two components are gravitationally bound at the 92% confidence level under a linear two-body model (Beers, Geller, & Huchra, 1982). This result further supports the interaction between the two subclusters.
From contours of image (Figure 6), one can see that the innermost regions of the two X-ray peaks are roughly symmetric, but the outer contours surrounding two X-ray peaks are distorted, but the distortions are not exactly along the line connecting the two X-ray peaks. As the cluster temperature is not very high ( keV), the potentials of the two subclusters are not very deep, so their outer contours may be easily distorted in the tidal interaction. Furthermore, the filament and the prominent clump along it (see Fig. 5) can be interpreted as the tidal-stripped gas from two subclusters. These structures may also reflect the distribution of unrelaxed dark matter, similar to the ridge discovered in A1367 (Sun & Murray, 2002). Ricker (1998) and Ricker & Sarazin (2001) have studied off-axis mergings of two comparable clusters. Comparing with their results (cf. their Figs. 4-9), the X-ray emission morphology of A168 resembles that of an off-axis merger with a mass ratio from to several Gyrs after a core passage.
We do not detect other significant changes of gas dynamics, such as shocks, strong temperature variations, as expected during merging (Roettiger, Loken, & Burns, 1997; Ricker & Sarazin, 2001). Moreover, we do not find any radio lobes or haloes (see Marvel, Shukla, & Rhee, 1999, Figure 2) which are considered to be related to the merging or cooling activities of clusters of galaxies (Fabian et al., 2000; Fujita et al., 2002). Furthermore, if the merger is ongoing, enhanced and concentrated blue galaxies are expected to be observed (Dressler & Gunn, 1988), but Tomita et al. (1996) concluded that there are no significant blue galaxies related to the merger. The lack of activities seem to be consistent with the view that the last major collision (core passage) has occurred several Gyrs ago and the merging signatures have ‘decayed’. However, it is not clear whether this timescale is correct. We can estimate the timescale to be Gyr if we take the distance of two X-ray peaks to be 676 kpc, and assume a colliding velocity of km s-1. Such a short time scale would be difficult to reconcile with the lack of strong merging signatures as some simulations show that the remnant signatures may last several Gyrs (Roettiger, Loken, & Burns, 1997; Ricker & Sarazin, 2001). The most puzzling feature of A168 remains the fact that the density peak of the galaxy number distribution seems to be in the middle of the X-ray peak, this appears to be rare in numerical simulations where the X-ray peaks and the dark matter density peaks (and presumably the galaxy distribution) usually coincide (Ricker, 1998; Ricker & Sarazin, 2001).
5 SUMMARY
We have analyzed the data from Chandra observations of A168. The mean temperature and metallicity are keV and , respectively. The total luminosity of A168 is ergs/s over the 0.01-80 keV energy range. We divided the system into many regions and studied their images and spectral properties. Our main findings are as follows:
-
1.
Two X-ray peaks with a projected distance of 676 kpc are resolved unambiguously. The luminosity within an aperture of and over 0.5-8.0 keV energy range is ergs/s for peak A and ergs/s for peak B.
-
2.
A significant and continuous filament with a prominent clump in the middle is detected between the two X-ray peaks.
- 3.
The radio, optical and X-ray data for A168 strongly suggest the existence of two subclusters, A168N and A168S. The X-ray morphology is consistent with it being an off-axis merger of two comparable subclusters several Gyrs after a core passage. But it is not clear whether the lack of other merging signatures in the X-ray (such as strong shocks) is consistent with this scenario. A168 may be a very unusual system as the significant offset between the X-ray and optical centers is rare. It will be a challenge to see whether numerical simulations can reproduce the observed X-ray properties, down to a spatial resolution of kpc at the full resolution of Chandra. More future observations of Chandra or XMM-Newton and detailed numerical simulations will shed further insights on the nature of the system.
References
- Albert, White, & Morgan (1977) Albert, C. E., White, R. A., & Morgan, W. W. 1977, ApJ, 211, 309
- Bautz & Morgan (1970) Bautz, L. P. & Morgan, W. W. 1970, ApJ, 162, L149
- Beers, Geller, & Huchra (1982) Beers, T. C., Geller, M. J., & Huchra, J. P. 1982, ApJ, 257, 23
- Beers & Geller (1983) Beers, T. C. & Geller, M. J. 1983, ApJ, 274, 491
- Bekki (1999) Bekki, K. 1999, ApJ, 510, L15
- Condon et al. (1998) Condon, J. J., Cotton, W. D., Greisen, E. W., Yin, Q. F., Perley, R. A., Taylor, G. B., & Broderick, J. J. 1998, AJ, 115, 1693
- David et al. (1993) David, L. P., Slyz, A., Jones, C., Forman, W., Vrtilek, S. D., & Arnaud, K. A. 1993, ApJ, 412, 479
- Dickey & Lockman (1990) Dickey, J. M. & Lockman, F. J. 1990, ARA&A, 28, 215
- Dressler & Gunn (1988) Dressler, A. & Gunn, J. E. 1988, IAU Symp. 130: Large Scale Structures of the Universe, 130, 311
- Fabian et al. (2000) Fabian, A. C. et al. 2000, MNRAS, 318, L65
- Fabian et al. (2003) Fabian, A. C., Sanders, J. S., Allen, S. W., Crawford, C. S., Iwasawa, K., Johnstone, R. M., Schmidt, R. W., & Taylor, G. B. 2003, MNRAS, 344, L43
- Fan et al. (1996) Fan, X., et al. 1996, AJ, 112, 628
- Fujita et al. (2002) Fujita, Y., Sarazin, C. L., Kempner, J. C., Rudnick, L., Slee, O. B., Roy, A. L., Andernach, H., & Ehle, M. 2002, ApJ, 575, 764
- Gabici & Blasi (2003) Gabici, S. & Blasi, P. 2003, ApJ, 583, 695
- Jones et al. (1979) Jones, C., Mandel, E., Schwarz, J., Forman, W., Murray, S. S., & Harnden, F. R. 1979, ApJ, 234, L21
- Kaastra & Mewe (1993) Kaastra, J. S. & Mewe, R. 1993, A&AS, 97, 443
- Liedahl, Osterheld, & Goldstein (1995) Liedahl, D. A., Osterheld, A. L., & Goldstein, W. H. 1995, ApJ, 438, L115
- Markevitch, Vikhlinin, & Mazzotta (2001) Markevitch, M., Vikhlinin, A., & Mazzotta, P. 2001, ApJ, 562, L153
- Markevitch & Vikhlinin (2001) Markevitch, M. & Vikhlinin, A. 2001, ApJ, 563, 95
- Markevitch et al. (2002) Markevitch, M., Gonzalez, A. H., David, L., Vikhlinin, A., Murray, S., Forman, W., Jones, C., & Tucker, W. 2002, ApJ, 567, L27
- Markevitch et al. (2003) Markevitch, M., et al. 2003, ApJ, 583, 70
- Marvel, Shukla, & Rhee (1999) Marvel, K. B., Shukla, H., & Rhee, G. 1999, ApJS, 120, 147
- Mihos (2004) Mihos, J. C. 2004, in Carnegie Observatories Astrophysics Series, Vol. 3: Clusters of Galaxies: Probes of Cosmological Structure and Galaxy Evolution, ed. J. S. Mulchaey, A. Dressler, & A. Oemler (Cambridge: Cambridge Univ. Press), p. 278 (astro-ph/0305512)
- Morgan & Lesh (1965) Morgan, W. W. & Lesh, J. R. 1965, ApJ, 142, 1364
- Morgan, Kayser, & White (1975) Morgan, W. W., Kayser, S., & White, R. A. 1975, ApJ, 199, 545
- Oegerle & Hill (2001) Oegerle, W. R. & Hill, J. M. 2001, AJ, 122, 2858
- Oilver & Webster (1990) Oliver, M. A., & Webster, R. 1990, INT. J. Geographical Information Systems, 4, 313
- Ricker (1998) Ricker, P. M. 1998, ApJ, 496, 670
- Ricker & Sarazin (2001) Ricker, P. M. & Sarazin, C. L. 2001, ApJ, 561, 621
- Roettiger, Loken, & Burns (1997) Roettiger, K., Loken, C., & Burns, J. O. 1997, ApJS, 109, 307
- Roettiger, Stone, & Burns (1999) Roettiger, K., Stone, J. M., & Burns, J. O. 1999, ApJ, 518, 594
- Sun et al. (2002) Sun, M., Murray, S. S., Markevitch, M., & Vikhlinin, A. 2002, ApJ, 565, 867
- Sun & Murray (2002) Sun, M. & Murray, S. S. 2002, ApJ, 576, 708
- Tomita et al. (1996) Tomita, A., Nakamura, F. E., Takata, T., Nakanishi, K., Takeuchi, T., Ohta, K., & Yamada, T. 1996, AJ, 111, 42
- Ulmer, Wirth, & Kowalski (1992) Ulmer,M. P., Wirth, G. D., & Kowalski, M. P. 1992, ApJ, 397, 430
- Vikhlinin, Markevitch, & Murray (2001) Vikhlinin, A., Markevitch, M., & Murray, S. S. 2001, ApJ, 551, 160
- White, Jones, & Forman (1997) White, D. A., Jones, C., & Forman, W. 1997, MNRAS, 292, 419
- Yang et al. (2004) Yang, Y., Zhou, X., Yuan, Q., Jiang, Z., Ma, J., Wu, H., & Chen, J. 2004, ApJ, 600, 141
- Zhou et al. (2003) Zhou, X., et al. 2003, A&A, 397, 361
| Region | Temperature (keV) | Metallicity () | /d.o.f. |
|---|---|---|---|
| A | 168/122 | ||
| B | 182/158 | ||
| C | 381/333 | ||
| D | 406/341 | ||
| E | 349/281 | ||
| F | 220/174 | ||
| G | 210/142 | ||
| whole region | 1569/1006 |
| C1 | C2 | C3 | C4 | C5 | |
|---|---|---|---|---|---|
| R1 | |||||
| R2 | |||||
| R3 | |||||
| R4 | |||||
| R5 | |||||
| R6 | |||||
| R7 |
| Peak A | Peak B | References | ||
| (Ra., Dec.) J2000.0 | ||||
| Projected distance from A to B | kpc | |||
| ( ergs/s)aaThe flux is calculated over the 0.3-8.0 keV energy range within an aperture of 49″( kpc), as indicated by two circles in Figure 2. | ||||
| Asocciated galaxy | UGC 797 | GIN 061 | (1) | |
| 13.58 | 14.59 | (2) | ||
| Radio flux at 1.4 GHz (mJy) | (3) | |||
| Diameter (arcmin) | 0.9 0.9 | 0.58 0.5 | (1) | |
| () | (1) | |||
| Associated subcluster | A168N | A168S | (4) | |
| () | (4) | |||
| () | (4) | |||
| () | (4) | |||
| ( ) | (4) | |||