The Primary Proton Spectrum of Cosmic Rays measured with Single Hadrons at Ground Level
Abstract
The flux of cosmic-ray induced single hadrons near sea level has been measured with the large hadron calorimeter of the KASCADE experiment. The measurement corroborates former results obtained with detectors of smaller size if the enlarged veto of the 304 m2 calorimeter surface is encounted for. The program CORSIKA/QGSJET is used to compute the cosmic-ray flux above the atmosphere. Between E0 = 300 GeV and 1 PeV the primary proton spectrum can be described with a power law parametrized as m-2 s-1 sr-1 TeV-1. In the TeV region the proton flux compares well with the results from recent measurements of direct experiments.
1 Introduction
The “knee” in the cosmic-ray energy spectrum has been observed by many research groups and in several observables of air shower experiments. Typically, its position is found around a primary particle energy of 4 PeV. Many theoretical approaches to explain the knee exist. The most probable cause seems to be a superposition of spectra of many nuclei each with an individual flux cut-off at different energies. The hypotheses of the origin and experimental findings, however, differ significantly, in particular for the primary proton spectrum, which is of special relevance to understand cosmic-ray acceleration and propagation in the galaxy. A proton knee is claimed to be seen at different energies, e.g. at 10 TeV by the MUBEE collaboration (Zatsepin et al 1993), at 100 TeV by the Tibet group (Amenomori et al 2000) and at 4 PeV by the KASCADE collaboration (Ulrich et al 2001). When taking the experimental data of older direct measurements by balloon or satellite experiments above the atmosphere at face value, one might imagine a change of the power law slope at 10 TeV. But recent measurements seem not to confirm such former conjectures. Precise measurements during the last years in the 100 GeV region yielded proton fluxes lower by about 30% compared to older measurements, e.g. the new data of the BESS (Sanuki et al 2000), CAPRICE (Mocchiutti et al 2001), IMAX (Menn et al 2000) and AMS (Alcaraz et al 2000) collaborations. On the other hand, in the 100 TeV region recent publications on direct measurements report on higher flux values, e.g. JACEE (Asakimori et al 1998) and Runjob (Apanasenko et al 2001). These findings indicate that the proton flux does not seem to decrease as strongly as anticipated so far.
Therefore, it is of interest to determine the proton flux over a wide range of primary energy using one single method. Such a method is the detection of single hadrons at ground level. These unaccompanied hadrons turn out to be intimately connected to primary protons. The latter penetrate deeper into the atmosphere with their hadronic component than heavier primaries of the same energy and are the most abundant producers of single hadrons. Single hadron spectra have been measured using different experimental techniques like emulsion chambers, magnetic spectrometers, or calorimeters. In the past, measurements have been carried out both, at sea level (Cowan and Matthews 1971, Siohan et al 1977, Fickle and Lamb 1979, Mielke et al 1994) and at mountain altitudes (Aglietta et al 2003, Inoue et al 1997). Different definitions of single hadrons are used in the literature. For the present investigations a large calorimeter is used at sea level and single hadrons are defined as follows: Only one hadron with an energy of at least 100 GeV is reconstructed in the detector. In addition, the zenith angles are restricted to less than 30∘ in the analysis. During the last years the simulation of air showers has improved considerably and the primary particle spectra can be deduced from ground based experiments with more confidence.
The KASCADE calorimeter has been operating continuously and steadily for many years. Large data sets have been accumulated which allow to estimate the flux up to the PeV range. However, as air shower simulations indicate, more and more single hadrons turn out to originate from higher-mass primaries with increasing energy. Hence, the connections to primary protons become less stringent.
2 Experimental apparatus
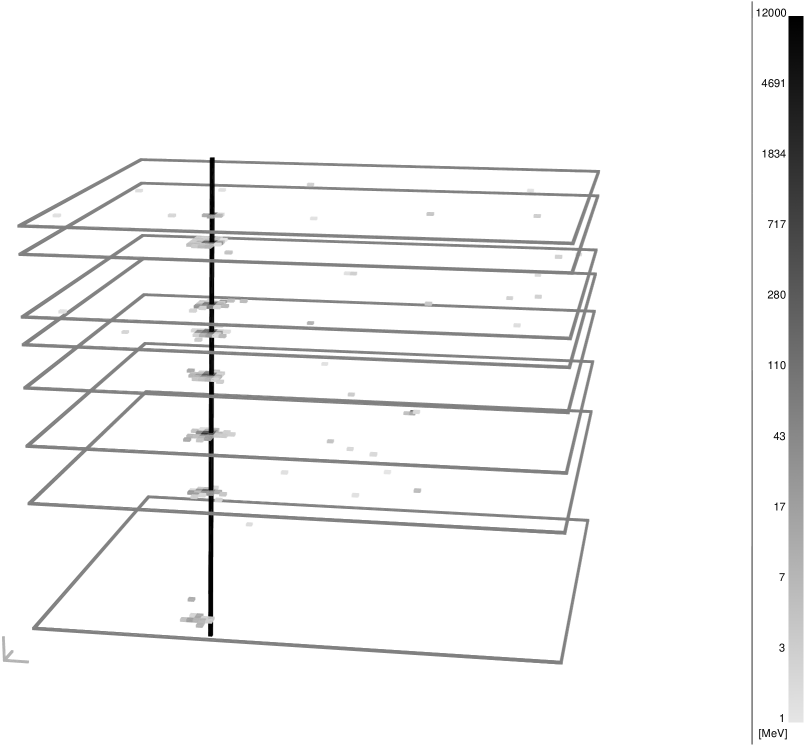
The hadrons have been detected with the central calorimeter of the KASCADE experiment measuring cosmic rays near sea level (Engler et al 1999). It is a sampling calorimeter consisting of layers of lead, iron, and concrete absorbers interspersed with 9 layers of warm-liquid ionization chambers with an acceptance area of 304 m2. The finely segmented chambers allow to measure the energy of individual hadrons and to reconstruct their point and angle of incidence. An example of a single hadron event is presented in figure 1. The energy depositions in the ionization chambers are plotted from which a total energy of 4.5 TeV for the hadron shown has been reconstructed. Apart from the hadron cascade no significant energy deposition is seen in the calorimeter layers. In particular, also the uppermost layer, where the entire electromagnetic energy is measured, is nearly empty. The detection and reconstruction efficiencies of hadronic cascades in the calorimeter have been determined by simulating cascades with the detector simulation code GEANT (CERN 1993)/FLUKA (Aarnio et al 1987, 1990). At 100 GeV a trigger and reconstruction efficiency of 50% is reached, increasing to more than 70% at 500 GeV. Radiating muons can imitate a hadron. However, above 100 GeV the contributions of hadrons faked by muons is below the 1% level, for a detailed discussion see Mielke et al (1994). The maximum energy of an unaccompanied hadron detected was 50 TeV. During five years of operation (1996-2001) more than 1.5107 events have been recorded with at least one reconstructed hadron, out of which 2.5106 had one hadron only.
The calorimeter is surrounded by an array of stations equipped with scintillators in which the electromagnetic and muonic components of an air shower are detected. A description of the experiment can be found in Antoni et al (2003).
3 Simulations
The measurements have been accompanied by extensive shower simulations in order to understand the phenomenon of single hadrons and to determine the relation between the primary proton spectrum and the single hadron spectrum at ground level. The program CORSIKA 6.014 (Heck et al 1998) has been employed with the code QGSJET 01 (Kalmykov and Ostapchenko 1993, Kalmykov et al 1997, Heck et al 2001) for high-energy hadronic interactions and GHEISHA (Fesefeldt 1985) for energies below 80 GeV.
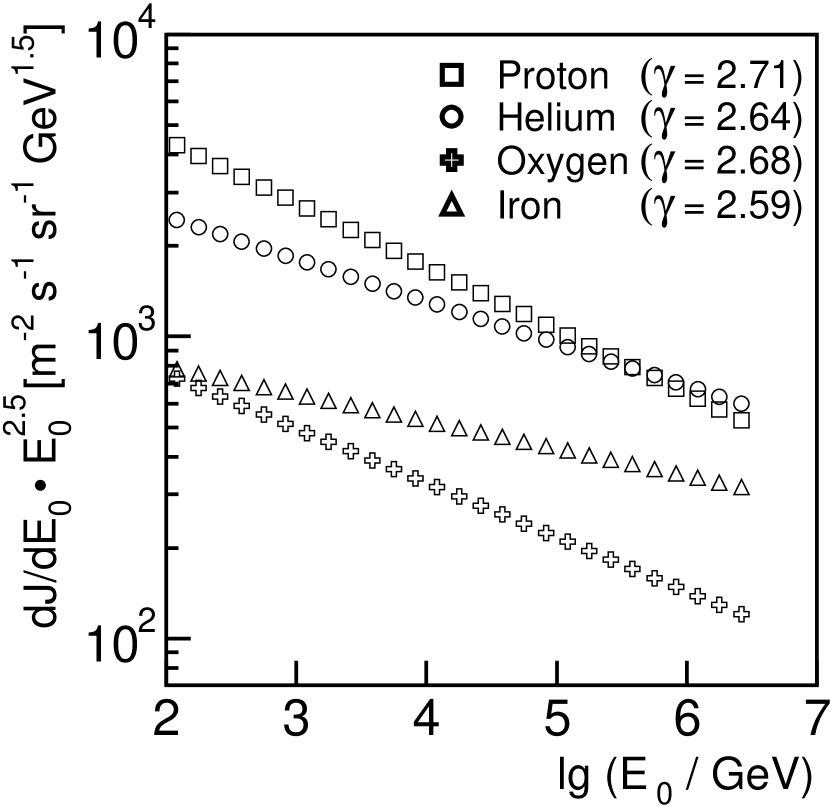
For the primary fluxes of nuclei above the atmosphere parametrizations according to power laws are taken from compilations by Wiebel-Sooth et al (1998) and Hörandel (2003). In the latter review more recent measurements are taken into account and the parametrizations for proton, helium and iron have been updated. In total, about 21010 events have been simulated in the energy range from 100 GeV to 3 PeV for proton, helium, oxygen, and iron induced showers. The number corresponds to a data taking period of approximately 80 days for the calorimeter acceptance. For illustration, the fluxes used are depicted in figure 2, marked with the corresponding spectral index and extrapolated into the PeV region. The shower cores of the simulated events have been distributed evenly over the calorimeter area extended by 2 m at all four sides. The hadrons are tightly concentrated near the shower axis. The simulated distance distribution can be parametrized by an exponential function that falls off to 1/e within 4.3 m, nearly independent of energy. Using this lateral distribution, calculations show that out of all primary particles, which are reconstructed as single hadrons 75% have been simulated. The simulations reveal, though, that for a given interval of hadron energy, the fraction of missing events is nearly independent of primary energy. Since the missing percentage does not depend strongly on energy it has no significant effect on the deduced primary proton spectrum which will be presented in section 5 below.
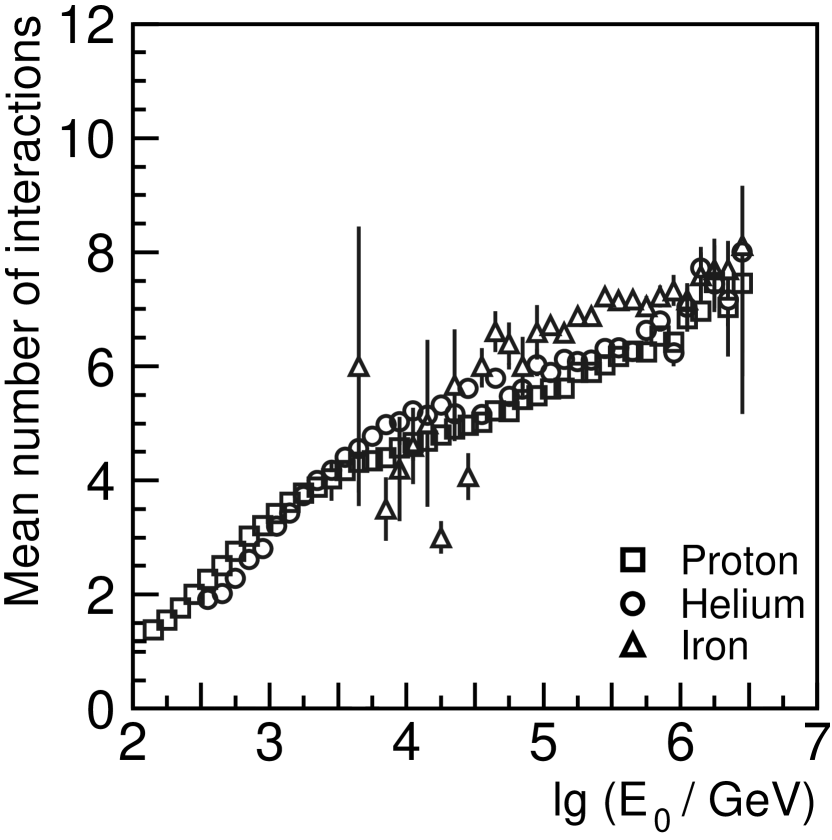
Single hadrons belong to a particular class of air showers for which the detected hadrons stem from air showers with only a few interactions in the atmosphere. In vertical direction the thickness of the atmosphere corresponds to about 11 interaction lengths. How many hadronic interactions occurred for single hadron events is shown in figure 3. In the TeV range primary protons or helium nuclei encounter 3 or 4 interactions only. Integrated over all relevant energies, the average number of interactions is 3.6 for primary protons. Heavier nuclei do not generate single hadrons in this energy range, as revealed by the primary iron simulations. Oxygen and iron nuclei can be seen in this class of events only if the primaries have energies higher than 30 TeV.
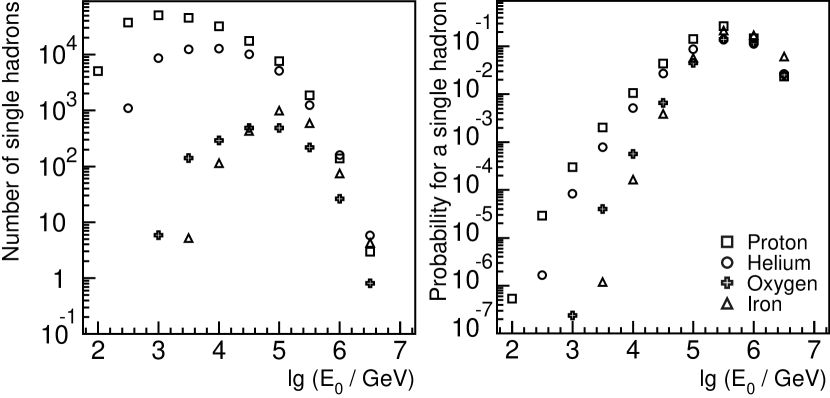
The number of reconstructed single hadron events for the four classes of primaries are shown in figure 4 on the left-hand panel. On the right-hand the corresponding probability to find a single hadron event is plotted for primaries with respect to their energy. One observes that up to a few TeV, indeed, single hadrons originate mostly from primary protons and that above 10 TeV also helium primaries contribute. At approximately 1 PeV, proton and helium contribute with equal numbers to single hadrons and at higher energies also heavier nuclei have to be considered. The right-hand panel reveals that in the hundred TeV range 10% of all showers are of the single hadron type. This figure is valid for the present definition of a single hadron. If also accompanying electromagnetic energy would exclude single hadrons, they would be encountered less frequently, as outlined in the next section.
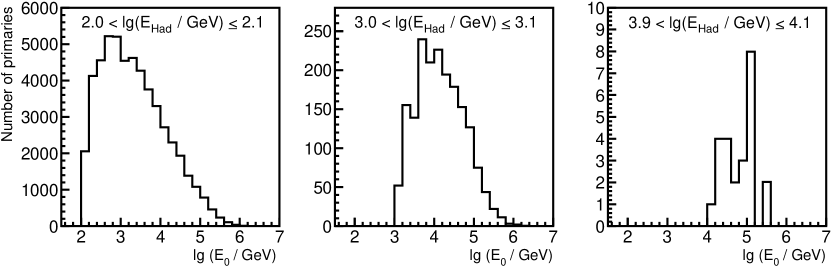
The simulations show how closely the single hadron events are related to the primary particles. In figure 5 the distributions of primary proton energies are presented for three energy bins of single hadrons: for about 100 GeV, 1 TeV and 10 TeV. The spread of the primary energy is wide, but the bulk of parents have an energy ten times larger than the observed energy for all three intervals. Based on simulations it has been verified that the 25% of events missing do not change the shape of the distributions appreciably. Therefore, despite the large fluctuations, measuring the single hadron spectrum allows to deduce the primary proton flux.
| lg (EHad / GeV) | number of hadrons | hadron flux (m2 s sr GeV)-1 |
|---|---|---|
| 2.1 | 834920 | ( 0.20 0.03 ) |
| 2.3 | 693430 | ( 0.71 0.11 ) |
| 2.5 | 481890 | ( 0.26 0.04 ) |
| 2.7 | 252110 | ( 0.79 0.12 ) |
| 2.9 | 113930 | ( 0.21 0.04 ) |
| 3.1 | 39510 | ( 0.44 0.10 ) |
| 3.3 | 13220 | ( 0.89 0.22 ) |
| 3.5 | 4400 | ( 0.18 0.04 ) |
| 3.7 | 1515 | ( 0.37 0.10 ) |
| 3.9 | 450 | ( 0.70 0.17 ) |
| 4.1 | 145 | ( 0.14 0.04 ) |
| 4.3 | 23 | ( 0.12 0.04 ) |
| 4.5 | 4 | ( 0.11 0.07 ) |
| 4.7 | 2 | ( 0.24 0.32 ) |
4 Single hadron spectrum
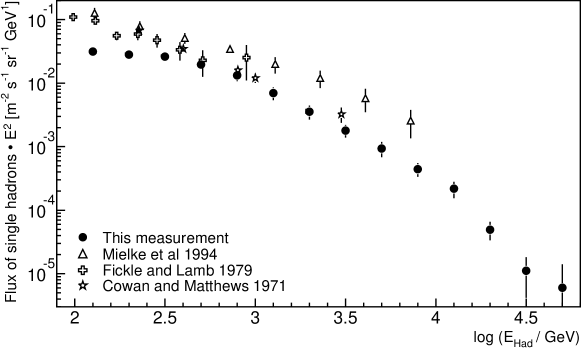
The flux of single hadrons is obtained using the trigger and reconstruction efficiencies as determined with the GEANT/FLUKA code. The data are given in table 1 and are presented in figure 6. The errors quoted are estimated systematic uncertainties concerning the fiducial area of the calorimeter, the total data taking time, the effective solid angle, and the energy assignment, but are dominated by the trigger and reconstruction efficiencies. They amount to approximately 15% below 1 TeV, 25% in the TeV range and 35% above 10 TeV. The numbers of collected hadrons given in the table indicate that statistical errors can be neglected below 10 TeV. The data exhibit almost a power law in the double logarithmic graph. However, on the energy scale of over 2.5 orders of magnitude a gentle bend is apparent. Such a behaviour is observed in the simulations as well. For reference, measurements from the literature (Cowan and Matthews 1971, Fickle and Lamb 1979) are shown as well as the data from the KASCADE prototype calorimeter (Mielke et al 1994). The last experiment exhibits somewhat larger fluxes compared with the present data due to its smaller surface of 6 m2. The KASCADE calorimeter with 304 m2 fiducial area has a more efficient veto for multiple hadron detection. Especially for low hadron energies this may cause the differences. The data of the two older experiments, which both had smaller apertures of about 0.65 m sr, show a similar shape.
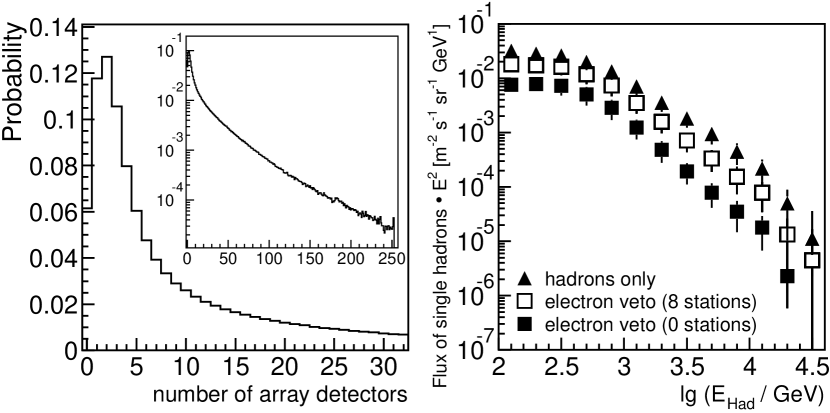
In the present investigations also accompanying electromagnetic radiation detected in the scintillators of the array stations can be accounted for. The graph in the left-hand panel of figure 7 shows the number of stations which have registered at least one minimum ionizing particle in coincidence with a single hadron. In fact, only 6% of the single hadron events are not accompanied by a signal in the array stations. As can be inferred from the insert, a small probability exists that all 252 array stations have a signal in coincidence with a single hadron. All this signifies that the notion “single hadron” is somehow artificial, it depends on the experimental conditions and ipso facto changes from experiment to experiment. Demanding that not more than eight stations have an electronic signal, i.e. Edep 5 MeV, already reduces the number of single hadron events by 1/3. This can be seen in the right-hand panel of figure 7, where the single hadron spectrum is compared with this additional requirement. One observes that the electron veto becomes stronger for large hadron energies which in the mean originate from higher primary energies. Simulations indicate that the sensitivity to primary protons is also enhanced. In the figure the flux with no signal at all in the 252 stations is presented as well. However, because the number of events fulfilling this requirement is too small, the veto condition of not more than eight stations activated has been chosen for further analyses, in particular when deducing the primary proton spectrum.
5 Primary proton spectrum
| primary energy E0 | uncorrected flux E | proton flux E |
|---|---|---|
| lg(E0/GeV) | [m-2s-1sr-1GeV1.5] | [m-2s-1sr-1GeV1.5] |
| 2.5 | 4680 1025 ( 700) | 4675 1025 ( 700) |
| 3.0 | 3800 830 ( 550) | 3400 740 ( 500) |
| 3.5 | 3000 660 ( 450) | 2470 545 ( 370) |
| 4.0 | 2330 500 ( 355) | 1800 395 ( 270) |
| 4.5 | 1900 565 ( 490) | 1310 385 ( 330) |
| 5.0 | 1520 450 ( 385) | 950 285 ( 240) |
| 5.5 | 1040 420 ( 370) | 690 280 ( 240) |
| 6.0 | 775 310 ( 285) | 505 200 ( 180) |
The single hadron spectrum is converted to a flux of primary protons by attributing to the measured hadrons a probable primary energy according to the energy distributions which are illustrated in figure 5. In principle the single hadron spectrum has to be converted to a flux of primary protons by solving the integral equation
| (1) |
is the transfer function transforming the primary flux spectrum into the measured single hadron spectrum at ground level accounting for the interactions in the atmosphere. Several methods exist to deconvolute one-dimensional spectra. For sake of simplicity a slightly different approach has been chosen, which turned out to be rather robust and straightforward. Knowing the probability density distribution for a given single hadron energy , the primary proton flux can be inferred by
| (2) |
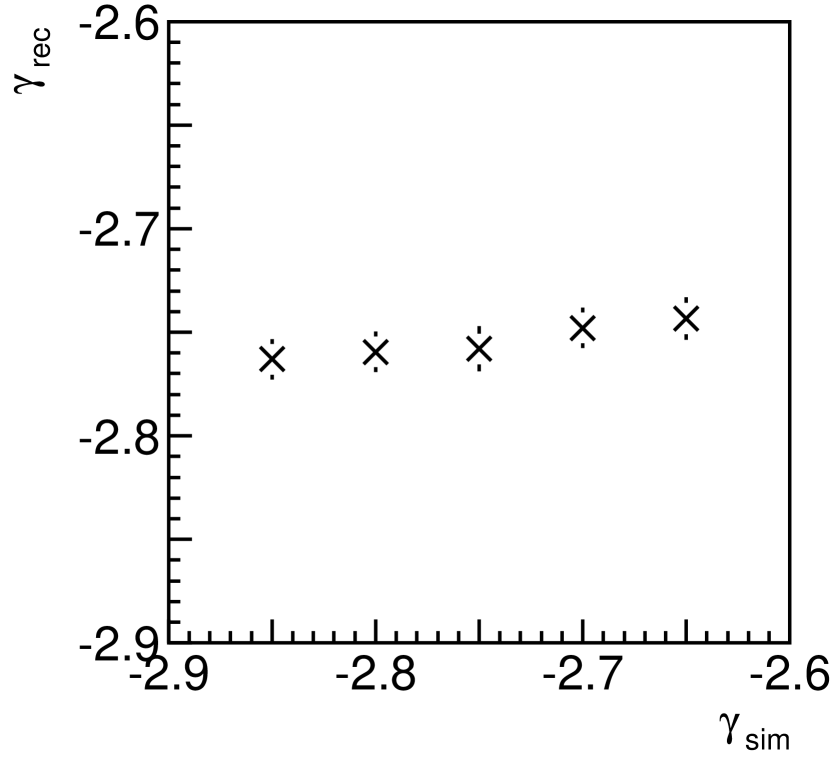
Using the calculated probability distributions (see e.g. figure 5) assuming primary fluxes as given in figure 2, the primary proton flux is obtained. The resulting energy spectrum depends only slightly on the slope of the a priori flux assumptions, as can be seen in figure 8. Plotted are the power law indices derived from the data versus the assumed indices in the simulations of the probability distributions. One realizes that the method yields rather stable results.
The outcome for the uncorrected primary fluxes are given in the second column of table 2, assuming that all primaries are protons. They are multiplied by E2.5 in order to compensate the steeply falling power law spectrum. As seen in figure 4, at higher energies also helium and, to some extent, the heavier nuclei initiate single hadron events. These contributions are subtracted by taking into account the parametrized primary fluxes as shown in figure 2. The final proton fluxes are presented in the third column. In the TeV region the difference of the flux values amounts to about 20%, a value comparable to the errors as discussed in the following.
The errors quoted are estimates of systematic uncertainties. They include the calculation of the probability density distribution and the errors in the single hadron spectrum (given in parentheses), both added quadratically. The uncertainties in are estimated to amount to 15% below a few TeV and 20% at higher values of E0.
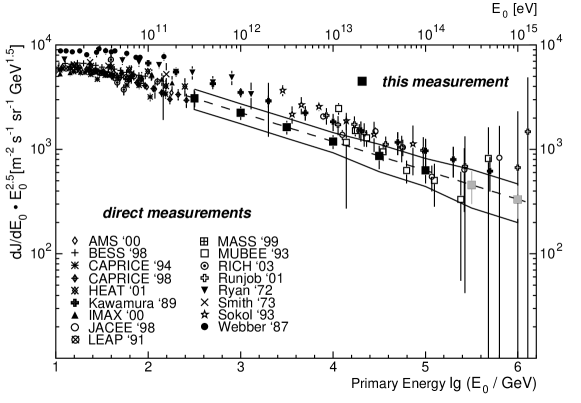
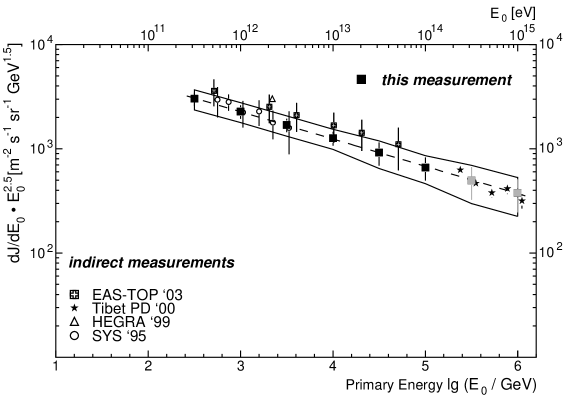
Graphic representations of the results are shown in figures 9 and 10. The present data are plotted as filled squares and the maximal errors are indicated by the two lines. The error bars on the individual points represent the systematic uncertainties in the single hadron flux. The squares follow a power law reasonably well, a corresponding fit yields m-2 s-1 sr-1 TeV-1 which is indicated by the dashed line. It should be kept in mind that for higher energies above 100 TeV contributions of helium and heavy nuclei of up to 50% had to be subtracted. In the figures the corresponding values are marked as shaded points.
In figure 9 the data are compared to results of direct measurements above the atmosphere taken from the literature. One recognizes differences between the individual results of the order of a factor of two. Within these uncertainties the present data are compatible with results from the literature. At energies around 100 GeV the most recent data of direct measurements scatter at the lower bound of the published fluxes. Our proton flux extrapolates well to these data. This fact can be interpreted in such a way that in this energy region from to GeV the hadronic shower cascade within the atmosphere is well described by the program CORSIKA with the interaction code QGSJET01. Also other tests have proven that below 1 PeV the latter code describes the shower propagation best (Antoni et al 1999 and 2001).
In figure 10 our data are shown together with fluxes for primary protons obtained by experiments using indirect methods of measurements as well. Within the errors given, the data corroborate previous measurements.
6 Summary
Using the large hadron calorimeter of the KASCADE experiment during three years of effective data taking, 2.5106 events have been accumulated for which a single hadron was reconstructed. With these data the energy spectrum of single hadrons has been derived. These data are somewhat lower than fluxes published previously. This is attributed to the large surface area of the calorimeter which acts as a more efficient veto against multi-hadron events.
Single hadron events are particular air showers, which predominantly stem from primary protons in the energy region considered. Applying large sets of simulated single hadron events, and assuming primary particle fluxes as obtained by direct measurements extrapolated into the PeV region by power laws, the primary spectrum for protons could be determined. The data extend over nearly four orders of magnitude in primary energy and can be described by a power law with a flux parametrized as m-2 s-1 sr-1 TeV-1. In the TeV region the proton fluxes agree well with recent measurements of direct experiments above the atmosphere.
7 Acknowledgments
The authors would like to thank the members of the engineering and technical staff of the KASCADE collaboration who contributed with enthusiasm and commitment to the success of the experiment. The KASCADE experiment is supported by the German Federal Ministry of Education and Research and was embedded in collaborative WTZ projects between Germany and Romania (RUM 97/014) and Poland (POL 99/005) and Armenia (ARM 98/002). The Polish group acknowledges the support by KBN grant no. 5PO3B 13320.
References
- (1) []Aarnio, P. A., et al 1987, 1990, FLUKA user´s guide, Technical Report TIS-RP-190, CERN
- (2) []Aglietta, M., et al 2003, Astropart. Phys. 19, 329
- (3) []Aharonian, F., et al 1999, Phys. Rev. D59, 092003
- (4) []Alcaraz, J., et al 2000, Phys. Lett. B490, 27
- (5) []Amenomori, M., et al 2000, Phys. Rev. D62, 112002
- (6) []Antoni, T., et al (KASCADE collaboration) 1999, J. Phys. G: Nucl. Part. Phys. 25, 2161
- (7) []Antoni, T., et al (KASCADE collaboration) 2001, J. Phys. G: Nucl. Part. Phys. 27, 1785
- (8) []Antoni, T., et al (KASCADE collaboration) 2003, Nucl. Instr. and Meth. A 513, 490
- (9) []Apanasenko, A. V., et al 2001, Astropart. Phys. 16, 13
- (10) []Asakimori, K., et al 1998, Astrophys. J. 502, 278
- (11) []Bellotti, R., et al 1999, Phys. Rev. D60, 052002
- (12) []Boezio, M., et al 1999, Astrophys. J. 518, 457
- (13) []CERN 1993, GEANT 3.21, Detector Description and Simulation Tool CERN Program Library Long Writeup W5015, Application Software Group
- (14) []Cowan, E. W., Matthews, K., 1971, Phys. Rev. D4, 37
- (15) []Diehl, E., et al 2003, Astropart. Phys. 18, 487
- (16) []DuVernois, M. A., et al 2001, Proc. 27th Int. Cosmic Ray Conf. (Hamburg) 5, 1618
- (17) []Engler, J., et al 1999, Nucl. Instr. and Meth. A 427, 528
- (18) []Fesefeldt, H. 1985, The Simulation of Hadronic Showers – Physics and Applications – Report PITHA-85/02, RWTH Aachen
- (19) []Fickle, R. K., Lamb, R. C., 1979, Lett. Nuovo Cimento 25, 289
- (20) []Heck, D., et al 1998, CORSIKA: A Monte Carlo Code to Simulate Extensive Air Showers, Report FZKA 6019, Forschungszentrum Karlsruhe
- (21) []Heck, D., et al 2001, Proc. 27th Int. Cosmic Ray Conf. (Hamburg) 1, 233
- (22) []Hörandel, J. R., 2003, Astropart. Phys. 19, 193
- (23) []Inoue, N., et al 1997, Proc. 25th Int. Cosmic Ray Conf. (Durban) 4, 113
- (24) []Ivanenko, I. P., et al 1993, Proc. 23rd Int. Cosmic Ray Conf. (Calgary) 2, 17
- (25) []Kalmykov, N. N., Ostapchenko, S. S. 1993 Yad. Fiz. 56, 105, Phys. At. Nucl. 56(3), 346
- (26) []Kalmykov, N. N., et al 1997, Nucl. Phys. B (Proc. Suppl.) 52, 17
- (27) []Kawamura, Y., et al 1989, Phys. Rev. D40, 729
- (28) []Menn, W., et al 2000, Astrophys. J. 533, 281
- (29) []Mielke, H. H., et al 1994, J. Phys. G: Nucl. Part. Phys. 20, 637
- (30) []Mocchiutti, E., et al 2001, Proc. 27th Int. Cosmic Ray Conf. (Hamburg) 5, 1634
- (31) []Ryan, M. J., et al 1972, Phys. Rev. Lett. 28, 985
- (32) []Ulrich, H., et al (KASCADE collaboration) 2001, Proc. 27th Int. Cosmic Ray Conf. (Hamburg) 1, 97
- (33) []Sanuki, T., et al 2000, Astrophys. J. 545, 1135
- (34) []Seo, E. S., et al 1991, Astrophys. J. 378, 763
- (35)
- (36)
- (37)
- (38) []Siohan, F., et al 1977, J. Phys. G: Nucl. Phys. 3, 1157
- (39) []Smith, L. H., et al 1973, Astrophys. J. 180, 987
- (40) []Webber, W. R., et al 1987, Proc. 20th Int. Cosmic Ray Conf. (Moscow) 1, 325
- (41) []Wiebel-Sooth, B., et al 1998, Astron. Astrophys. 330, 389
- (42) []Zatsepin, V. I., et al 1993, Proc. 23rd Int. Cosmic Ray Conf. (Calgary) 2, 13